3660
Measures of lesion load on white matter fiber bundles for damage assessment1Medical Imaging, QMENTA Inc., Boston, MA, United States
Synopsis
Measures of lesion load are useful to study how damage in the white matter present in different pathologies relate to changes in cognitive function. So far, most research focus on global or local volumetric metrics, an approach that exhibits limitations in cases where small lesions in specific places cause major damages. In this work, we propose the combined use of a set of metrics that measure different aspects of the lesions over the major white matter bundles. We expose how these metrics provide complementary information, and discuss how its usefulness could be assessed in future work.
Introduction
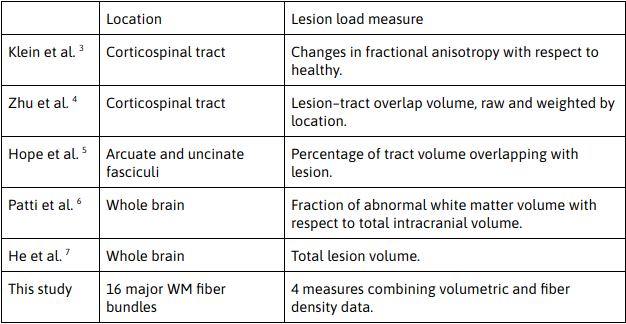
Characterization of the damage caused by white matter (WM) lesions on the major fiber bundles in the brain can be useful to analyze the influence of lesion location on cognitive function1. As shown in Table 1, previous studies proposed using some variation of lesion volume or similar as damage measures, always focused on specific WM fiber bundles or computed on the whole brain. This approach has some limitations since depending on the location and the number of affected fibers, a small lesion could have a large impact. Previously, we proposed a method to delineate major WM fiber bundles based on diffusion weighted MRI (dMRI) as fiber probability membership functions. In this work, we build upon those results and propose a set of metrics to asses the impact of WM lesions on specific WM structures computed by combining WM fiber bundles with lesion masks. These methods could contribute value to research into any disease involving WM hyperintensities, such as multiple sclerosis, Alzheimer’s disease or neuromyelitis optica.Methods
Reconstruction of streamlines tractographydMRI data can be used to compute a fiber orientation distribution of the white matter. Using the estimated orientations at each voxel streamlines are reconstructed using a tracking algorithm. In our approach, the generation of streamlines is started from seed points and constrained within anatomical regions of interest, hence generating WM fiber bundles. In this work, we used MRtrix software8 to generate the streamlines different WM fiber bundles combining results from probabilistic (iFOD29 ) and deterministic (SD_STREAM8) algorithms. Then fiber probability membership maps where obtained from the tracts in the form of visitation maps10, where voxels are weighted by the number of streamlines that cross them.
Lesion load measures
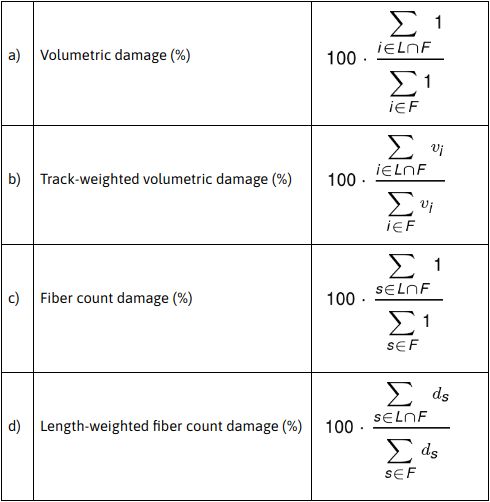
- Volumetric damage: Requires a visitation map of the WM fiber bundle and a lesion mask in the same space. To reduce effects from the noise inherent to probabilistic tractography, a tract binary mask is derived by thresholding the visitation map, removing voxels that contain less than 5% of fibers with respect to the voxel with the maximum number of fibers. We call this the set of voxels $$$i\in F$$$ belonging to the fiber bundle F. This mask is then intersected with the voxels in the lesion mask $$$i\in L$$$. The damage corresponds to the percentage of the thresholded WM fiber bundle that intersects lesion mask (Figure 1.a).
- Track-weighted volumetric damage: Requires the same inputs as volumetric damage. Similar to the previous measure but the thresholded mask is not binarized. The intersections with the lesion mask are weighted by the number of fibers contained in every voxel (Figure 1.b).
- Fiber count damage: Requires a track file with streamlines of the WM fiber bundle and a lesion mask in the same space. This metric measures the proportion of streamlines generated in the whole fiber bundle that are intersected by the lesions. It emphasizes the impact of lesions that intersect many fibers. For the set of streamlines $$$s\in F$$$ belonging to the fiber bundle F and the set of streamlines $$$s\in L$$$ that are intersected by the lesion L (Figure 1.c).
- Length-weighted fiber count damage: Requires the same inputs as fiber count damage. Similar to the previous one but the streamlines are weighted by their length ($$$d_{s}$$$). It accentuates the damage caused by lesions that intersect longer fibers (Figure 1.d).
Results
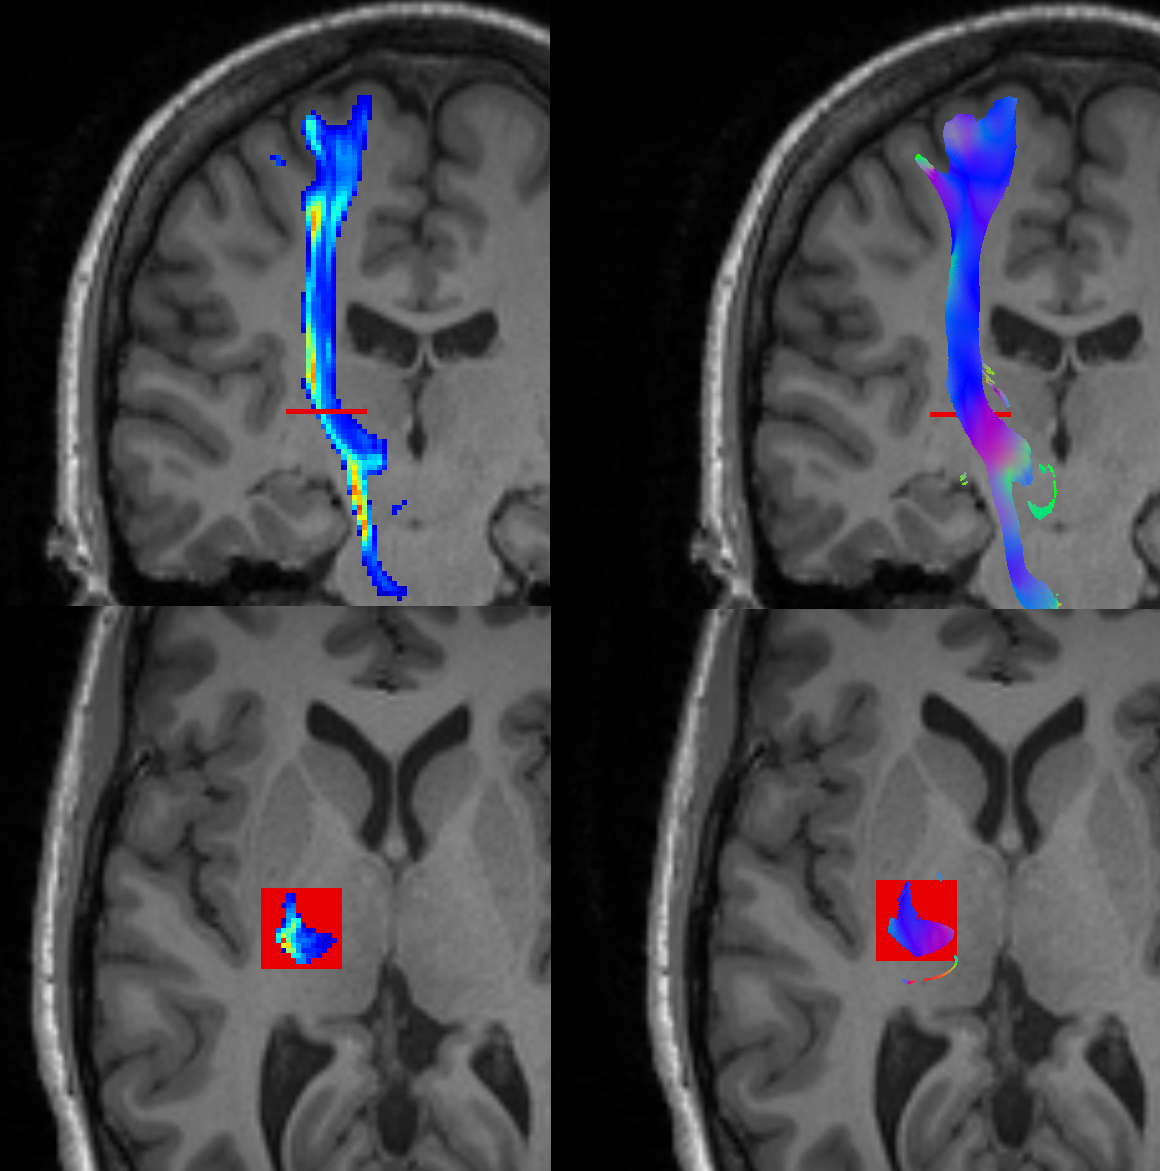
To understand the differences in the lesion load measures, let us consider a set of scenarios where they would be useful.Figure 2 shows the right corticospinal tract of a subject from CDMRI 2017 challenge data11. We created a binary mask simulating a thin lesion that intersects the whole bundle. In this scenario, the volumetric damages are less than 1%, the fiber count damages are both 100%.
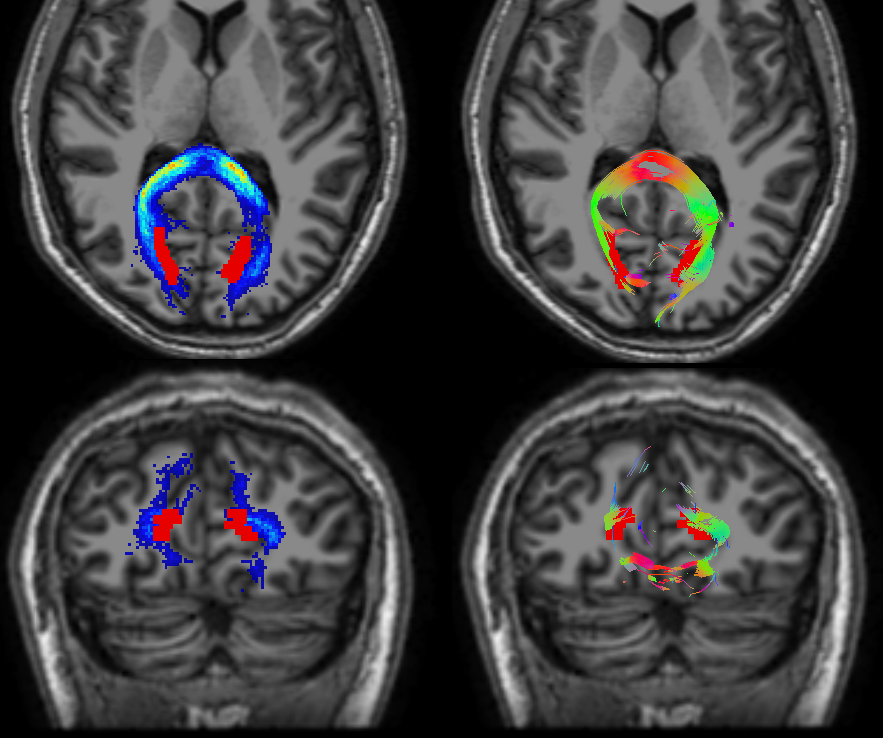
In Figure 3 we can see the forceps major of a selected subject from 2017 ISMRM’s traCED challenge12. In this scenario, the synthetic binary mask represents two large lesions that intersect the bundle but do not cut it through. The computed volumetric damage and track-weighted volumetric damages are 4% and 3.8% respectively. The fiber count damage and the length-weighted fiber count damage are 53% and 54% respectively.
These scenarios depict how the proposed lesion load measures can give complementary information and help characterize the damage caused to WM fiber bundles by lesions with respect to their morphology.
Discussion
Individually, each one of the proposed measures has limitations regarding its ability to describe the damage produced to a bundle. We propose combining them to take advantage of the complementary information that they provide. Since there is no gold standard in WM damage measures, further work would consist of testing the combined use of these measures against old approaches on patient’s data and assess its performance by checking which metric provides a better explanation of the phenotype.Conclusion
We propose a set of lesion load measures to assess damage produced to WM fiber bundles using fibers reconstructed from dMRI data. These measures offer complementary information that can provide relevant insight about how different WM fiber bundles are affected by different types of lesions considering their volume and shape and could be used to asses changes in cognitive functions in patients with WM lesions.Acknowledgements
No acknowledgement found.References
[1] Prčkovska et al. (2019) The structural disconnectome of the MS brain. Poster presented at the 35th Congress of the European Committee for Treatment and Research in Multiple Sclerosis (ECTRIMS). Stockholm, Sweden.
[2] Rowe, et al. (2017) ISMRM 2017: TraCED Challenge Entry – 3rd place. ISMRM 2017: TraCED Challenge (pp. 2–4).
[3] Klein et al. (2015) Measuring the lesion load of multiple sclerosis patients within the corticospinal tract. Proc. SPIE 9413, Medical Imaging 2015: Image Processing, 94130A.
[4] Zhu et al. (2010) Lesion Load of the Corticospinal Tract Predicts Motor Impairment in Chronic Stroke. Stroke.
[5] Hope et al. (2016). Distinguishing the effect of lesion load from tract disconnection in the arcuate and uncinate fasciculi. NeuroImage.
[6] Patti et al. (2015). Lesion load may predict long-term cognitive dysfunction in multiple sclerosis patients. PloS one.
[7] He et al. (2009) Impaired small-world efficiency in structural cortical networks in multiple sclerosis associated with white matter lesion load. Brain.
[8] Tournier et al. (2012) MRtrix: Diffusion tractography in crossing fiber regions. Technol.
[9] Tournier et al. (2010) Improved probabilistic streamlines tractography by 2nd order integration over fibre orientation distributions. Proceedings of the International Society for Magnetic Resonance in Medicine.
[10] Calamante et al. (2010) Track-density imaging (TDI): Super-resolution white matter imaging using whole-brain track-density mapping. NeuroImage.
[11] Tax et al. (2019) Cross-scanner and cross-protocol diffusion MRI data harmonisation: A benchmark database and evaluation of algorithms. NeuroImage.
[12] Nath et al. (2019), Tractography reproducibility challenge with empirical data (TraCED): The 2017 ISMRM diffusion study group challenge. J Magn Reson Imaging.
Figures