3656
Development of a quantification software for body composition imaging and its assessment in the patient with sarcopenia1Medical Science, Wonkwang University, Iksan, Republic of Korea, 2Medical Convergence Research Center, Wonkwang University, Iksan, Republic of Korea, 3Radiology, Wonkwang University, Iksan, Republic of Korea
Synopsis
In 2016, sarcopenia has been classified by the international classification of diseases(ICD-10-CM), with the code(M62.84). The role of imaging techniques has rapidly increased in the field of sarcopenia. In the past decade, the importance of muscle and fat mass has been emphasized on imaging evaluation of body composition including of muscle and body fat such as visceral fat or subcutaneous fat. However, there are diverse quantification methods for assessing muscle and fat mass by imaging and thus, these methods must be standardized. This study developed a customized quantification software based on ImageJ-platform and evaluated in the patient with sarcopenia.
Introduction
Sarcopenia has been classified by the international classification of diseases (ICD-10-CM), with the code M62.84 in 2016. Several studies in sarcopenia have proven its relationship with physical impairment and poorer quality of life, and increased morbidity, mortality, and health care costs. Recently, the concept of sarcopenia has been extended to various diseases, beyond merely being considered as a geriatric syndrome. In particular, the influence of sarcopenia on morbidity/mortality in cancer patients treated with chemotherapy or major surgery has been extensively investigated. The role of imaging techniques has rapidly increased in the field of sarcopenia. In the past decade, the importance of muscle and fat mass has been emphasized on imaging evaluation of body composition including of muscle and body fat such as visceral fat or subcutaneous fat. Currently, there are diverse quantification methods for evaluating muscle mass by imaging, and therefore, these methods must be standardized. Also, it is still lack of quantification software for easily evaluating the body composition mass. Therefore, the aim of this study was to develop a customized quantification software (Sarcopenia-ImageJ) based on ImageJ open source platform and to assess in the patients with suspected sarcopenia.Subjects and Methods
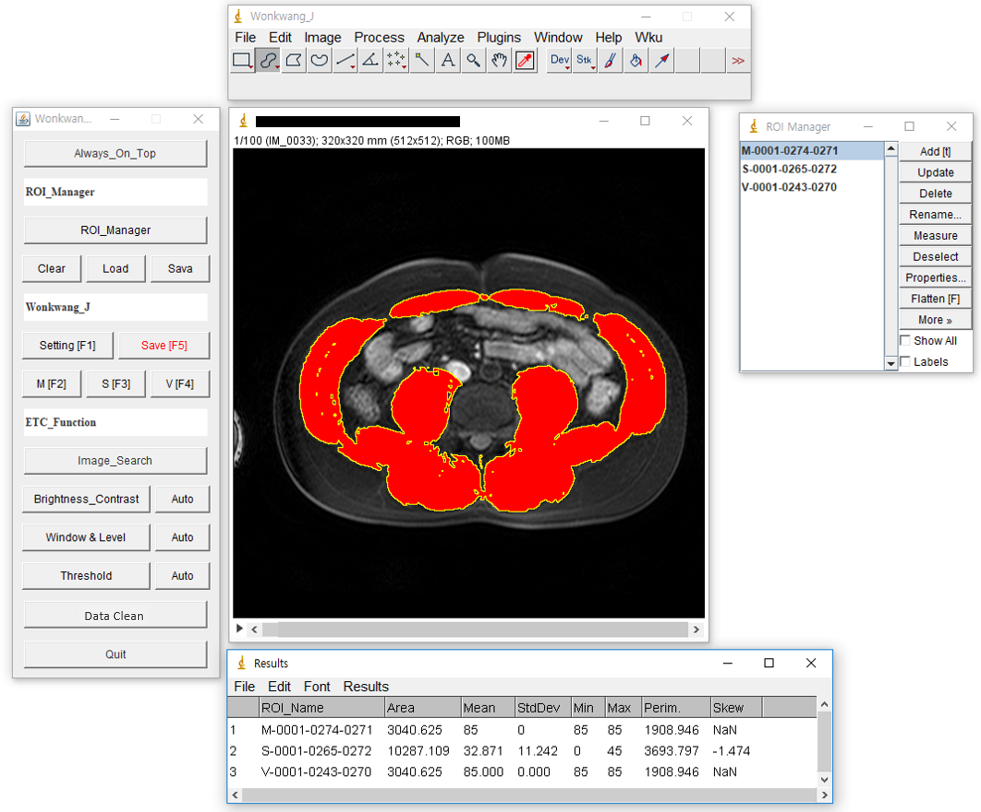
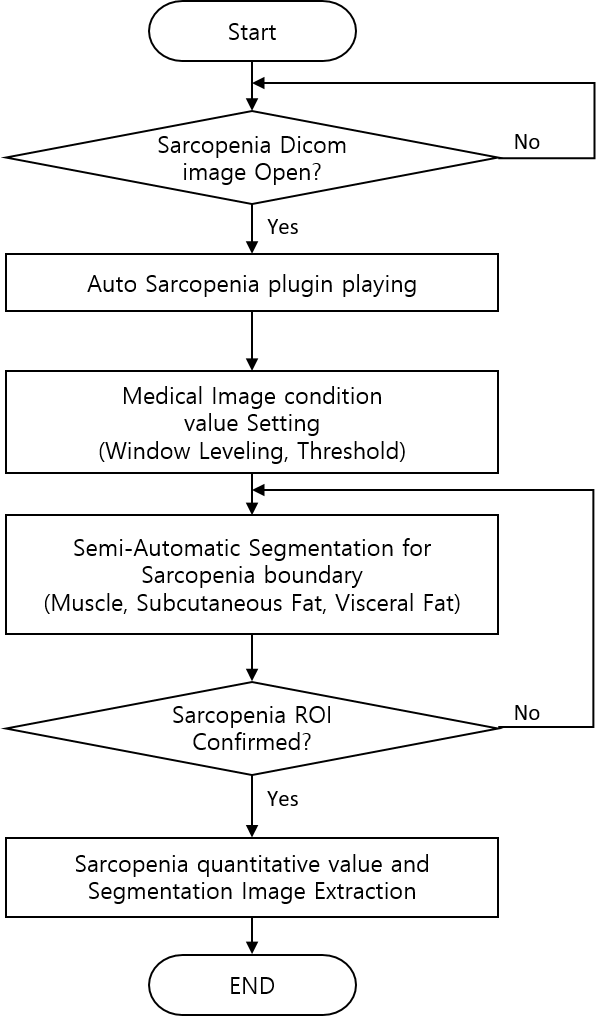
Sarcopenia-ImageJ program developed by the National Institutes of Health (NIH) ImageJ (Fig. 1). The quantification procedure was as follows: Sarcopenia-ImageJ plugin installation, condition value setting (window leveling, threshold), semi-automatic segmentation (muscle, subcutaneous fat, visceral fat), sarcopenia ROI confirmation and measurement of body composition areas & ratios (Fig. 2). The study protocol was approved by the institutional review board (IRB) of our University Hospital. A total of 60 subjects consisting of 30 patients with suspected sarcopenia (mean age 47.3 ± 19.4 yrs) and 30 normal controls (mean age 54.6 ± 17.2 yrs) were recruited for this study from January 2014 to April 2019. The inclusion criteria of sarcopenia were as follows: body mass index (BMI, kg/m2) 25.0 kg/m2 or higher and patients had symptoms such as obesity, high blood pressure and hyperglycemia. A normal control group was defined as 18 kg/m2 < BMI < 23 kg/m2.All MR scans were performed with a 3 T MRI system (Achieva; Philips Medical Systems, Best, The Netherlands) and a 32-channel array coil. The T1-weighted images (T1WI) were acquired with three-dimensional T1 high-resolution isotropic volume excitation (THRIVE) pulse sequence: TR/TE= 4.2/1.91 msec; field of view (FOV)= 38×38×14 cm3, matrix size= 512×512, slice thickness= 1.19×1.63×2.0 mm3, number of slices= 100 and total scan time = 16 sec. The abdominal images at the 3rd lumbar spine (L3) level were obtained in axial plane and the imaging sequence was triggered to expiration within a single breath-hold. The areas in the muscle (MA), subcutaneous fat (SA) and visceral fat (VA) were measured on the L3 level MR image in each subject. The ratios from the muscle and fat areas were calculated as follows: muscle area/subcutaneous fat area (= MA/SA), muscle area/visceral fat area (= MA/VA) and muscle/(subcutaneous fat + visceral fat) (= MA/(SA+VA)). The variations in body compositions between normal control and sarcopenia groups were compared using independent two sample T test. The significance threshold was set at p<0.05 (two-tailed test).
Results and Discussion
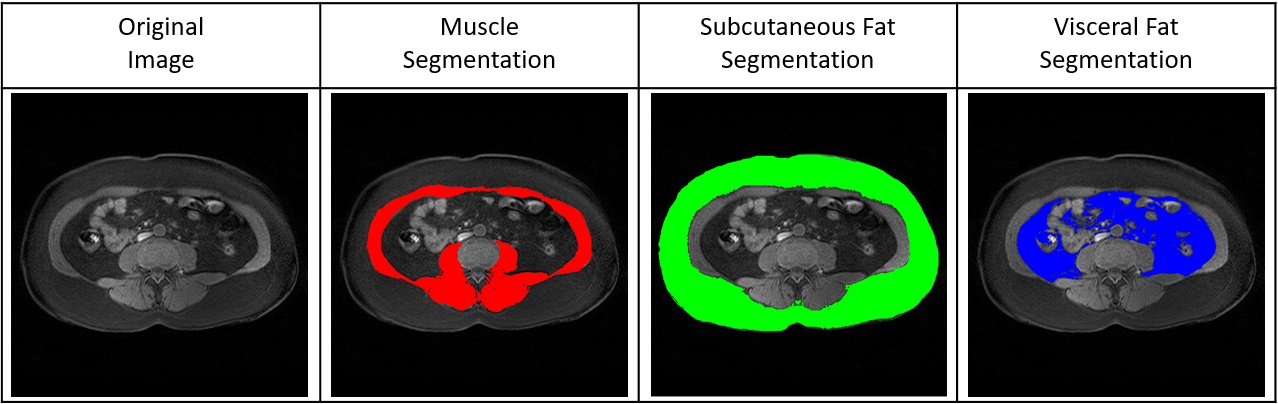
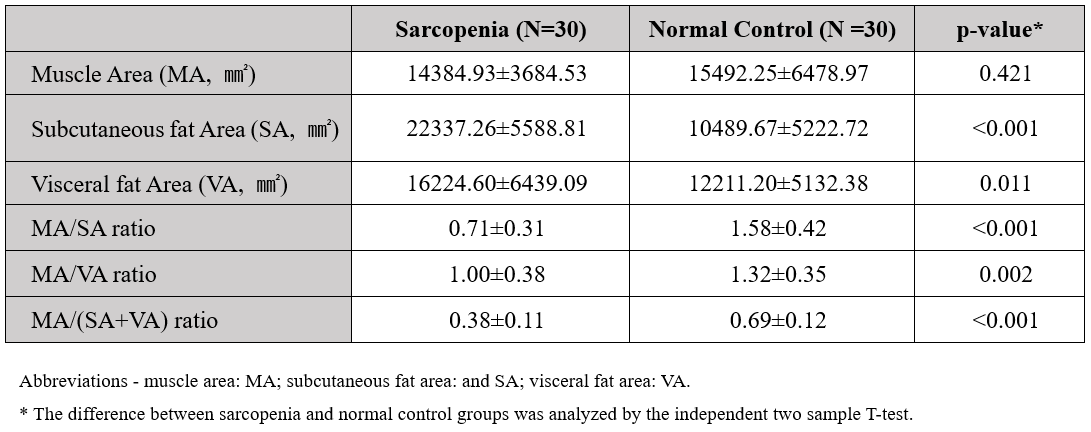
Figure 3 shows the representative MR image and muscle & fat ROIs for quantification. In the total post-processing time (including of condition value setting, segmentation, sarcopenia ROI confirmation and areas & ratios measurements), developed Sarcopenia-ImageJ was 3.24 ± 0.20 minutes (range, 2.5–3.6 minutes) and original ImageJ 20.84 ± 0.71 minutes (range, 22.1–18.9 minutes). Therefore, our Sarcopenia-ImageJ can reduce the post-processing time (about 84% reduction) in clinical application.The mean body composition areas and ratios in two groups are shown in Table 1. In the areas of body composition, there were significant differences in SA (p<0.001) and VA (p=0.011), whereas was no difference in MA (p=0.421). In the ratios, there are significant differences in MA/SA (p<0.001), MA/VA (p=0.002), and (MA/(SA+VA)) (p<0.001), respectively. Therefore, the body composition ratios might be better indicators for differentiating the sarcopenia patients compared to body composition areas.
Conclusion
This study developed a customized Sarcopenia-ImageJ software for assessment of body composition. Our software had the advantages for the use of an open source platform and rapid quantification time in clinical application. The clinical finding demonstrates that the quantitative body composition areas & ratios can help to differentially diagnose sarcopenia.Acknowledgements
This study was supported by the Korea Health Technology R&D Project through the Korea Health Industry Development Institute(KHIDI), funded by the Ministry of Health & Welfare(HI18C1216).References
1. Hai S., et al., “Association between sarcopenia with lifestyle and family function among community-dwelling Chinese aged 60 years and older”. BMC Geriatr, 2017; 17(1): 187.
2. Beaudart C, Zaaria M, Pasleau F, Reginster JY, Bruyère O. Health outcomes of sarcopenia: a systematic review and meta-analysis. PLoS One 2017; 12: e0169548
3. Santilli V, Bernetti A, Mangone M, Paoloni M. Clinical definition of sarcopenia. Clin Cases Miner Bone Metab 2014; 11: 177-180
4. Jean-Yves Reginster., et.al “Osteoporosis and sarcopenia: two diseases or one?”. Curr Opin Clin Nutr Metab Care. 2016; 19(1): 31-36.
Figures