3652
Intuitive MRI Data Visualization and Reslicing Using Augmented Reality1Massachusetts General Hospital, Boston, MA, United States, 2Harvard Medical School, Boston, MA, United States
Synopsis
We present a smartphone app to view 3D medical image data using Augmented Reality (AR). The app superimposes the imaged anatomy on the patient and allows for completely free and intuitive choice of viewing plane by rotating the phone and moving it towards and away from the patient. The app is shown to be enable free choice of viewing plane in a much easier and faster manner than standard medical image viewing software on a computer workstation. We envision this app to enable lower-cost, more mobile viewing of MRI data, potentially in combination with portable, low-field MR hardware.
Introduction
In recent years, great advances have been made in developing low-cost, portable hardware for MRI data acquisitions1,2, expanding the user base of MRI to poorer regions and more mobile situations. Less emphasis has been put on increased affordability and portability of equipment to view images post-acquisition. Visualization of MRI data is typically done on a computer workstation with specialized medical image viewing software. In addition to suboptimal cost and portability, operating such software often requires considerable expertise, particularly for advanced operations such as freely choosing a slice orientation not orthogonal to the original scan plane. Here, we introduce ARMRIViewer, a smartphone app we designed to enable visualization of MRI data on a standard iPhone.Methods
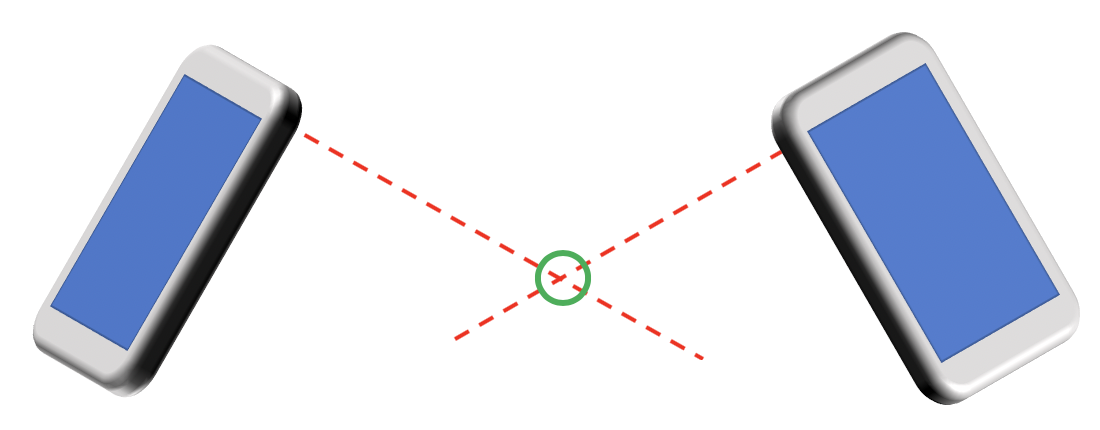
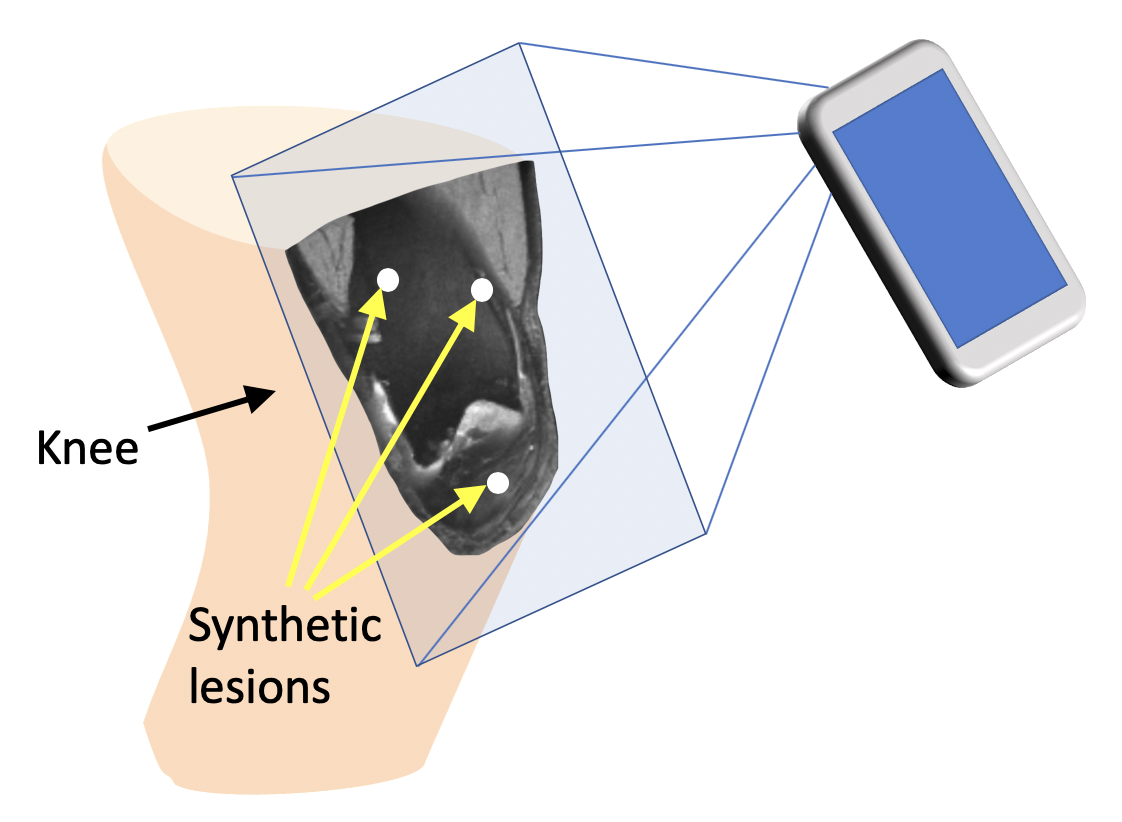
The app was written in the Swift programming language using Apple’s Xcode software development kit. It imports the MRI data in the form of a simple data file that contains the coordinates and intensity of each voxel. Once the data file is loaded, the 3D data is displayed hovering on the screen, using Apple’s ARKit3 and SceneKit4 frameworks. Each voxel is rendered as a separate 3D cube. At loading, the full dataset either appears at a fixed distance from the phone or at a user-specified location (Fig. 1). Slices through the object can be viewed by moving the phone closer to the dataset. The app displays only the data points beyond a fixed distance along the axis orthogonal to the phone, effectively giving a slice through the object at the specified distance. This distance can easily be changed using a sliding scale in the app. This gives the user great flexibility in choosing a plane and a slice location to view by simply moving and rotating the phone. To compare the effectiveness of the app to standard medical image viewing software, a knee dataset, acquired with the double-echo steady-state (DESS) sequence, was randomly chosen from the open-access osteoarthritis initiative (OAI). The resolution was downsampled to 2.8×2.8×2.8 mm3 to fit in phone memory. Three bright spherical lesions, 7mm in diameter, were randomly placed within the volume, as shown in Figure 2. This was repeated 6 times. A volunteer was then asked to obtain a visualization plane that intersected all 3 lesions. For 3 of the 6 datasets, the volunteer did this using the app, while for the other 3, the Horos medical image viewer software was used.Results
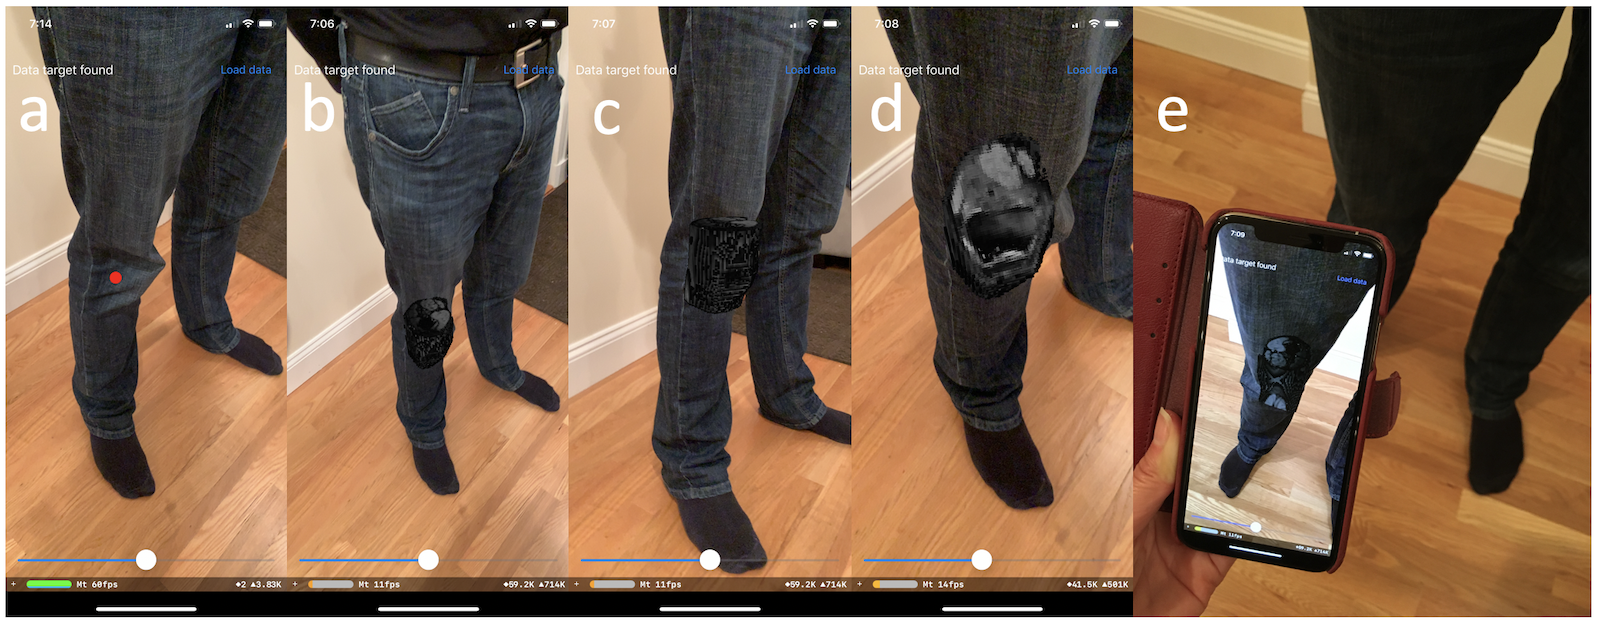
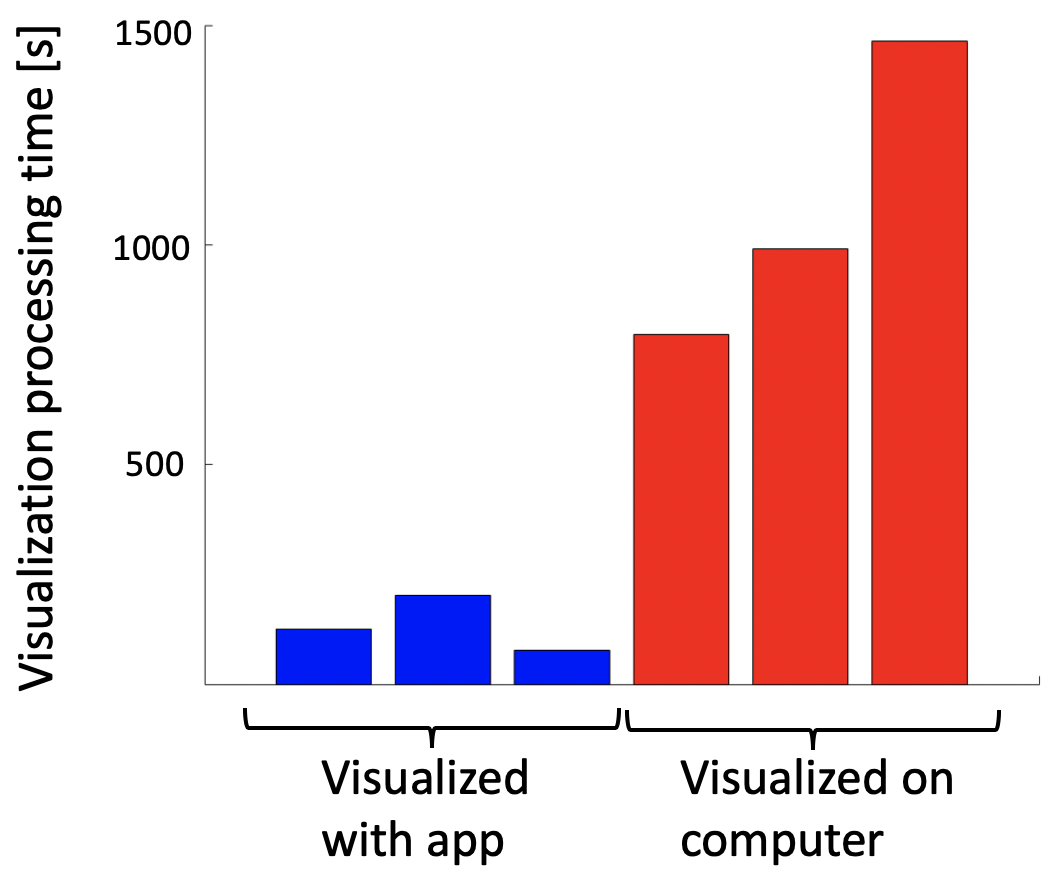
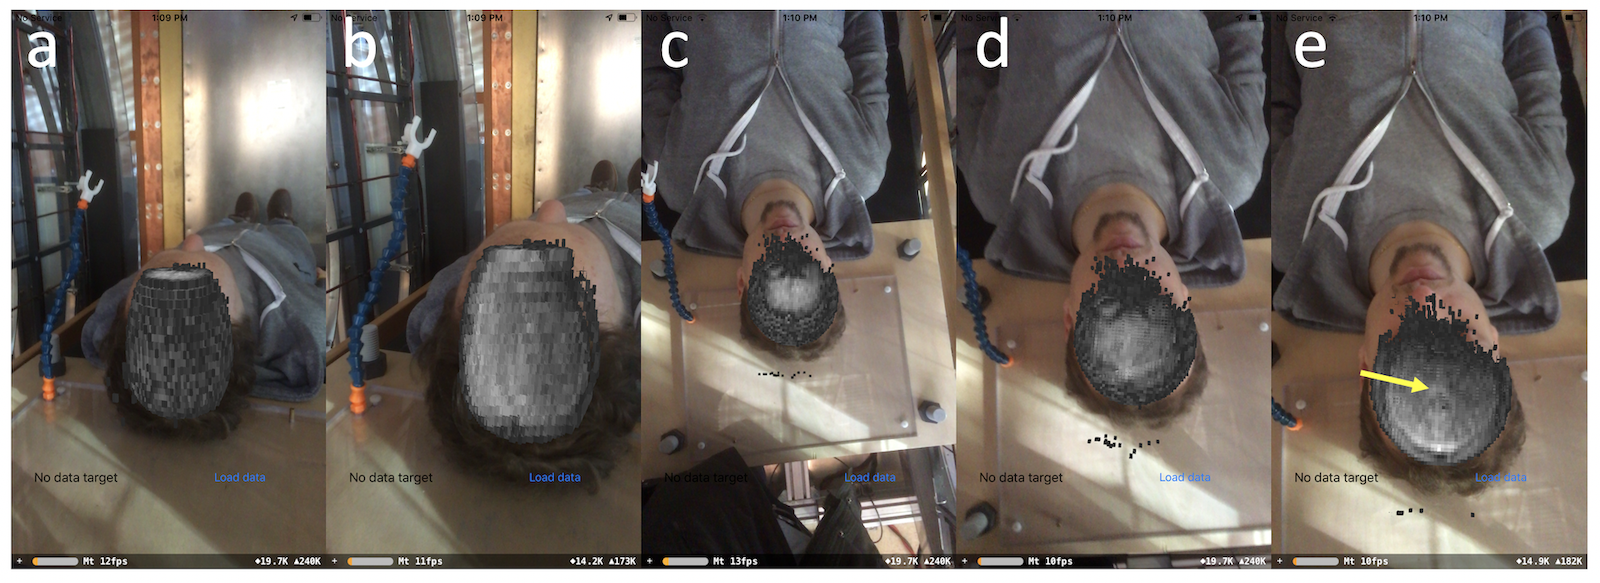
Sample images from the app are shown in Fig. 3a-e. At first, a red targeting dot is visible to help position the data (Fig. 3a). After pressing “Load Data”, the dataset appears in the desired spot (Figs. 3b-c). By moving the phone closer to the 3D data, or by moving the sliding scale at the bottom of the screen, the viewing plane “enters” the data set, parallel to the phone (Figs. 3d-e).The results of the experiment asking the volunteer to obtain a viewing plane that contained the 3 randomly placed lesions are shown in Figure 4. On average, using the workstation the operation took 1083 seconds while using the app took 135 seconds, giving an approximately 8-fold reduction in time.
Discussion
The presented app allows for visualization of MRI data using only a cell phone. This presents an inexpensive and portable option for MRI data analysis. Additionally, the app offers great flexibility in choosing the desired scan plane with no prior technical expertise. Furthermore, although the app can render any 3D data object contained in the data file, it is particularly well suited for low-field, portable MRI scanners, which often have a more open design. In a clinical scanner, the anatomy being scanned is not easily visible except along the scanner bore, and the strong magnetic field could potentially damage the phone. In such a system, the patient would therefore likely need to be rolled out of and away from the scanner before using the software. In an open-design, low-field system, the patient can be examined with the app while lying in the scanner as shown in Figure 5.Conclusion
ARMRIViewer, a custom-made app, allows for low-cost and flexible visualization of MRI data on a standard iPhone.Acknowledgements
DARPA 2016D006054References
1. Sarracanie et al. Low-cost high-performance MRI. Scientific Reports, 2015. 2. Wald et al. Low-cost and portable MRI. JMRI 2019. 3. https://developer.apple.com/documentation/arkit 4. https://developer.apple.com/documentation/scenekit 5. https://horosproject.org
Figures