3646
Utility of Whole-Liver Histogram and Texture Analysis on T1 Maps in the Risk Stratification of Advanced Fibrosis in NAFLD1Radiology, Ruijin Hospital affiliated to Shanghai Jiaotong University School of Medicine, Shanghai, China, 2Siemens healthcare, Shanghai, China, 3Siemens healthcare, Erlangen, Germany
Synopsis
We aim to assess the utility of whole-liver
texture analysis on T1 maps for the risk stratification of advanced fibrosis in
patients with suspected NAFLD. Our experiments show that whole-liver histogram
and texture parameters of T1 maps can distinguish NAFLD patients with an
intermediate-to-high risk of advanced fibrosis. A combination of histogram and
texture parameters as a multivariate model showed a better diagnostic
performance than any sole parameter and noninvasive fibrosis test in risk
stratification of advanced fibrosis.
Background and Purpose
Presence of advanced fibrosis is the most important prognostic factor in NAFLD and is correlated with liver-related outcomes and mortality [1,2]. The purpose of this study was to assess the utility of whole-liver texture analysis on T1 maps for the risk stratification of advanced fibrosis in patients with suspected NAFLD.Methods
A total of 53 patients with suspected NAFLD (aged 24-73 years, 22 women and 31 men) underwent MR scans on a 1.5T MR system (MAGNETOM Aera, Siemens Healthcare, Erlangen, Germany). A two-step approach combining the Nonalcoholic Fatty Liver Disease Fibrosis Score (NFS) and Fibrosis-4 Index (FIB-4) with the Liver Stiffness Measurement (LSM) for the risk stratification of advanced fibrosis were used, NFS and FIB-4 were calculated with the formula mentioned in previous studies[2-4]. LSM were performed using the vibration-controlled transient elastography technology (FibroScan device; Echosens, Paris, France), with an M probe. Before the T1 map acquisition, a B1 map used for T1 map correction was acquired by using a TurboFLASH sequence with the following parameters: TR/TE = 4280/2.04 ms; field of view = 380 × 309 mm2; matrix = 64 × 64; flip angle = 8 degree; slice thickness = 8 mm; number of slices = 18; and duration = 9 s. The T1 map was obtained using a variable-flip-angle (VFA) method with flip angles of 3 and 15 degrees, which were automatically calculated by the software based on the TR and the estimated target T1 of 1000 ms. Other scan parameters were as following: TR/TE = 4.61/2.26 ms; field of view = 380 × 309 mm2; matrix = 179 × 256; slice thickness = 3.5 mm; slices per slab = 72; and duration = 19 s. The B1-corrected T1 map was inline generated after the data acquisition. Semi-automated whole-liver segmentation and the following histogram and texture analysis over the whole liver were performed on the T1 map by using the prototype MR Multiparametric Analysis software (Siemens Healthcare, Erlangen, Germany). Univariate analysis was performed to identify significant parameters. Binary logistic regression analysis with a backward stepwise selection procedure was performed to identify the independent parameter for differentiating the low-risk from the intermediate-to-high risk group. Diagnostic performance was evaluated with receiver operating characteristic (ROC) analysis. The DeLong test was used to compare the area under the ROC curve (AUC).Results
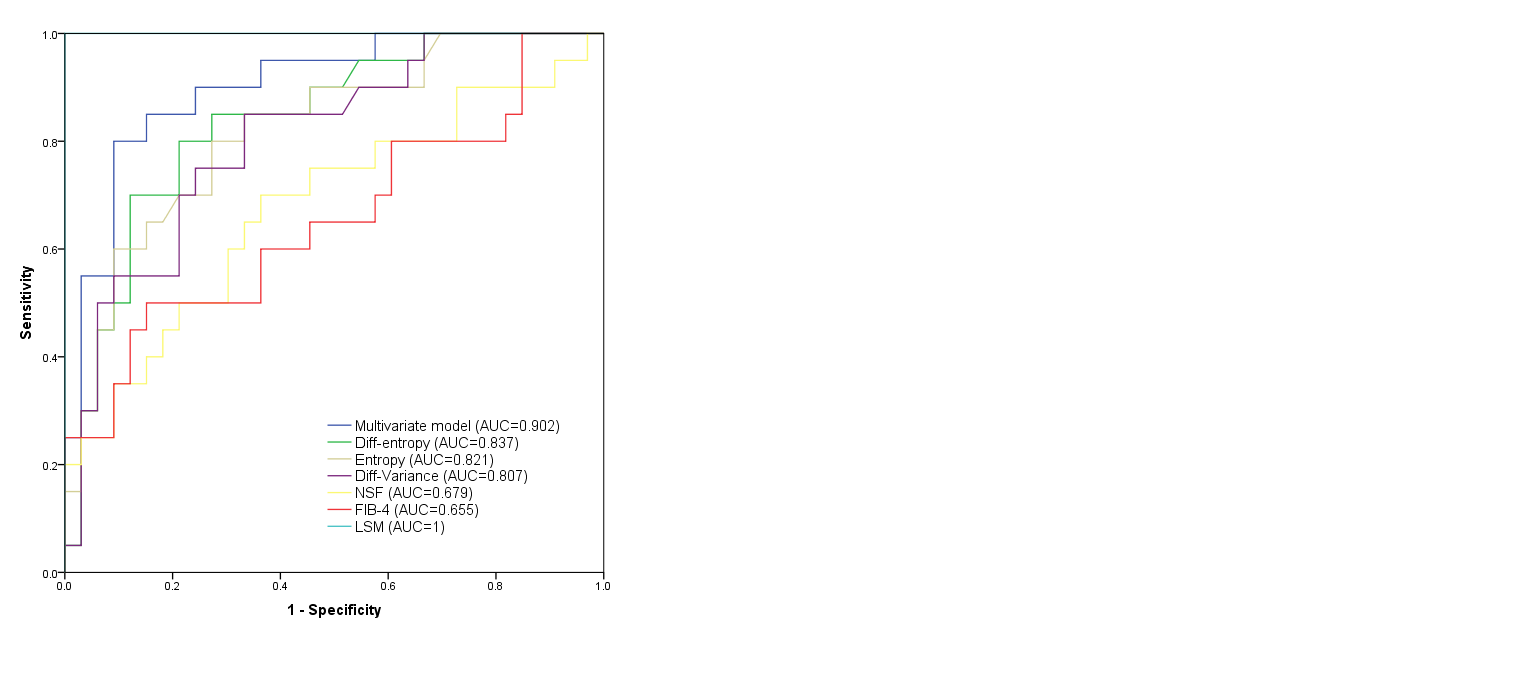
Among 53 patients included in our final study population, 33 (62.2%) were in the low-risk group and 20 (37.8%) were in the intermediate-to-high-risk group. Eleven histogram and texture parameters (volume, mean, SD, median, 5th percentile, 95th percentile, kurtosis diff-entropy, diff-variance, contrast, and entropy) showed significant differences between the low-risk group and intermediate-to-high-risk group (all P < 0.05). The significantly different histogram and texture parameters showed diagnostic performances with AUCs in ROC analyses ranging from 0.679 to 0.837, among which diff-entropy, entropy, and diff-variance showed the best performances, with AUC of 0.837 (95% CI 0.73-0.95), 0.821 (95% CI 0.71-0.94), and 0.807 (95% CI 0.69-0.93), respectively. Binary logistic regression analysis was run on the eleven parameters with a forward stepwise selection procedure; the optimal combination included the median, 5th percentile, and diff-entropy yielding an AUC of 0.902 (95% CI: 0.82-0.99, sensitivity of 80.0%, specificity of 90.9%). A DeLong test showed that the AUC of the multivariate model was significantly higher than that of any sole parameter and noninvasive fibrosis test (NFS and FIB-4) (all P < 0.05). No significant difference was observed between the multivariate model and LSM Liver Stiffness Measurement.Discussion and Conclusion
Histogram and texture analyses as statistical tools have been increasingly used in staging liver fibrosis in chronic liver disease[6], Consistent with other studies[7], our study demonstrated that entropy, diff-entropy, and diff-variance have the potential for detecting advanced fibrosis. The lower diagnostic performance of kurtosis for differentiating intermediate-to-high risk of advanced fibrosis from low risk in our study compared with previous reports[7] requires further explanation. Our results showed the whole-volume histogram and texture analysis on the T1 map has the potential to discriminate between low-risk and intermediate-to-high-risk advanced fibrosis. The combination of significant texture parameters yielded a better performance for the risk stratification of advanced fibrosis in NAFLD. These results warrant further studies with a larger patient population to confirm our findings.Acknowledgements
References
[1] Janubhai PP, Chieh-Yu CJ, Banh X, et al. Clinically Significant Fibrosis Is Associated With Longitudinal Increases in Fibrosis-4 and Nonalcoholic Fatty Liver Disease Fibrosis Scores. Clin Gastroenterol Hepatol. 2019 .
[2] Vilar-Gomez E, Chalasani N. Non-invasive assessment of non-alcoholic fatty liver disease: Clinical prediction rules and blood-based biomarkers. J Hepatol. 2018. 68(2): 305-315.
[3] Blond E, Disse E, Cuerq C, et al. EASL-EASD-EASO clinical practice guidelines for the management of non-alcoholic fatty liver disease in severely obese people: do they lead to over-referral. Diabetologia. 2017. 60(7): 1218-1222.
[4] Chan WK, Treeprasertsuk S, Goh GB, et al. Optimizing Use of Nonalcoholic Fatty Liver Disease Fibrosis Score, Fibrosis-4 Score, and Liver Stiffness Measurement to Identify Patients With Advanced Fibrosis. Clin Gastroenterol Hepatol. 2019
[5] Angulo P, Kleiner DE, Dam-Larsen S, et al. Liver Fibrosis, but No Other Histologic Features, Is Associated With Long-term Outcomes of Patients With Nonalcoholic Fatty Liver Disease. Gastroenterology. 2015. 149(2): 389-97.e10.
[6] Kato H, Kanematsu M, Zhang X, et al. Computer-aided diagnosis of hepatic fibrosis: preliminary evaluation of MRI texture analysis using the finite difference method and an artificial neural network. AJR Am J Roentgenol. 2007. 189(1): 117-22.
[7] Cannella R, Borhani AA, Tublin M, Behari J, Furlan A. Diagnostic value of MR-based texture analysis for the assessment of hepatic fibrosis in patients with nonalcoholic fatty liver disease (NAFLD). Abdom Radiol (NY). 2019. 44(5): 1816-1824.
Figures
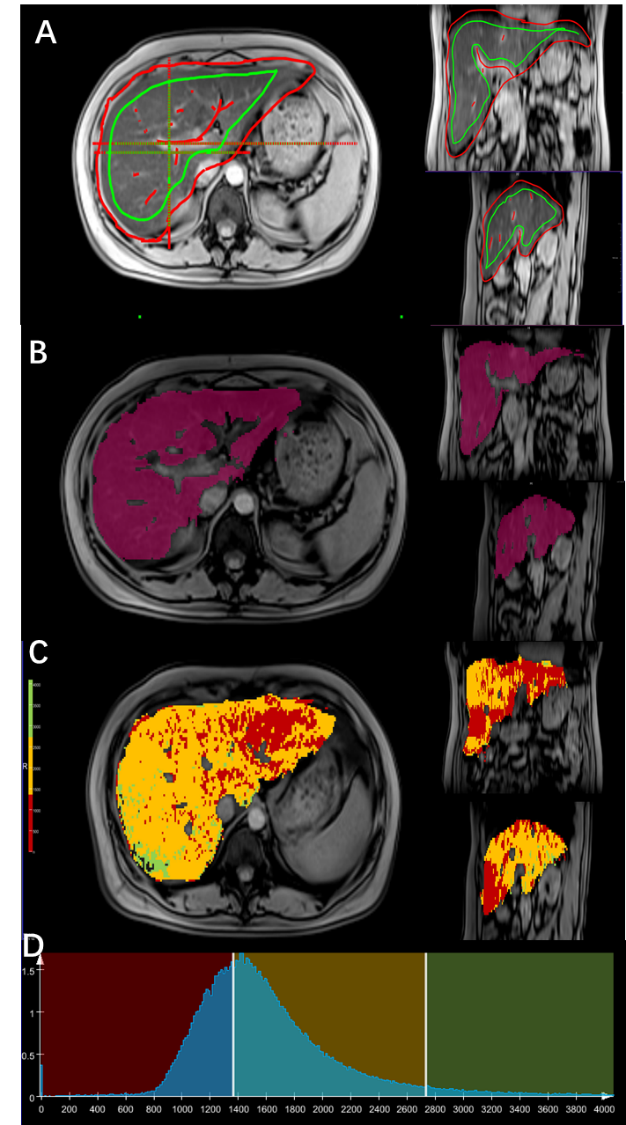
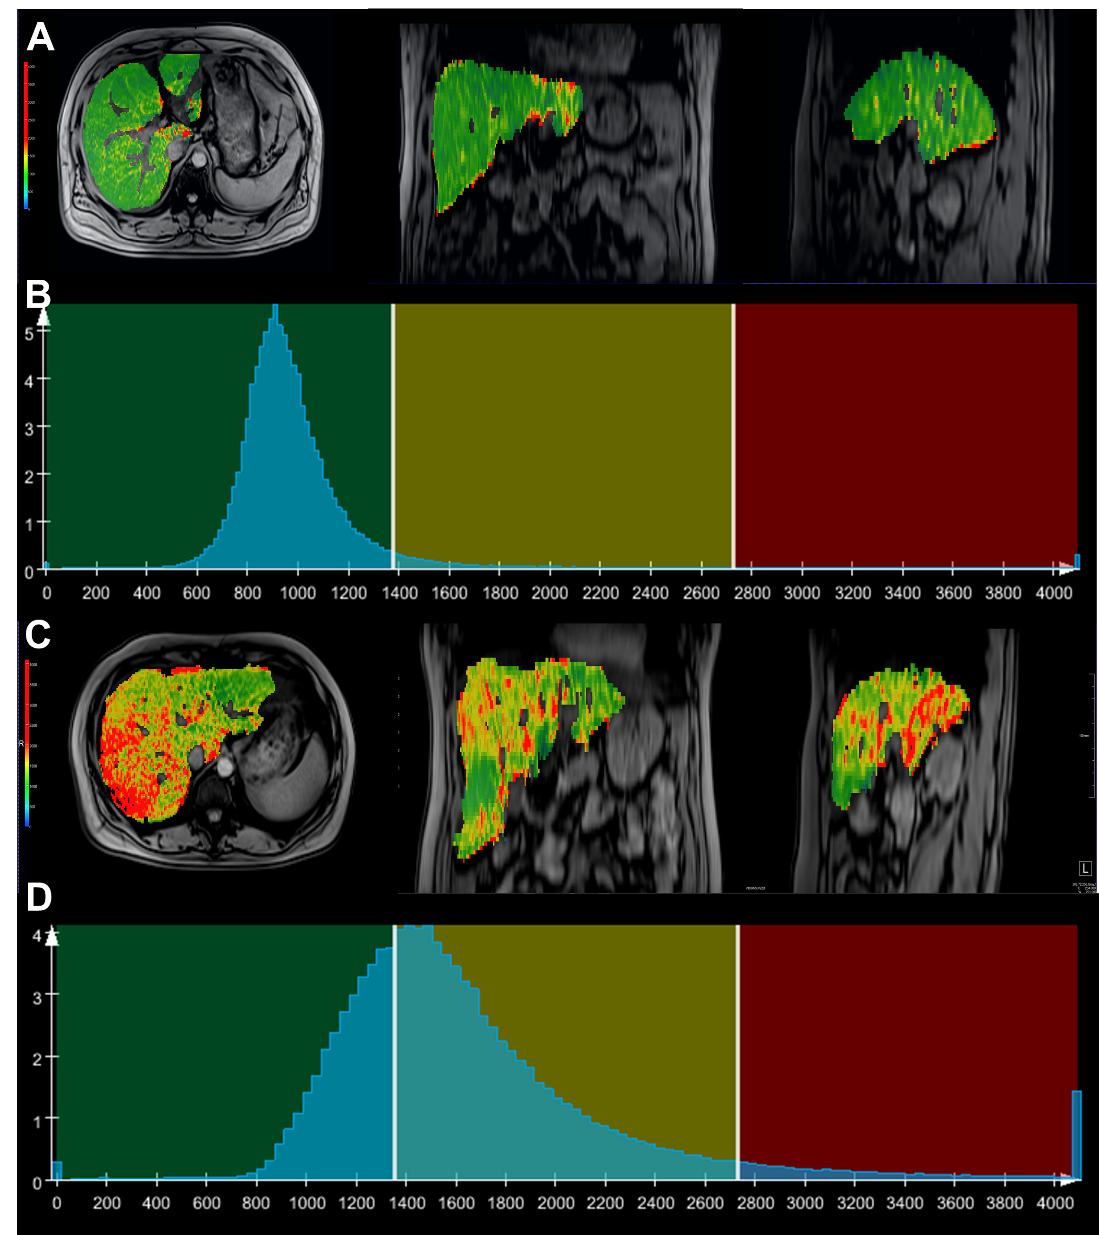
Figure 1. Workflow of the histogram and texture analysis.
A. During the semi-automated segmentation step, foreground and background seed points were manually drawn inside (green color) and outside (red color) of the liver parenchyma respectively on the T1-weighted images with flip angle of 15 degrees.
B. Whole-liver segmentation was created
C. T1 map of the liver D. Histogram of T1 map