3639
Quantitative and Volumetric Assessment of a Deep Cascade Network for MR Reconstruction Under Different Acceleration Factors1University of Calgary, Calgary, AB, Canada, 2General Electric Healthcare, Calgary, AB, Canada
Synopsis
Magnetic resonance (MR) imaging still has a high acquisition time due to inherent sequential procedure required to fill k-space. Deep-cascade networks have been used to reconstruct MR images from an under-sampled k-space in order to reduce acquisition time. In this work we investigate a deep-cascade to reconstruct MR images of the brain. We trained the network with 14 different acceleration factors (R). Relevant brain structures were preserved until R = 7x. For R ≥ 8x, MR images presented noticeable blurring artifact. The quality of the segmentation of the brain structures were similar to the reference MR image until R=9.
Introduction
Magnetic resonance (MR) imaging still has a high acquisition time due to inherent sequential procedure to fill the k-space1,2,3. One of the strategies to reduce the acquisition time is under-sampling the k-space below the Nyquist rate. However, insufficient sampling in k-space results in aliasing artifacts in the image domain. Compressed sensing (CS)3,4 has been applied to reconstruction of MR images from under-sampled k-space data to solve this problem. This reconstruction from an under-sampled k-space, involves solving an underdetermined system using nonlinear optimization algorithms, requiring in a high computational time3. Deep cascade5,6 networks have been proposed to mitigate this problem. In this work, we investigate a deep cascade, called WW-net6, which is composed of a cascade of four U-nets7 and consistency layers5 to reconstruct MR images of the brain. We trained the network with different acceleration factors (R), analysing the quality of the reconstruction and how the acceleration factor can impact on the quality of the segmentation of brain structures.Materials and Methods
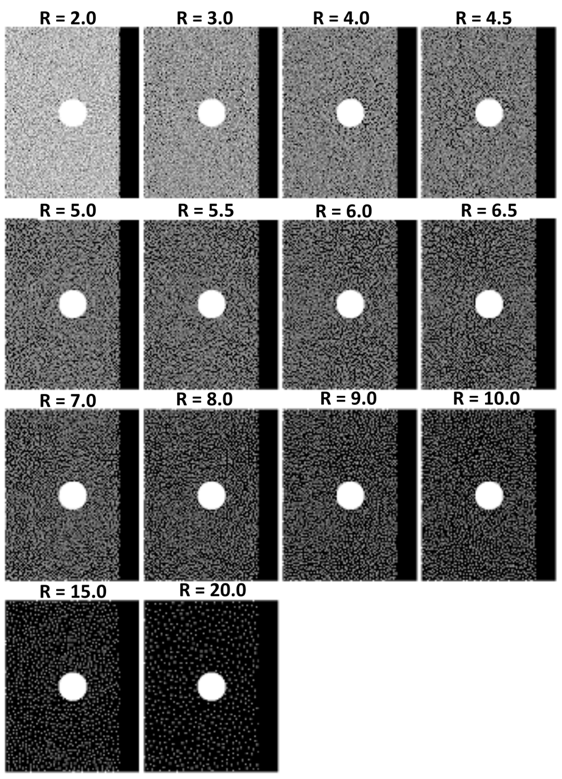
The dataset used has 111 volumetric T1-weighted images. The network was trained from scratch over 50 epochs using Adam optimizer8 with a learning rate of 0.003 and a mean squared error (MSE) loss function. Forty-three volumes (11,008 slices) were used for training, 18 volumes (4,608 slices) for model selection (validation), and 50 volumes (12,800 slices) for testing. Poisson-disc sampling9 was adopted to under-sample k-space with the central region being fully sampled within a circle of radius 16 (Fig. 1). We under-sampled k-space using 14 different acceleration factors (R): 2x, 3x, 4x, 4.5x, 5x, 5.5x, 6x, 6.5x, 7x, 8x, 9x, 10x, 15x and 20x. For image quality assessment, the reconstruction images were evaluated with four metrics: normalized root mean squared error (NRMSE), peak signal-to-noise ratio (pSNR), structural similarity10 (SSIM) index, and visual information fidelity11 (VIF). The metrics were computed for each image. The first 10 slices, from the top, and the first 50 slices, from the bottom, were removed to maximize the number of brain-containing images. The reference image was computed using the inverse Fourier transform on the fully sampled k-space. Since the morphometric analysis of the brain structures can help in the diagnosis of many diseases,12 different brain structures were measured in order to analyse how the acceleration factor can impact in the segmentation of brain structures. The segmentation was performed using Freesurfer.13 The brain structures evaluated were: brain volume, cortex volume, white matter volume, and hippocampus. These structures are often used to detect brain abnormalities, such as Alzheimer's disease.14 Nonparametric Kruskal-Wallis and Dunn’s (with Bonferroni correction) tests were used for statistical analysis.Results
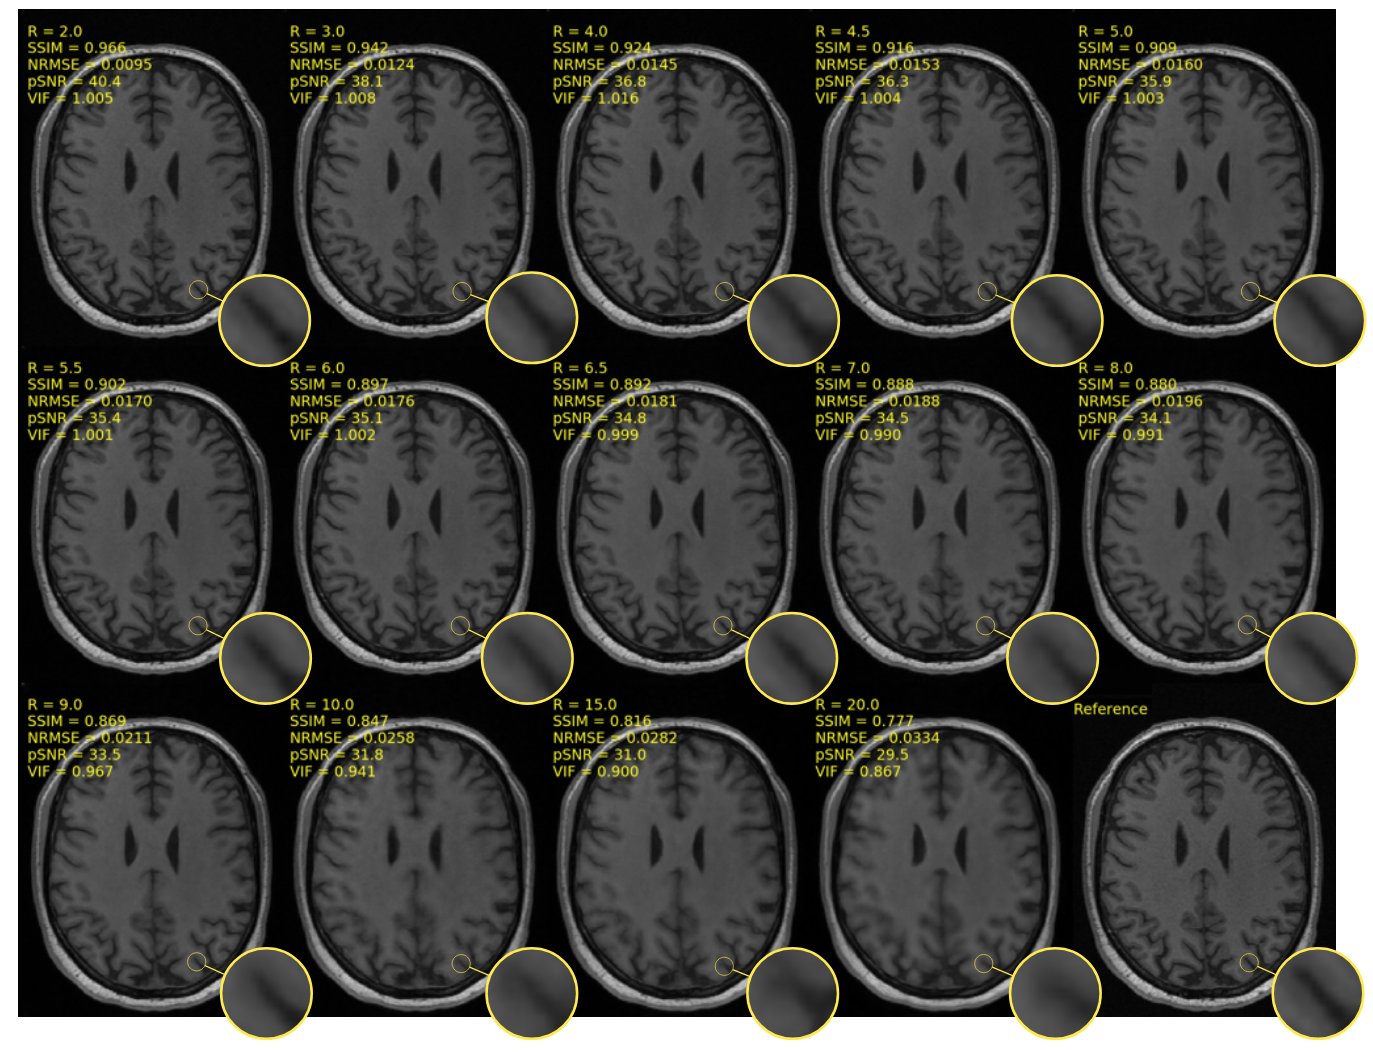
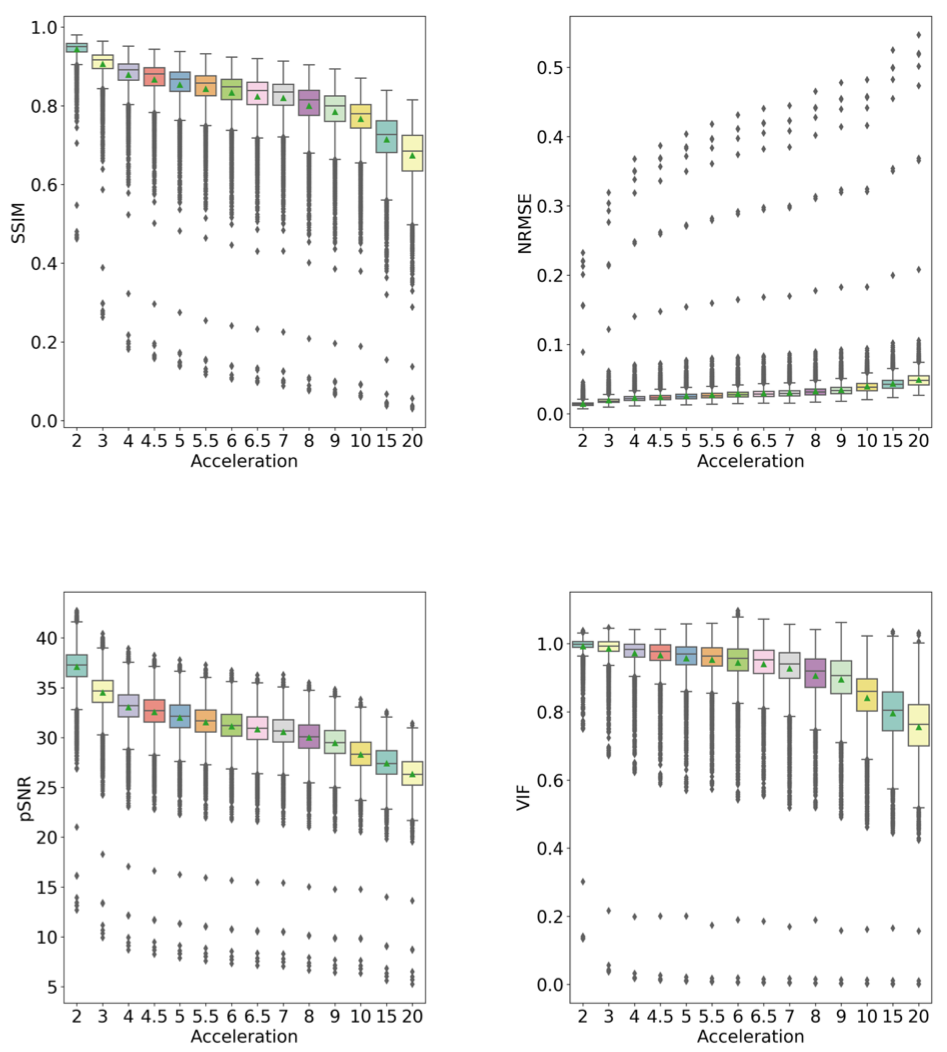
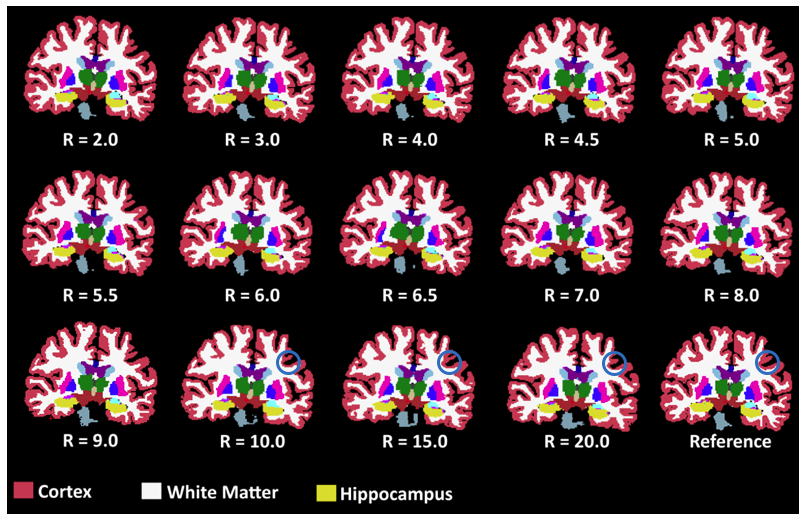
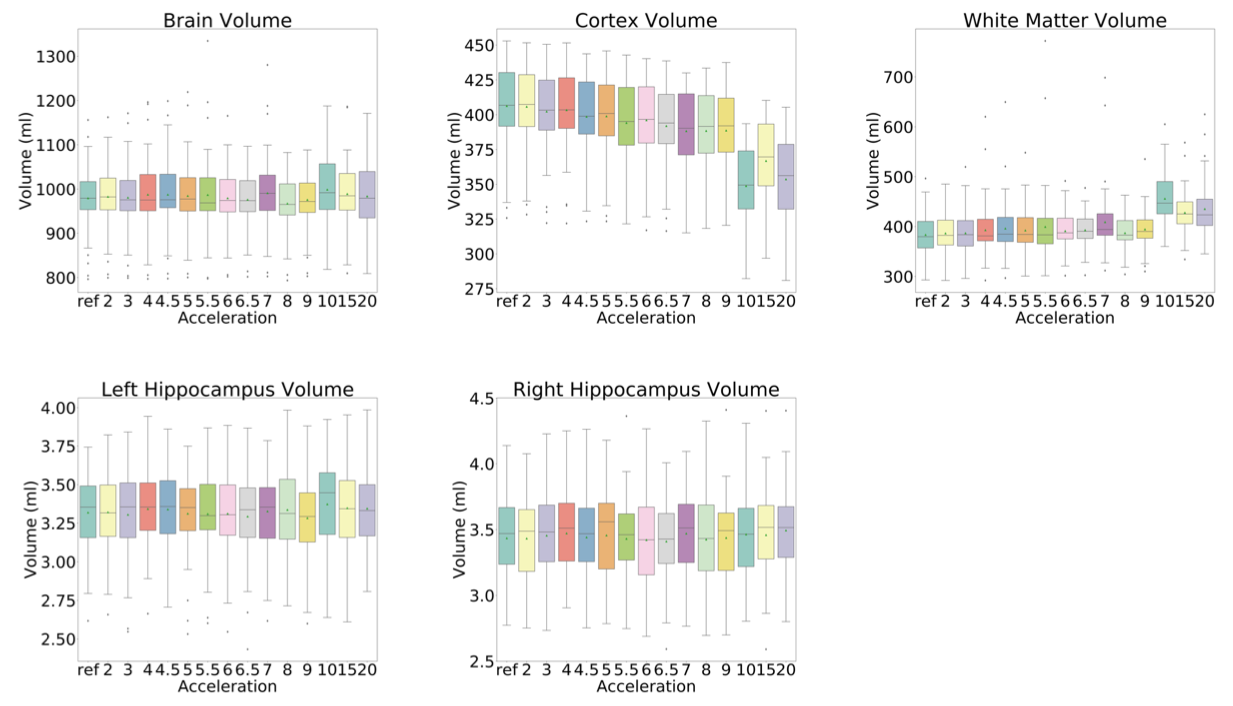
The results of the reconstruction are presented in Fig 2. After R = 7 the error rate grows faster than the previous reconstruction (Fig 3), and the MR images become more blurred. The metrics NRMSE and pSNR showed a symmetric and low variability error (Fig. 3). The SSIM and VIF, showed a high variability with a slightly skewed error (Fig. 3). The Kruskal-Wallis test determined a statistical significance (p < 0.01) across the cortex and white volume (Fig. 4-5). Dunn’s test indicated statistical significance (p < 0.05) difference between the reconstruction R = 10, 15, and 20 (Fig. 5).Discussion
Most of the outliers reported in Fig. 3 are from images containing only a small portion of the brain. The metrics that model human vision (SSIM and VIF) presented a higher variability. For R ≥ 10x, the cortex becomes brighter and during the structural segmentation, it decreases and the white matter volume increases, causing artefactual volume difference. However, the brain and hippocampus volume remained similar to reference for all acceleration factors. With the increase of the acceleration factor, the MR images become more blurred. The blurring artifact is associated with the loss of high-frequency information due the k-space sampling strategy and the loss function used by the model.5,6Conclusion
Some reconstruction presented a blurring artifact for higher acceleration factors, more noticeable for R ≥10. However, this evaluation showed that for R ≥ 8x, the whole brain and the hippocampus volume remain close to reference volume, not presenting any statistical difference between them. It showed that MR image reconstruction with high acceleration factor have the potential to be used for brain and hippocampus volume analyses. Further analysis is required to verify the impact on other structures of the brain.Acknowledgements
The authors would like to thank NVidia for providing a Titan V GPU, Amazon Web Services for access to cloud-based GPU services. W.L. acknowledges the University of Calgary Eyes High Fellowship. M.B. was supported by the Canadian Open Neuroscience Platform Fellowship. R.S. was supported by an NSERC CREATE I3T Award and the T. Chen Fong Fellowship in Medical Imaging from the University of Calgary. R.F. holds the Hopewell Professorship of Brain Imaging at the University of Calgary.References
1. A. G. van der Kolk, J. Hendrikse, J. J. Zwanenburg, F. Visser, and P. R. Luijten. Clinical applications of 7T MRI in the brain. European Journal of Radiology, 82(5):708 – 718, 2013.
2. Castillo MD, Mauricio. Spinal Imaging: Critical Topics for Clinical Practice. Jaypee Brothers Medical Publishers Pvt Ltd; 2nd Edition.
3. D. Bhabesh, and D. Sumit. Compressed Sensing Magnetic Resonance Image Reconstruction Algorithms: A Convex Optimization Approach. Springer Nature Singapore Pte Ltd.
4. E. Yonina C., K. Gitta. Compressed Sensing: Theory and Applications. Cambridge University Press.
5. J. Schlemper, J. Caballero, J. V. Hajnal, A. N. Price, and D. Rueckert. A Deep Cascade of Convolutional Neural Networks for MR Image Reconstruction. IEEE transactions on Medical Imaging, vol. 37, no. 2, pp. 491–503, 2018.
6. Souza, R., Frayne, R. A Hybrid Frequency-domain/Image-domain DeepNetwork for Magnetic Resonance Image Reconstruction, arXiv preprint arXiv:1810.12473, 2018.
7. O. Ronneberger, P. Fischer, and T. Brox. U-net: Convolutional networks for biomedical image segmentation. Lecture Notes in Computer Science (including subseries Lecture Notes in Artificial Intelligence and Lecture Notes in Bioinformatics), 9351:234–241, 2015.
8. D. P. Kingma and J. Ba. Adam: A method for stochastic optimization. arXiv preprint arXiv:1412.6980, 2014.
9. C. Yuksel. Sample elimination for generating Poisson disk sample sets. Computer Graphics Forum, 34(2):25–32, May 2015.
10. Zhou Wang, A. C. Bovik, H. R. Sheikh, and E. P. Simoncelli. Image quality assessment: from error visibility to structural similarity. IEEE Transactions on Image Processing, 13(4):600–612, April 2004.
11. T.-Y. Kuo, P.-C. Su, and C.-M. Tsai. Improved visual information fidelity based on sensitivity characteristics of digital images. Journal of Visual Communication and Image Representation, 40:76 – 84, 2016.
12. E. Marciniewicz, A. Pokryszko-Dragan, P. Podgorski, K. Małyszczak, A. Zimny, A. Kołtowska, S. Budrewicz, M. Sa ̧siadek, and J. Bladowska. Quantitative magnetic resonance assessment of brain atrophy related to selected aspects of disability in patients with multiple sclerosis: Preliminary results. Polish Journal of Radiology, 84:e171–e178, 2019.
13. Freesurfer Software Suite. https://surfer.nmr.mgh.harvard.edu/. Accessed October 1st, 2019.
14. Anand KS, Dhikav V. Hippocampus in health and disease: An overview. Ann Indian Acad Neurol. 2012 Oct;15(4):239-46.
Figures