3624
Deep Learning-Based Adaptive Noise Reduction for Improving Image Quality of 1.5T MR Images1Radiology, International University of Health, School of medicine, Chiba, Japan, 2Canon Medical Systems Corporation, Kanagawa, Japan, 3International University of Health and Welfare Hospital, Tochigi, Japan, 4International University of Health and Welfare, Tochigi, Japan
Synopsis
We assessed the performance of the Deep Learning-based Reconstruction (dDLR) technique in improving 1.5T MR images. Eleven volunteers underwent MR imaging at 3T and 1.5T on the same day with the same imaging parameters. We applied the dDLR to the 1.5T image data (dDLR-1.5T), and then compared the 1.5T and dDLR-1.5T datasets with reference to the 3T dataset. The structure similarity of dDLR-1.5T was higher than that of 1.5T and dDLR increased SNR at 1.5T. The dDLR technique improves the image quality of MR images obtained at 1.5T.
Purpose
Magnetic resonance (MR) imaging at 3T is considered to have advantages over imaging at lower field strengths in clinical practice and research. Because signal increases with magnetic field strength B0 [1], signal-to-noise ratio (SNR) is higher in images obtained at 3T than at 1.5T. In most imaging applications, higher SNR equates with higher imaging performance [2]; however, MR at 3T is more expensive than that at 1.5T in terms of equipment and operating costs, and there are specific safety issues for MR imaging at 3T. Deep learning approaches recently applied to the denoising of MR images have demonstrated performance superior to those of previous methods [3]. Among these approaches, the improvements in MR image quality have been reported for deep learning-based reconstruction (dDLR), compared with block-matching and 3D filtering [4], and other deep learning-based denoising techniques [5]. We hypothesized that 1.5T MR with dDLR could provide images of equivalent quality to those obtained at 3T. We performed MR imaging at 1.5T and 3T in the same healthy volunteers, and evaluated the quality of images obtained at 1.5T with dDLR denoising.Materials and Methods
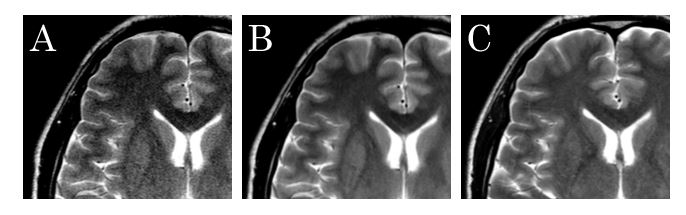
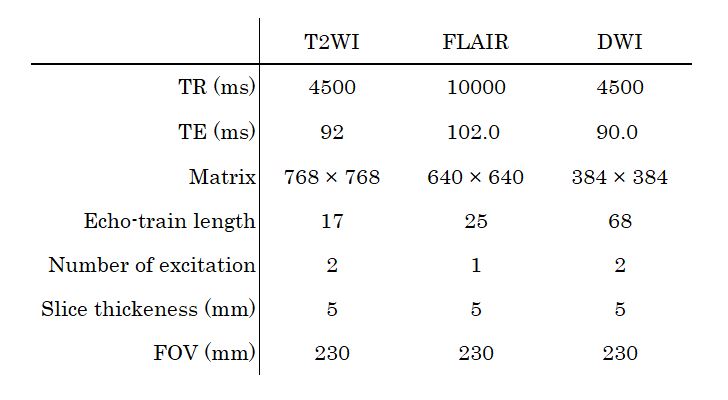
Subjects and MR examinationEleven volunteers (10 males and 1 female) underwent MR imaging at 3T and 1.5T on the same day (3T: Vantage Centurian, Canon Medical Systems Corporation and 1.5T: Vantage Elam 1.5T, Canon Medical Systems Corporation). The interval between scanning at each field strength was ≤30 min, and the same imaging parameters were used for each. The following imaging sequences were obtained: 2D FSE T2WI, FLAIR, and DWI. The details of the imaging parameters are listed in Table 1.
dDLR technique
In the dDLR method used in the present study, the convolution algorithm uses a 7 × 7 discrete cosine transform (DCT) to divide the image data into a zero-frequency component path and feature extraction path. Separation of the zero-frequency component from the feature extraction path enables image contrast to be maintained in sequences. The zero-frequency component path is a separate collateral path, whereas the feature extraction path comprises 22 feature conversion layers. In the feature conversion layers, convolution and a soft-shrinkage activation function are repeatedly applied, and the kernel size of the convolution layers is 3 × 3. Finally, a denoised image is generated in the image generation layer by deconvolution with a 7 x 7 inverse DCT kernel, to which is added the low-pass filtered image from the zero-frequency component path. Pairs of high-SNR ground-truth images and noisy input images were fed to the deep learning process to create a model for denoising MR images. We obtained 150 images from eight head and knee MR examinations acquired in healthy volunteers, using T1WI, T2WI, FLAIR, T2*WI, and proton-density-weighted protocols. Scans were performed with one repetition, and acquired ten times at the same anatomical location. We then obtained high-SNR ground-truth images by in-plane rigid registration followed by averaging of the ten acquired images. After augmenting the training data by horizontal and vertical flipping, a final total of 32,400 training pairs were used in the training. Validation loss was computed during training on six examinations comprising 110 images of the brain and knee.
Assessment of dDLR performance
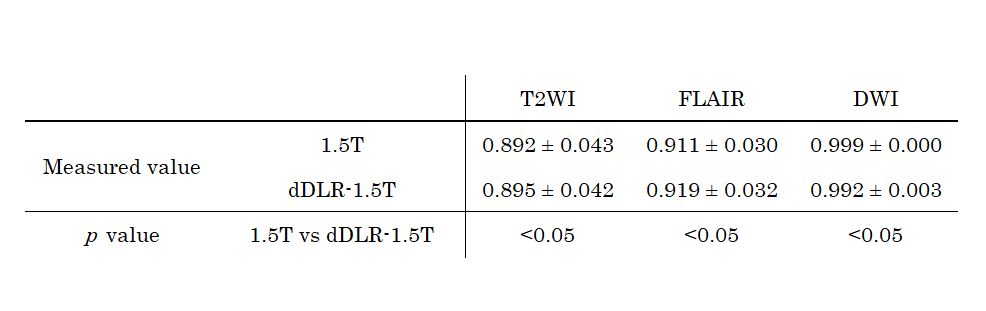
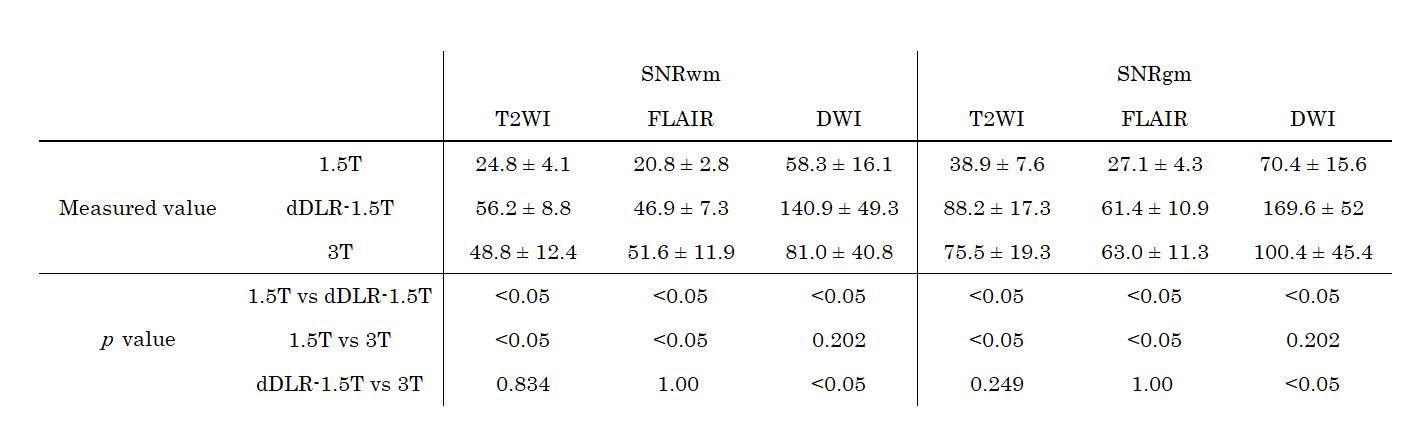
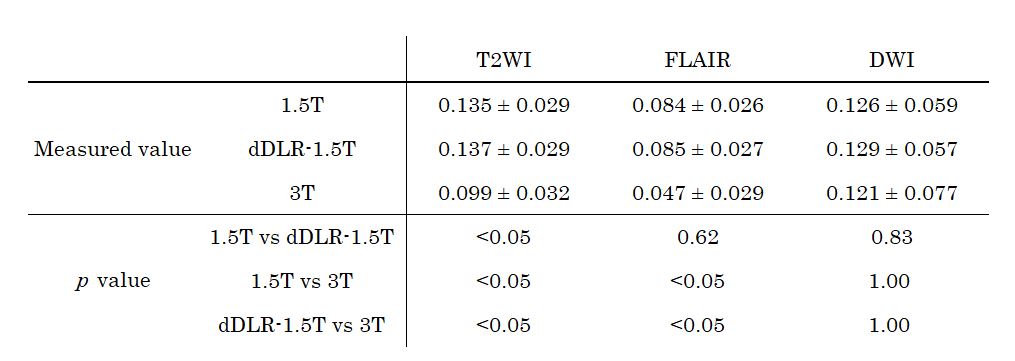
We applied the dDLR method to the 1.5T image data (dDLR-1.5T), and then compared the 1.5T and dDLR-1.5T datasets with reference to the 3T dataset. The similarity of each of the 1.5T and dDLR-1.5T datasets to the 3T dataset was assessed using the structure similarity (SSIM) index. The SNR of gray matter (GM) and white matter (WM; SNRgm and SNRwm, respectively) and the contrast-to-noise ratio (CNR) between gray and white matter (CNRgm-wm) were also assessed. Regions of interest for GM, WM, and background were placed in the right frontal lobe in a slice transecting the bodies of both lateral ventricles. CNR was normalized to the maximum value in each image. The Wilcoxon signed-rank test was used for comparison of the SSIM values. Friedman’s test, followed by the Bonferroni test, was used for multiple comparisons of qualitative values (SNRgm, SNRwm, and CNRgm-wm). All values are expressed as the mean ± SD. Differences were considered statistically significant at P < 0.05.
Results
SSIM indices of dDLR-1.5T were significantly higher than those of 1.5T for T2WI and FLAIR, and lower than that for DWI (Table 2). SNRwm and SNRgm of dDLR-1.5T were significantly higher than those of 1.5T, for all sequences (Table 3). SNRwm and SNRgm of dDLR-1.5T showed no difference from those of 3T for T2WI and FLAIR, but these values were higher than those of 3T for DWI. CNRgm-wm of dDLR-1.5T was significantly higher than that of 1.5T for T2WI, but not for FLAIR or DWI (Table 4). CNRgm-wm of dDLR-1.5T was significantly higher than that of 3T for T2WI and FLAIR.Conclusion
The structure similarity of dDLR-1.5T was higher than that of 1.5T for T2WI and FLAIR. dDLR increased SNR of 1.5T, and there was no difference in SNR between dDLR-1.5T and 3T. The dDLR technique improves the image quality of MR images obtained at 1.5T.Acknowledgements
None.References
1. Edelstein WA, Glover GH, Hardy CJ, et al. The intrinsic signal-to-noise ratio in nmr imaging. Magn Reson Med. 1986;3(4):604-618.
2. Kuhl CK, Textor J, Gieseke J, et al. Acute and subacute ischemic stroke at high-field-strength (3.0-T) diffusion-weighted MR imaging: intraindividual comparative study. Radiology. 2005;234(2):509-516
3. Lundervold AS, Lundervold A. An overview of deep learning in medical imaging focusing on MRI. Zeitschrift für Medizinische Physik.2019;29(2):102-127
4. Kensuke Shinod , Kenzo Isogaw , Masahito Nambu , et al. Deep Learning Based Adaptive Noise Reduction in Multi-Contrast MR Images. Intl. Soc. Mag. Reson. Med. 27 (2019)
5. Kidoh M, Shinoda K, Kitajima M, et al. Deep Learning Based Noise Reduction for Brain MR Imaging: Tests on Phantoms and Healthy Volunteers.Magn Reson Med Sci. 2019 Sep 4. doi: 10.2463/mrms.mp.2019-0018. [Epub ahead of print]
Figures