3609
Deep Learning to Produce Realistic MR Images through Fréchet Inception Distance Monitoring1Department of Bio and Brain Engineering, Korea Advanced Institute of Science and Technology, Daejeon, Korea, Republic of, 2Department of Radiology, Seoul National University College of Medicine, Seoul, Korea, Republic of
Synopsis
It is known that optimizing a deep learning model based on best validation loss achieves best quantitative results in image reconstruction, but resulting images are often blurry. In this study we propose an alternative way of optimization in which convolutional neural network (CNN) is trained beyond best validation loss to produce realistic MR images by monitoring Fréchet Inception Distance. The new approach generated sharper and more realistic images than the conventional optimization, providing a new insight into optimization for MR image reconstruction.
INTRODUCTION
The development of deep learning has shown a great impact on the medical imaging fields, such as classification, segmentation, and reconstruction. Particularly, the use of convolutional neural network (CNN) has enabled active research in imaging acceleration and image quality enhancement. A trained model is typically chosen by monitoring its performance in terms of its loss function, such as L1 or L2 loss, on the validation sets during training process. This is to: 1) choose a model that would perform generally well on new data and 2) avoid overfitting. The chosen model successfully minimizes error during test phase, but details in the output images are often blurred. It is critical in the medical image field for the images to be as detailed and realistic as possible for potential clinical usage, requiring a process other than just simple loss optimization. We therefore propose a way to produce sharper and more realistic images through training beyond loss function optimization, which we term “over-iteration”, to select the model by monitoring the Fréchet Inception Distance (FID)1.METHODS
Spin-echo T1-weighted images and fast spin-echo T2-weighted images of 21 normal subjects were acquired on a SIEMENS Trio 3.0T scanner (Siemens Medical Solutions, Erlangen, Germany). Imaging parameters were: TR/TE=500/9.8ms for T1, 3700ms/103ms for T2, FOV=220×165mm2, matrix=320×240 and number of slices=12-15. 13 sets were used for training, 2 for validating, and 6 for testing.Deep learning models were developed to enhance the quality of undersampled data. Fully sampled T1-weighted image sets and undersampled T2-weighted images (R=4) were used to train the network to produce fully sampled T2-weighted images2. T2-weighted images were undersampled by a factor of 4 through uniform undersampling with densely sampled center lines, the number of which was designated to be 70% of total undersampled lines.
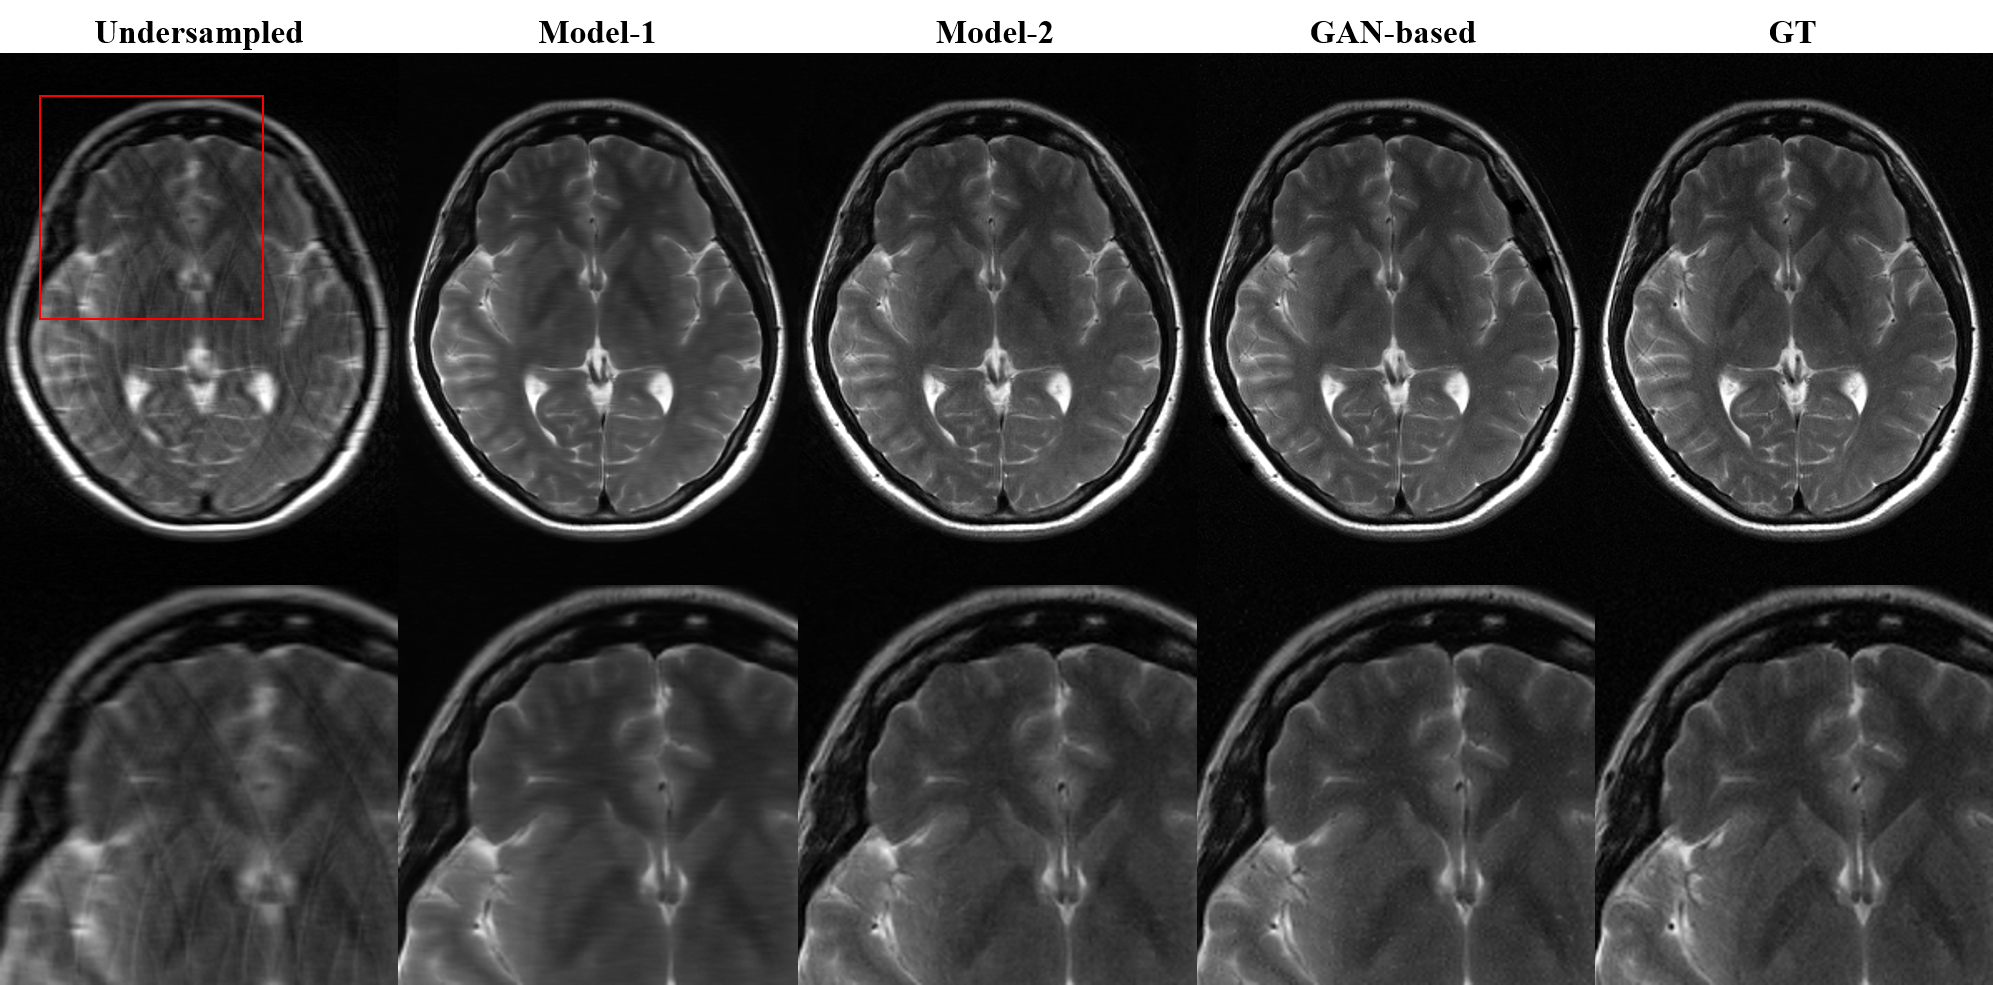
Performance was evaluated and compared between two models: Model-1: single generative model with best validation L1 loss, Model-2: proposed single generative model over-iterated for best validation FID loss. The images of our proposed model were also evaluated by referring to the previous work of generative adversarial network (GAN) based model2, which showed an effective way to produce realistic medical images using adversarial networks, in order to check our model’s tendency towards producing realistic images.
The performance of the models was assessed using the normalized mean squared error (NMSE) and structure similarity (SSIM) indices. FID score was used to quantify how realistic the output images were compared to the ground truth images1. FID index was developed and widely used to compare GAN performance3 in terms of realistic resemblance to ground truth images, and it is known to correlate with human judgment4. Lower score means more resemblance towards the ground truth.
U-net with residual learning scheme5 was used, in which the generative model was designed to learn the difference between input and label images. The adversarial network structure for reference GAN model was adapted from previous work6: four convolutional blocks that consist of 3 3 kernel (stride 2), rectified linear unit (ReLU) activation, and batch normalization (except for first block). Adam optimizer with lr=0.0002 and momentum=0.5 was used to optimize L1-loss function of the models. For reference GAN model, Adam optimizer with lr=0.0001 and momentum=0.5 was used for adversarial network. The loss weights for GAN model was =10 for L1-loss and =1 for adversarial loss (L2-loss). =0 was used for Model-1 and 2. All of the models were trained for 3000 epochs. No additional loss function was used to optimize the models.
RESULTS
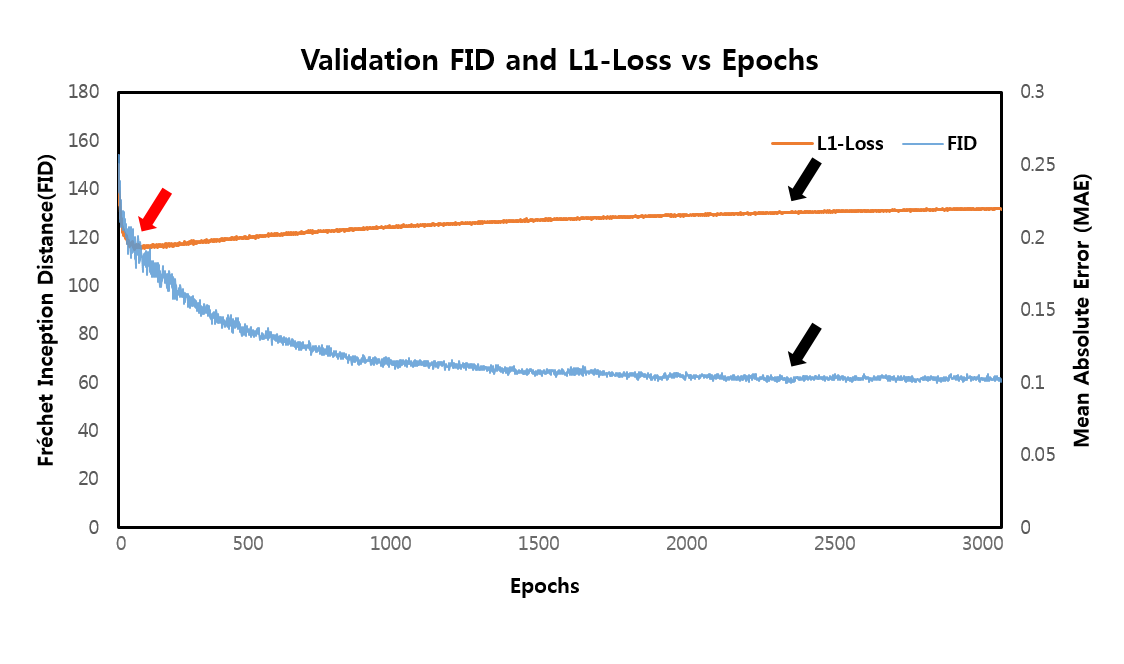
The learning curves shown in Figure 1 illustrates the training process of the models. As indicated by red arrows, the validation loss for single generative model reached its minimum (Model-1) at the very early stage of training epochs (Fig 1A). The increase in validation loss while train loss decreases is typically considered as overfitting, and it is conventional to stop the training at this point. However, FID was still decreasing at this point, indicated by black arrows, and converged at later stage (Model-2) of the training (Fig 1B). The converged FID score was comparable to that of reference GAN-based model FID score (Table 1).Figure 2 shows the visual results of the output T2-images from different models. The single generative model of Model-2 was able to successfully show sharper and more realistic images than Model-1, and showed comparable results to reference GAN model. NMSE and SSIM are better for Model-1(Table 1), which is a well‑known phenomenon2, but the FID score of Model-2 was clearly better than that of Model‑1 and comparable to that of reference, when the model was over-iterated.
DISCUSSION and CONCLUSION
Through FID monitoring, we could quantitatively observe the pattern during training after minimum validation loss has been reached. This over‑iteration process in the model optimization produced sharper and detailed information for the training sets, benefitting the test results in terms of realistic resemblance. While this concept might be discarded as overfitting in a number of research fields, the application of the over-iteration process in medical images using a typical single generative model has shown its potential in producing realistic images, the simplicity of which can be easily adapted for further investigation.Acknowledgements
No acknowledgement found.References
1. Heusel M, Ramsauer H, Unterthiner T, Nessler B, Hochreiter S. Gans trained by a two time-scale update rule converge to a local nash equilibrium. 2017. p 6626-6637.
2. Kim KH, Do WJ, Park SH. Improving resolution of MR images with an adversarial network incorporating images with different contrast. Med Phys 2018;45(7):3120-3131.
3. Lucic M, Kurach K, Michalski M, Gelly S, Bousquet O. Are GANs created equal. A Large-Scale Study ArXiv e-prints 2017;2(4).
4. Barratt S, Sharma R. A note on the inception score. arXiv preprint arXiv:180101973 2018.
5. Lee D, Yoo J, Tak S, Ye JC. Deep Residual Learning for Accelerated MRI Using Magnitude and Phase Networks. IEEE Trans Biomed Eng 2018;65(9):1985-1995.
6. Isola P, Zhu J, Zhou T, Efros AA. Image-to-Image Translation with Conditional Adversarial Networks. 2017 21-26 July 2017. p 5967-5976.
Figures