3589
Single-shot T2 mapping improvement through Multi-train Multiple Overlapping-Echo Detachment planar imaging sequence1Center for Brain Imaging Science and Technology, Department of Biomedical Engineering, Key Laboratory for Biomedical Engineering of Ministry of Education, Zhejiang University, Hangzhou, China, 2Department of Electronic Science, Fujian Provincial Key Laboratory of Plasma and Magnetic Resonance, Xiamen University, Xiamen, China, 3MR Collaboration, Siemens Healthcare Ltd., Shanghai, China, 4Department of Imaging Sciences, University of Rochester, Rochester, NY, United States
Synopsis
Magnetic Resonance parametric mapping can provide quantitative information to characterize tissue properties. Recently, a single-shot T2 mapping method based on Multiple Overlapping-Echo Detachment (MOLED) planar imaging was proposed. However, limited echo time ranges still affected the reconstruction accuracy of the T2 values, especially when large T2 value ranges were present. In this abstract, MOLED was expanded through multiple-echo-train acquisitions that achieved high accuracy and better texture. The deep convolution neural network was used to reconstruct T2 maps, B1 maps and spin densities in synchrony. The sequence efficiencies were demonstrated in digital-brain, phantom and human-brain experiments.
Introduction
Magnetic Resonance parametric mapping can provide quantitative information to characterize tissue properties.1,2 However, slow data acquisition speeds usually hinder real-time magnetic resonance (MR) parameter mapping. In this work, a novel single-shot T2 mapping method, which can be acquired in hundreds of milliseconds, was proposed based on multiple overlapping-echo detachment (MOLED) with a planar imaging acquisition scheme, termed the multi-train MOLED (MMOLED) method. Multiple overlapping echo signals from different echo trains with the different T2-weighting were obtained simultaneously.3 A convolution neural network (CNN) was proposed to reconstruct T2 mapping. The robustness and efficiency of the MMOLED sequence were demonstrated using numerical brains, phantom experiments and human brains.Methods
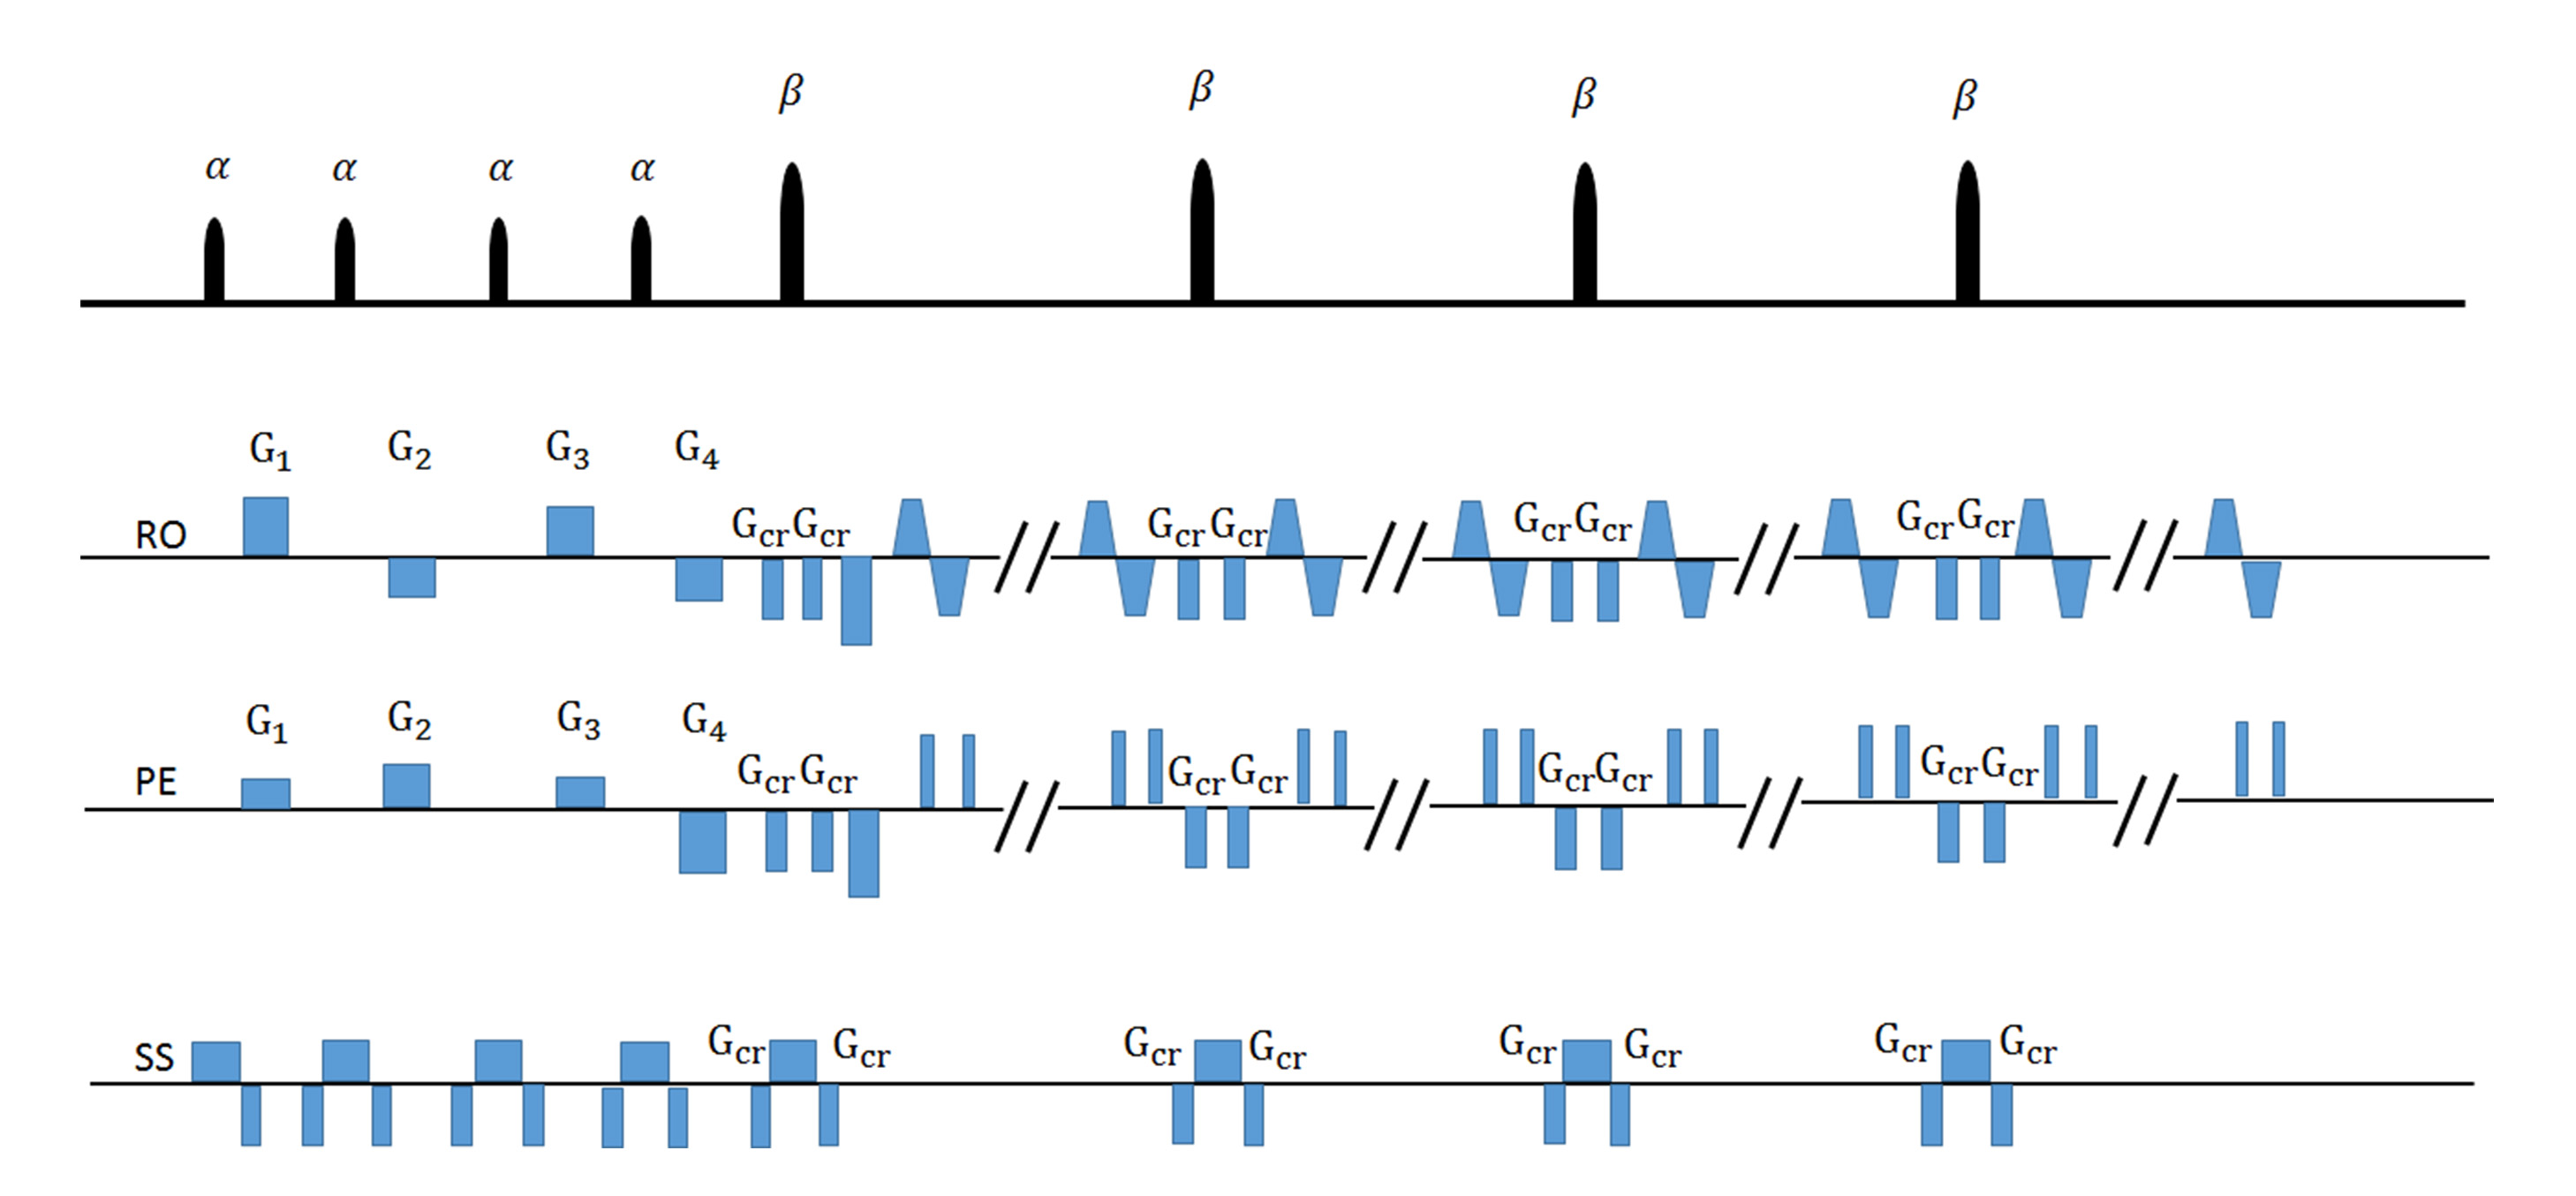
The novel single-shot MMOLED T2 mapping sequence designed is shown in Fig.1. The current strategy uses sequences that have three echo trains, and for each echo train, four echo signals with different evolution time are generated in turn by four excitation pulses that hold a same small flip angle of α. Four echo-shifting gradients (G1,G2,G3,G4) were used to shift the echoes from the k-space center along the phase-encoding and frequency-encoding directions.To compare the reconstruction results of different echo train numbers during post-processing, we used first echo train (dubbed MMOLED-1 train), the first two echo trains (dubbed MMOLED-2 trains) and the first three echo trains (dubbed MMOLED-3 trains) as the input of the convolution neural network (CNN). The pure synthetic training samples were utilized, the detail can be seen in the previous paper.4-7 The phantom and human brain validation experiments were performed on a whole-body 3T scanner ( MAGNETOM Prisma, Siemens Healthcare, Erlangen, Germany). For the single-shot MMOLED-1, MMOLED-2, and MMOLED-3 trains sequence, the scan time was 118 ms, 185 ms and 252 ms respectively with acquisition matrix 128×128 and FOV 22×22 cm2. The conventional SE sequence was used for comparison.
Results and Discussion
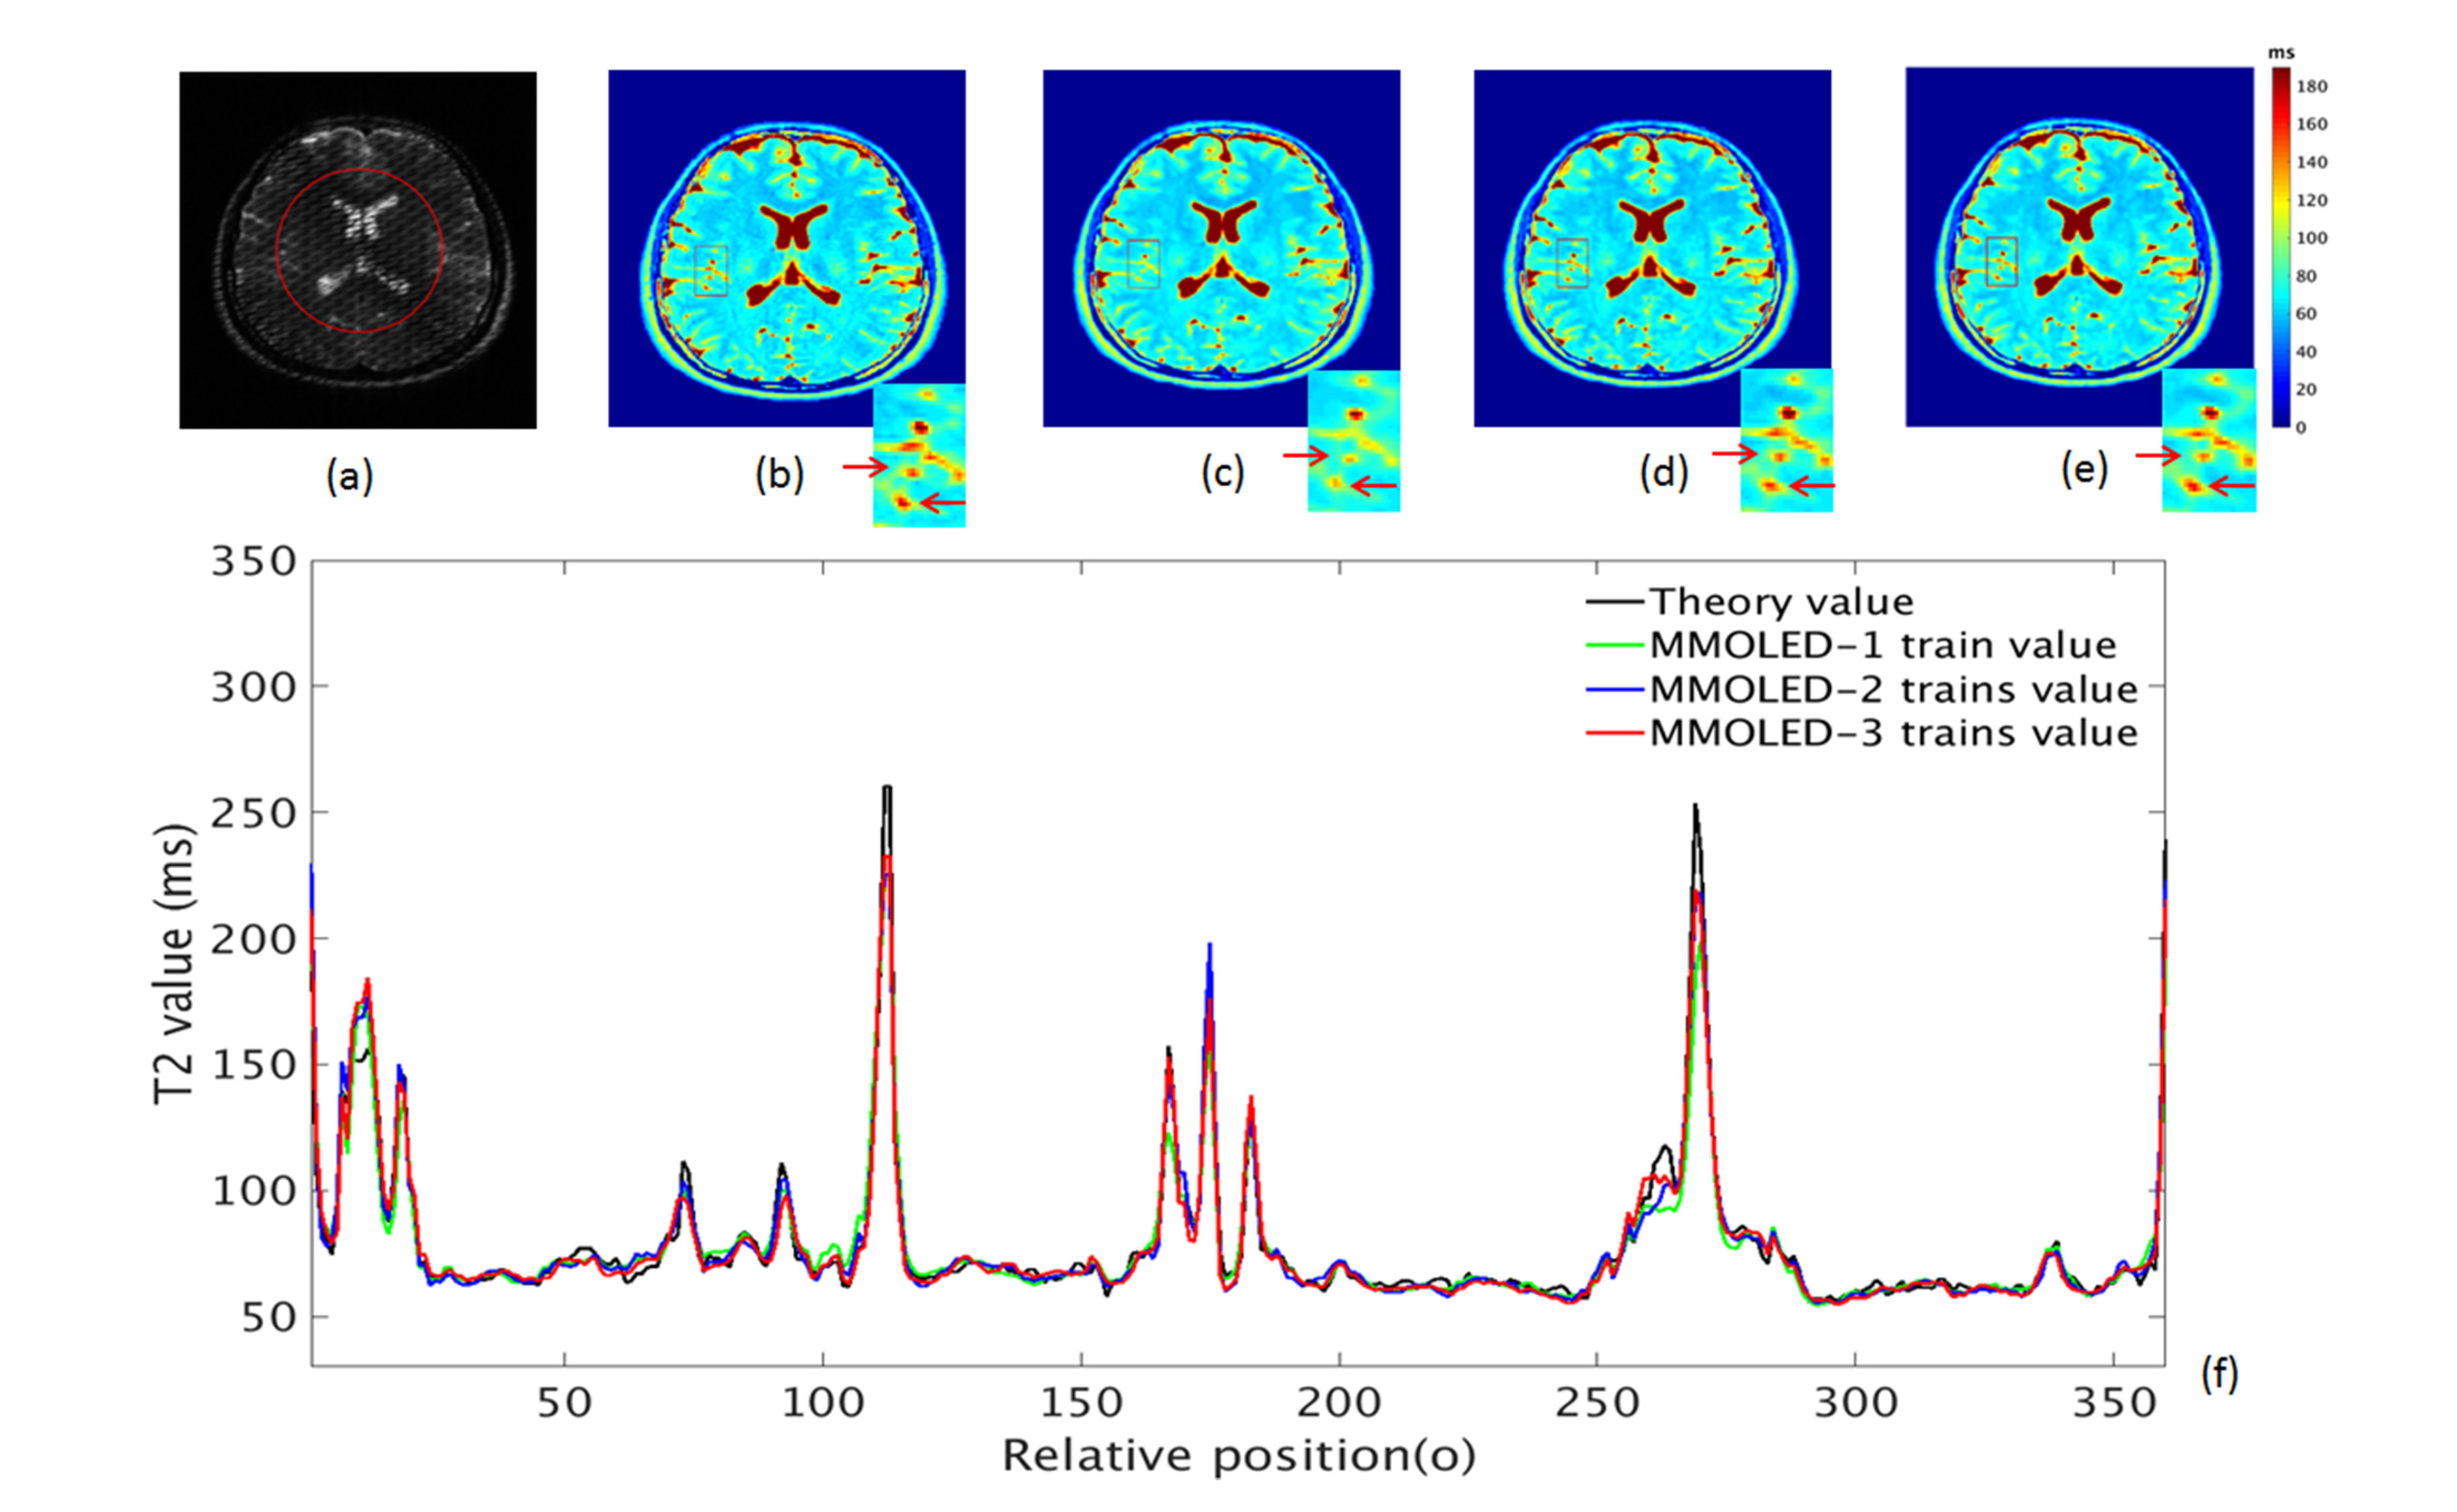
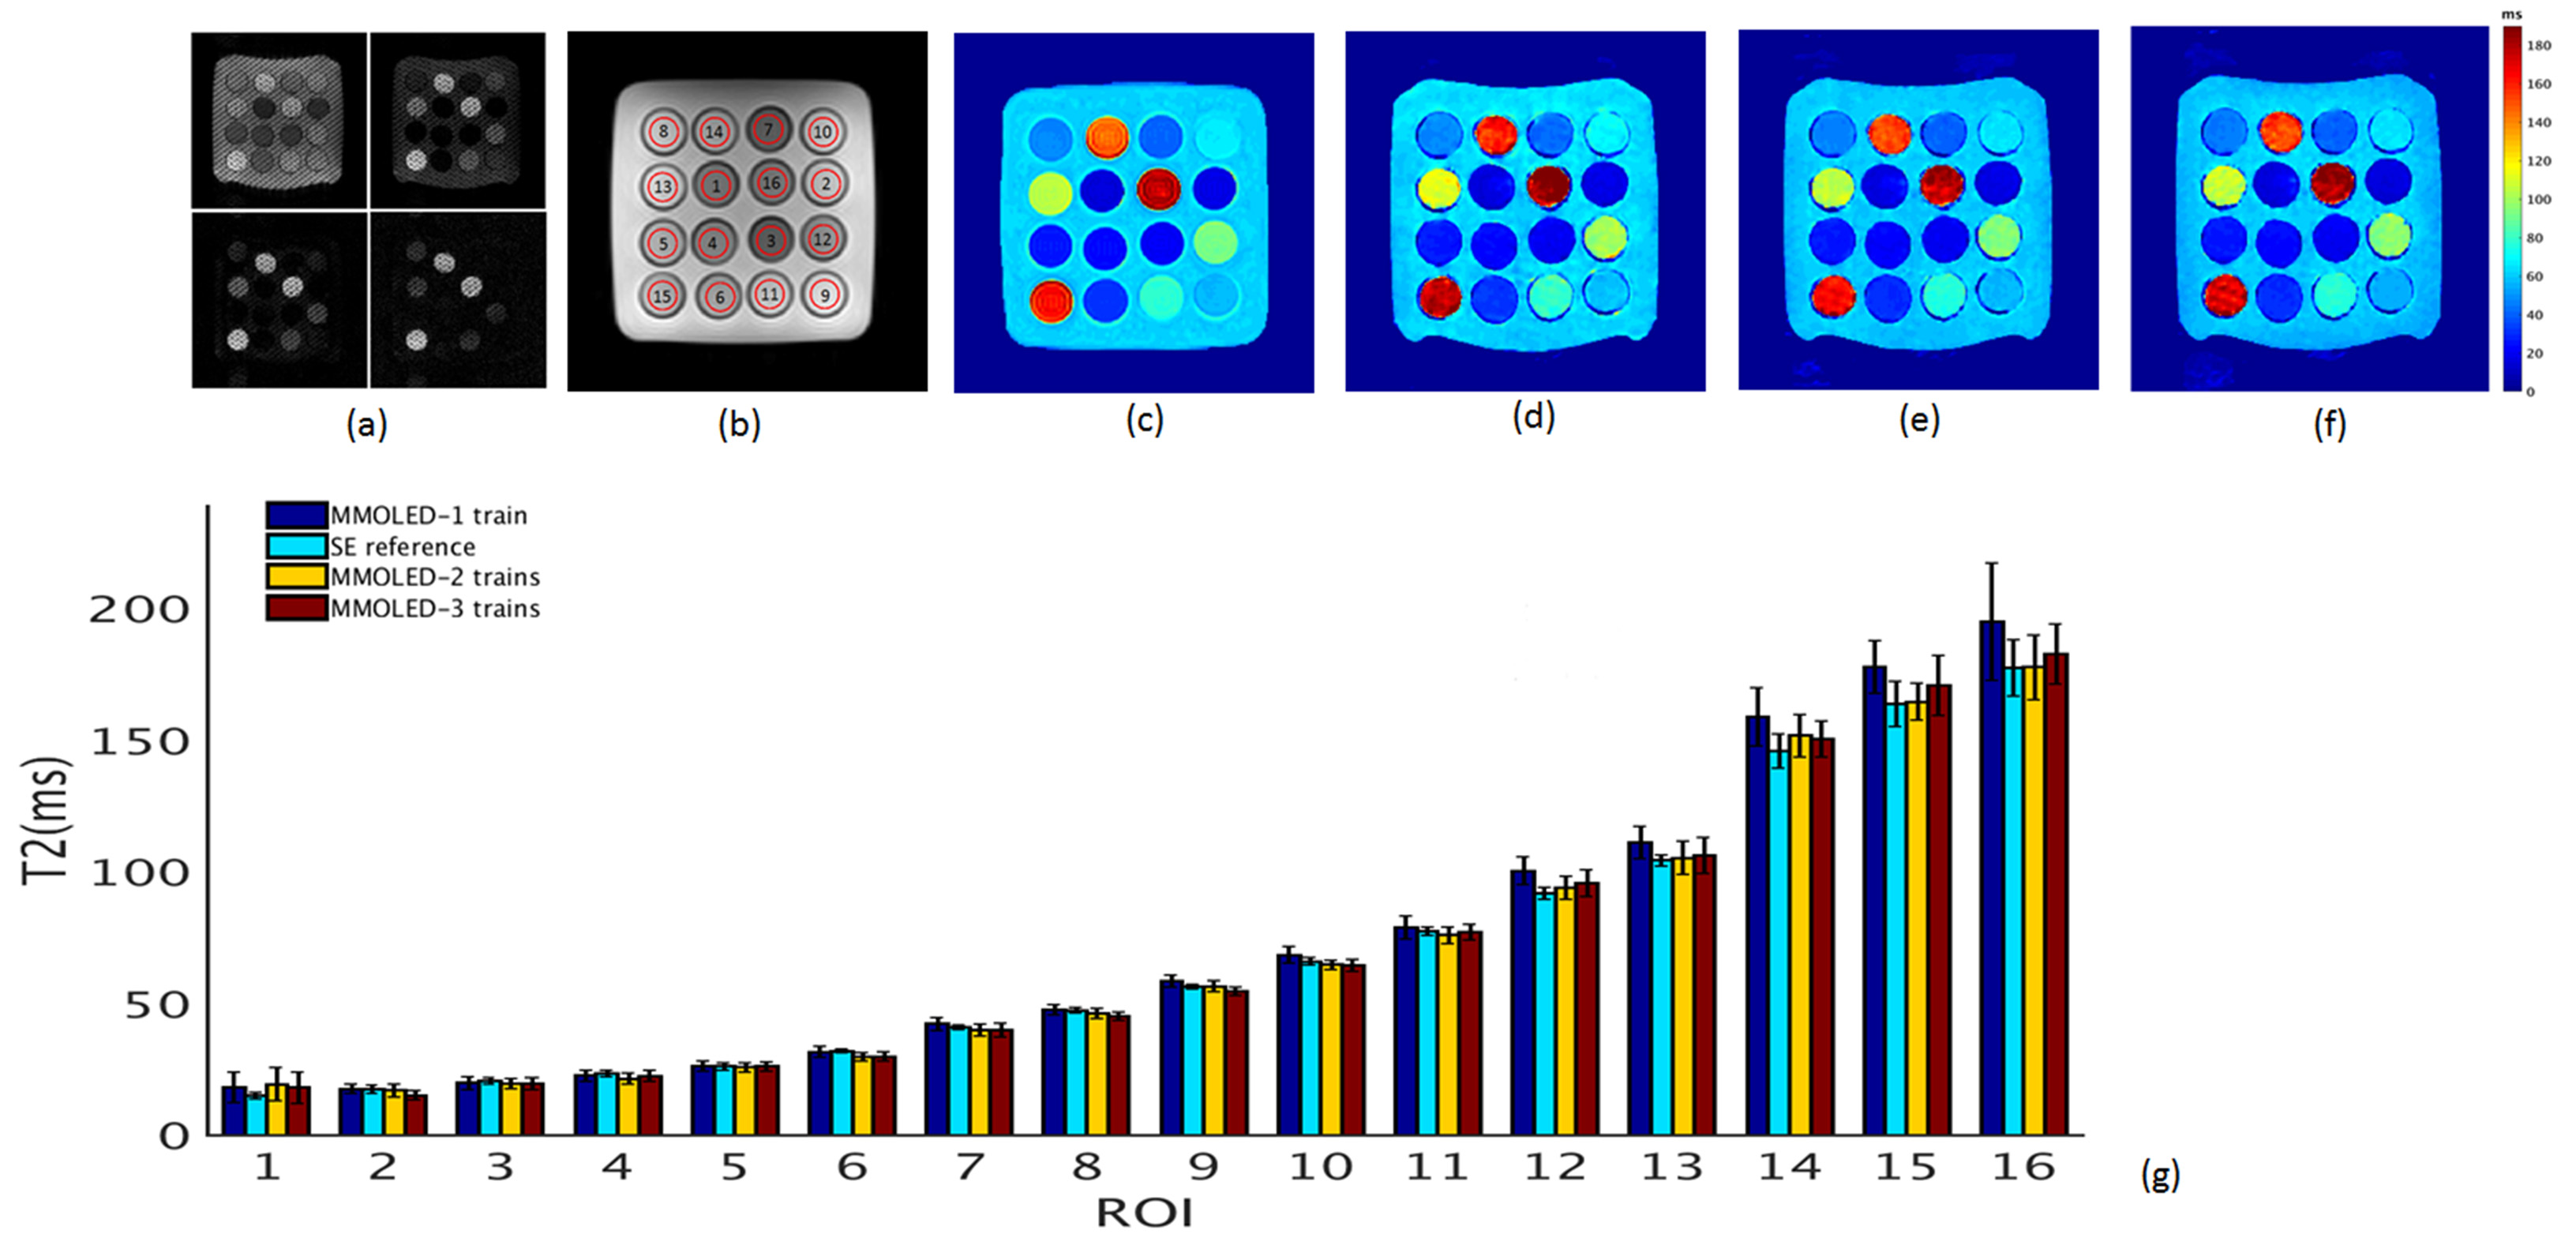
A numerical Brain pattern (including T2 , B1 and proton density templates) was constructed. The numerical simulation results are shown in Fig.2. The images before reconstruction (Fig. 2(a)) had visible cross stripes, since they were composed of multiple images with different linear phase ramps. A reference T2 map (Fig. 2(b)) was used as a templet for the simulation. We enlarge a region in numerical brain for comparison. The reconstruction results of the three input types mentioned are also shown in Fig. 2(c-e). The T2 mapping textures from the MMOLED-2 (Fig. 2(d)) and MMOLED-3 train3 (Fig. 2(e)) were most consistent with the T2 mapping reference, especially in regions with relatively large T2 values, as indicated by the red arrows. The red circle shown in Fig. 2(a) denotes a trace for the comparison of the T2 values from MMOLED-1, MMOLED-2, MMOLED-3 trains and reference T2 mapping. The T2 profiles along the red trace from the different T2 mapping schemes were drawn in Fig. 2(f), which showed that in the cerebrospinal fluid (CSF) regions where high T2 values usually exist, the results from multi-train OLED including MMOLED-2 trains and MMOLED-3 trains had better agreement with the reference than MMOLED-1 train. The Structural Similarity Index (SSIM) for the entire image results of MMOLED-1, MMOLED-2, and MMOLED-3 trains were 0.775, 0.991 and 0.988, respectively.For the phantom validation, the mean T2 values ranged from 15 ms to 180 ms (Fig. 3). We found that T2 mapping reconstructed from MMOLED-2 and MMOLED-3 trains performed better when T2 value was a relatively large value (>75ms). Moreover, the maximum compartment 16 deviation for MMOLED-1 train was about 11.1 ms, while that of the MMOLED-2 and MMOLED-3 trains was about 6.2 ms and 5.7 ms, respectively.
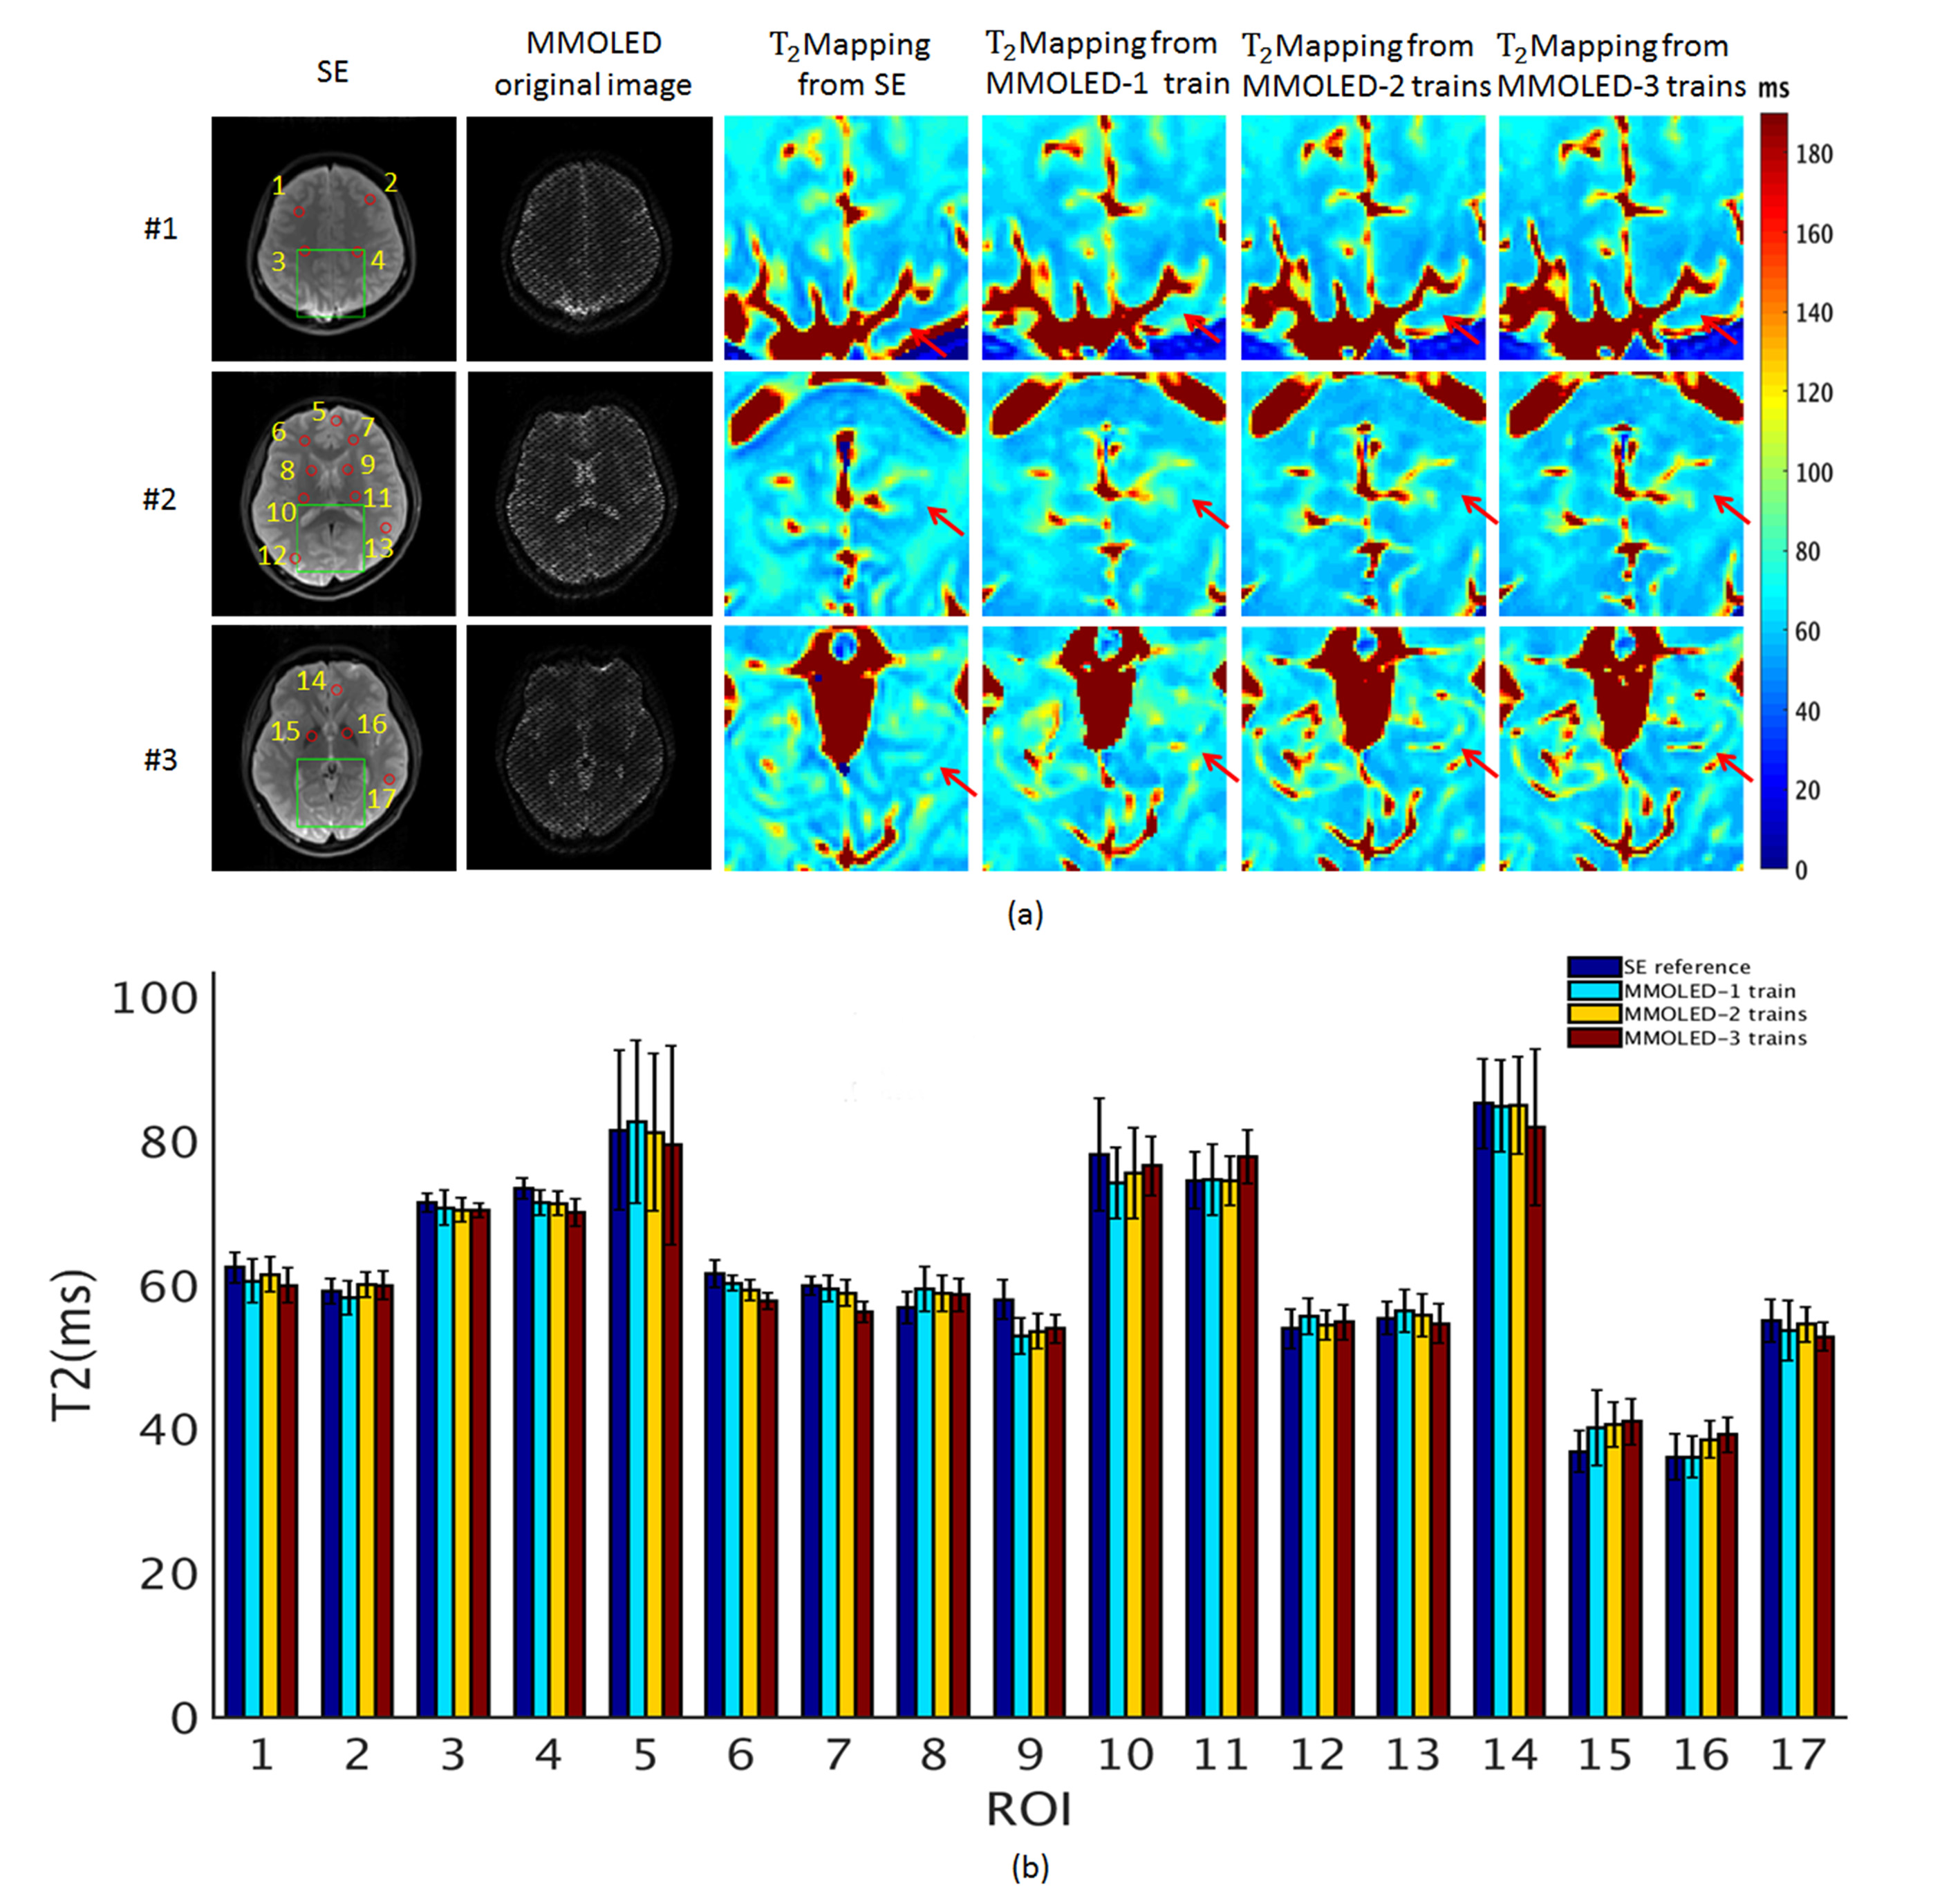
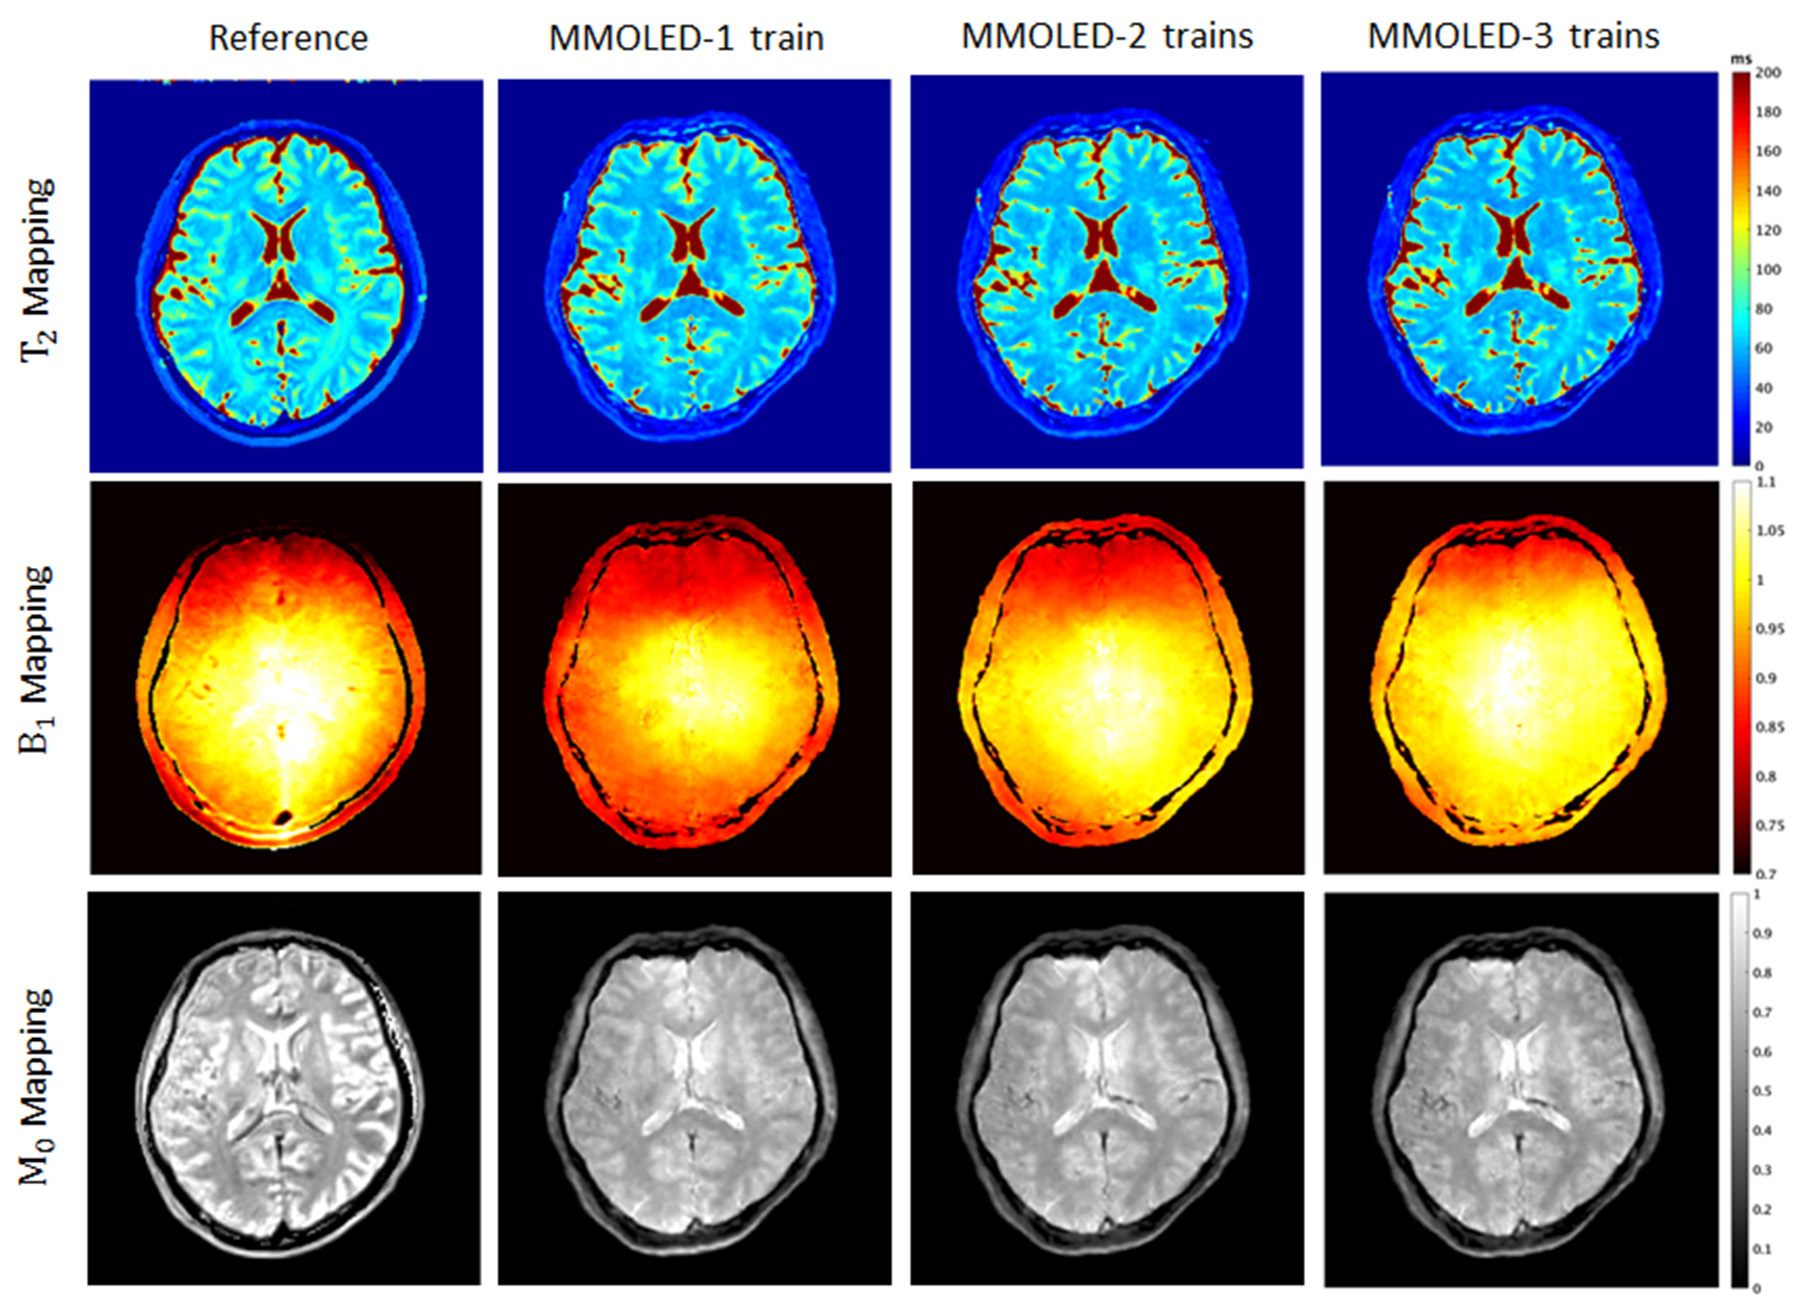
In Fig.4, the mean T2 values and standard deviations (SDs) for 17 regions of interest (ROIs) marked in Fig. 4(a) were calculated and the results were given in Fig. 4(b). The 17 ROIs were chosen manually to represent different regions of the brain, including white matter, gray matter, and deep gray matter with different T2 values. All of the reconstructed T2 mapping results were compared with the T2-mapping reference obtained from SE sequence using the FNIRT tool (FMRIB’s Nonlinear Image Registration Tool) of FSL (Oxford, UK). Most results agreed well with SE result, but in ROI10 where T2 value was relatively large (>75ms), the reconstructed results from MMOLED-2 and MMOLED-3 trains performed better than those of the MMOLED-1 train. We found that the reconstructed T2 mappings from MMOLED-2 and MMOLED-3 trains (Fig. 4(a)) were closer in texture details to the T2 reference compared with the mapping from MMOLED-1 train. The B1 and M0 maps could also be reconstructed through the convolution neural network output from three different methods as shown in Fig. 5.8 As one can see, The reconstructed B1 mapping from MMOLED-2 and MMOLED-3 trains was also enhanced than from the MMOLED-1 train.
Conclusion
The MMOLED-2 and MMOLED-3 trains provided better single-shot T2 mapping and B1 mapping than did the MMOLED-1 train, and all could be acquired within milliseconds while maintained high image quality, which is useful for dynamic imaging. The successful application of deep learning method and synthetic training dataset proved their great potential in making complex MRI sequences available.Acknowledgements
No acknowledgement found.References
1. Ma D, Gulani V, Seiberlich N, et al. Magnetic resonance fingerprinting. Nature.2013;495:187-192.
2. Zhao B, Lam F, Liang Z. Model-based MR parameter mapping with sparsity constraints:parameter estimation and performance bounds. IEEE Trans Med Imaging. 2014;33:1832-1844.
3. M.-L. Chu, H.-C. Chang, K. Oshio, and N.-K. Chen. A single-shot T2 mapping protocol based on echo-split gradient-spin-echo acquisition and parametric multiplexed sensitivity encoding based on projection onto convex sets reconstruction. Magnetic Resonance in Medicine. 2018;79(1):383-393.
4. Ma L, Cai C, Yang H, et al. Motion-tolerant diffusion mapping based on single-shot overlapping-echo detachment (OLED) Planar Imaging. Magnetic Resonance in Medicine. 2018;80:200-210.
5. Cai C, Zeng Y, Zhuang Y, et al. Single-shot T2 mapping through overlapping-echo detachment (OLED) planar imaging. IEEE Transactions on Biomedical Engineering. 2017;64(10):2450-2461.
6. Cai C, Wang C, Zeng Y, et al. Single-shot T2 mapping using overlapping-echo detachment planar imaging and a deep convolutional neural network. Magnetic Resonance in Medicine. 2018;80(5):2202-2214.
7. Zhang Jun, Wu Jian, Chen Shaojian, et al. Robust Single-Shot T2 Mapping via Multiple Overlapping-Echo Acquisition and Deep Neural Network. IEEE Transactions on Medical Imaging, 2019;38(8):1801-1811.
8. Cunningham, C.H., J.M. Pauly and K.S. Nayak, Saturated double-angle method for rapid B1+ mapping. Magnetic Resonance in Medicine. 2006;55(6):1326-1333.
Figures