3584
Quantification of Inter-Muscular Adipose Infiltration in Calf/Thigh MRI using Fully and Weakly Supervised Semantic Segmentation
Rula Amer1, Jannette Nassar1, David Bendahan2, Hayit Greenspan1, and Noam Ben-Eliezer1,3,4
1Department of Biomedical Engineering, Tel Aviv University, Tel Aviv, Israel, 2CNRS, CRMBM, Aix Marseille University, Marseille, France, 3Center for Advanced Imaging Innovation and Research, New York University, New York, NY, United States, NY, United States, 4Sagol School of Neuroscience, Tel Aviv University, Ramat-Aviv, Israel
1Department of Biomedical Engineering, Tel Aviv University, Tel Aviv, Israel, 2CNRS, CRMBM, Aix Marseille University, Marseille, France, 3Center for Advanced Imaging Innovation and Research, New York University, New York, NY, United States, NY, United States, 4Sagol School of Neuroscience, Tel Aviv University, Ramat-Aviv, Israel
Synopsis
Quantification of subcutaneous fat infiltration in diseased muscle regions holds great prognostic value as it helps monitor the progression of muscular dystrophies. To estimate the infiltration, two stages are performed. The first isolates the region of muscle from the thigh/calf anatomy using U-net architecture for fully supervised segmentation. The second stage classifies muscle into diseased/healthy pixels using a weakly supervised segmentation method, incorporating a deep convolutional auto-encoder with triplet loss, and creates two clusters in the embedded feature space using k-means. The results showed a high Dice coefficient and a strong correlation between the fat infiltration and disease severity level.
Introduction
Infiltration of subcutaneous adipose tissue (SAT) and a corresponding loss in muscle mass is a clinical manifestation of muscular dystrophies. Quantification of fat infiltration based on MRI techniques is proven to have a strong correlation with the disease progression and is, therefore, an accurate marker of disease state and severity1. In order to provide physicians with a precise biomarker, a prerequisite of reliable segmentation of muscle tissue, subcutaneous fat, and inter-muscular fat is needed. Challenges including inconsistent pixel intensities, MRI inhomogeneities, obscure and blurry boundaries between pixels of different tissue types in diseased cases, make the task of tissue segmentation difficult. Therefore, more complicated techniques that account for these limitations are required. In this work, we calculate an index that is the ratio between the area of inter-muscular adipose tissue (IMAT) and that of the whole muscle region. We perform this task with two stages. The first stage excludes the subcutaneous adipose tissue, bone and bone marrow pixels, leaving us with the muscle-region. The next stage classifies muscle pixels into healthy muscle and IMAT pixels.Methods
Data: 17 axial MR scans of patients’ thigh/calf suffering from Dysferlinopathy were scanned on a whole-body Siemens Prisma 3T scanner. A multi spin-echo sequence was used with TR=1479 [ms], TE=8.7 [ms], Nechoes=17, spatial resolution=1.5x1.5 mm2 with a matrix size of 128x128. The regions were imaged acquiring 5 slices with a slice thickness of 10 mm, and acquisition time =5.07 [min]. To construct the maps, Bloch simulations were used to estimate the actual echo modulation curve (EMC)2. An extension of the EMC algorithm was introduced3 for two-component fitting, simultaneously estimating fat and water fractions within a single voxel, along with the T2 of each component. This was used to generate IMAT and healthy muscle ground truth (GT). IMAT/healthy labels were assigned based on the fat fraction within each pixel.Muscle region segmentation: In the first stage, we employed a popular fully convolutional network (FCN)-based deep learning architecture, U-net 4, for the segmentation of muscle region. The SAT, bone and bone marrow are excluded with this method. The network architecture is illustrated in Fig. 1. The Dice loss was optimized during training.
IMAT and Healthy muscle classification: Following segmentation, pixel classification is performed to differentiate between diseased muscle pixels from healthy ones. Pixels with fat infiltration are usually distributed over the whole region of the muscle. Moreover, the infiltration level varies across pixels. Consequently, the border between healthy muscle and IMAT pixels becomes blurry and manual pixel-wise labeling becomes difficult and inaccurate. Hence, a weakly-supervised method accounts for this limitation. We implemented a patch-based deep convolutional auto-encoder with a triple loss5 constraint to learn a semantic feature representation and apply k-means in the embedded space to classify the pixels into two clusters. Triplet loss constraint imposes similarity across the patches of the same tissue and non-similarity between patches of different tissues. The architecture is described in Fig. 2. The loss that was optimized consists of two parts: 1. Reconstruction loss - the mean squared error (MSE), and 2. Triplet loss on triplet patches that were randomly selected from the training set. Both stages were trained with Adam optimizer (default settings)6 for 100 epochs.
Results
The test set includes three patients with mild, moderate and severe fat infiltration. We evaluated the approach performance in terms of Dice Similarity Coefficient (DSC) of the predicted delineation to the GT annotation. We achieved a Dice of 0.96, 0.91 and 0.93 for muscle-region segmentation, healthy muscle segmentation, and IMAT, respectively. The clustering performance was evaluated with the normalized mutual information (NMI), the accuracy of clustering (ACC), and adjusted Rand index (ARI) and achieved 0.63, 0.93 and 0.75 for each, respectively. Fig. 3 shows sample results of segmentation. Fig. 4 shows the fraction of infiltrated fat from whole muscle region (healthy muscle + IMAT), indicative of the severity level of the disease.Discussions and Conclusions
In this work we presented a method for quantifying the ratio of diseased muscle to whole muscle region, indicative of the stage of neurodegenerative diseases. We demonstrated the robustness of our method to segment and classify muscle tissue in the presence of MRI artifacts. Excellent performance was demonstrated on moderate and severe cases of fat infiltration, where other conventional methods fail. Fig. 4 shows strong correlation between our calculated index and the severity of the disease based on the GT.Acknowledgements
No acknowledgement found.References
1. Wren, Tishya AL, et al. "Three-point technique of fat quantification of muscle tissue as a marker of disease progression in Duchenne muscular dystrophy: preliminary study." American Journal of Roentgenology 190.1 (2008): W8-W12.2. Ben‐Eliezer, Noam, Daniel K. Sodickson, and Kai Tobias Block. "Rapid and accurate T2 mapping from multi–spin‐echo data using Bloch‐simulation‐based reconstruction." Magnetic resonance in medicine 73.2 (2015): 809-817.
3. Nassar, J., Le Fur, Y., Radunsky, D., Blumenfeld-Katzir, T., Bendahan, D. and Ben-Eliezer, N. (2019). Sub-voxel estimation of fat infiltration in de-generative muscle disorders using multi-T2 analysis - a quantitative disease biomarker. Montreal: 27th Proc Intl Soc Mag Reson Med, p.4011.
4. Ronneberger, Olaf, Philipp Fischer, and Thomas Brox. "U-net: Convolutional networks for biomedical image segmentation." International Conference on Medical image computing and computer-assisted intervention. Springer, Cham, 2015.
5. Chechik, Gal, et al. "Large scale online learning of image similarity through ranking." Journal of Machine Learning Research 11. Mar (2010): 1109-1135. 6. Kingma, Diederik P., and Jimmy Ba. "Adam: A method for stochastic optimization." arXiv preprint arXiv:1412.6980
Figures
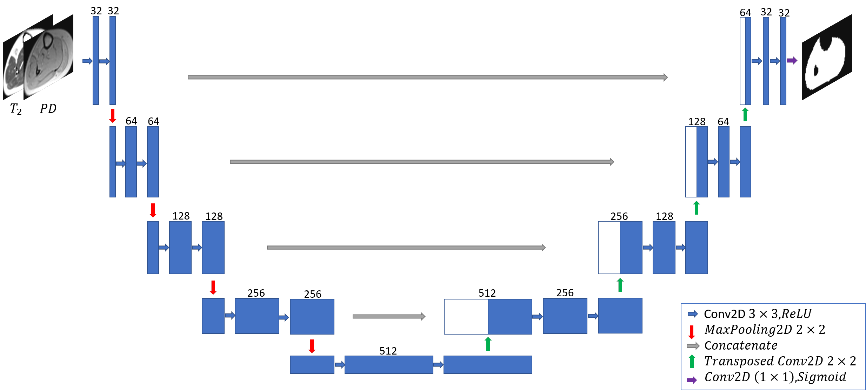
Figure 1. The
architecture of the U-net used for muscle-region segmentation.
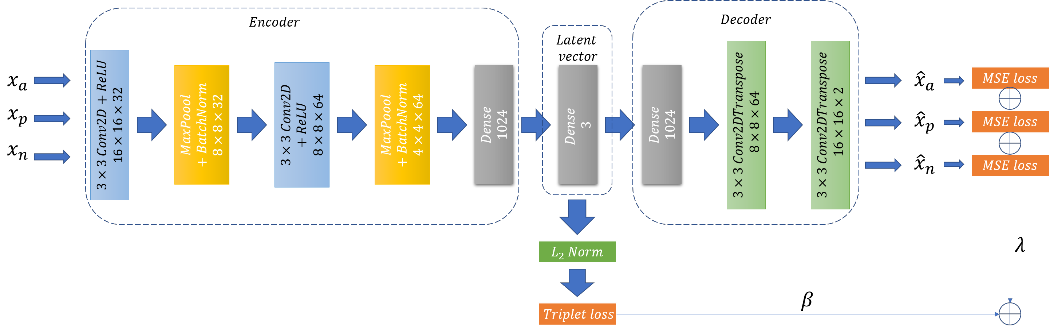
Figure 2. The architecture of the deep convolutional
auto-encoder and the losses used for muscle tissue classification.
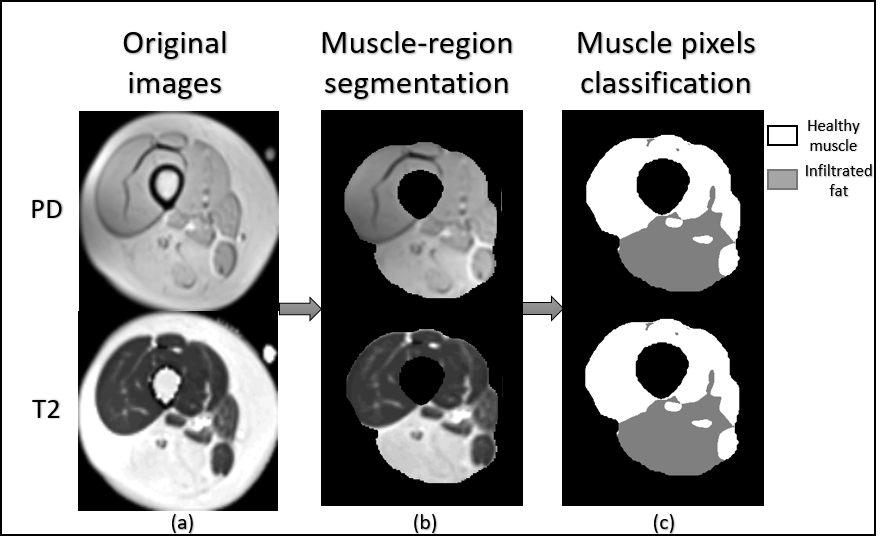
Figure 3. Example of segmentation: (a) original and maps of a patient with a moderate condition of
Dysferlinopathy, (b) output of the first stage (muscle-region segmentation),
and (c) output of the second stage (muscle pixels classification).
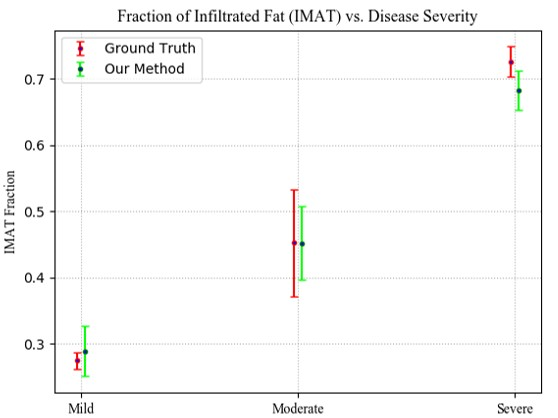
Figure 4. Infiltrated fat (IMAT) as a fraction of the whole muscle in mild, moderate and severe cases, compared to the GT.