3578
Magnetic Resonance Elastography Analysis using Convolutional Neural Networks
Bogdan Dzyubak1, Joel P Felmlee1, and Richard L. Ehman1
1Radiology, Mayo Clinic, Rochester, MN, United States
1Radiology, Mayo Clinic, Rochester, MN, United States
Synopsis
Magnetic Resonance Elastography (MRE) accurately predicts fibrosis by measuring liver stiffness. The subjectivity in human analysis poses the biggest challenge to stiffness measurement reproducibility, and also complicates the training of a neural network to automate the task. In this work, we present a CNN-based stiffness measurement tool, giving special attention to training and validation in context of reader subjectivity. Compared to an older automated tool used by our institution in a reader-verified workflow, the CNN reduces ROI failure rate by 50%, and has an excellent agreement in measured stiffness with reader-verified target ROIs.
Introduction
Magnetic Resonance Elastography (MRE) is a technique which delivers acoustic waves to the patient and images them with a phase-contrast sequence to calculate quantitative stiffness of tissues.[1] MRE has excellent accuracy for predicting liver fibrosis, and is used clinically by over 1000 sites. Analysis of MRE images requires dedicated training to avoid unique stiffness-related artifacts, and is subjective. Even experienced readers take 15-20 minutes to process a 4-slice MRE exam, and calculate stiffness values with a coefficient of variation of 8-10%.[2] An automated MRE analysis method (ALEC) has previously been proposed, and is currently used to analyze >1000 MRE exams annually at our institution.[3] However, the workflow involves an MRE reader verifying every automated ROI before the results are reported clinically. To reduce the automated ROI failure rate and, consequently, the burden of manual verification/modification, we propose a new tool based on a multi-channel fully-convolutional neural network architecture (CNN).An MRE dataset consists of acquired magnitude and phase images, and derived stiffness and confidence images (Figure 1). ROI selection in MRE is a multi-channel segmentation problem aiming to select tissue within the liver without inclusions (e.g. tumors, major vessels) or stiffness-affecting artifacts. An ROI covering all valid liver area leads to best reproducibility. Human readers draw ROIs of varying sizes, however, and two entirely non-overlapping ROIs may both be valid, which poses a problem for training a neural network. Similarly, while automated ROI failures are easily detected and modified, there is substantial variation in whether and how modification is done for sub-optimal ROIs. The validation in this study focused on improving the clinical workflow by reducing the number of failures (incorrect stiffness and/or major anatomical leak) and sub-optimal ROIs (smaller non-stiffness affecting leak or small ROI area).
Methods
Training. 4600 consecutive clinical MRE exams were retrieved under a consent-waived IRB from the clinical workflow. Automated ROIs produced by the old method were retrospectively reviewed by the same experienced reader and modified when necessary to remove stiffness artifact, anatomical leakage of >1% of ROI area, or to increase ROI size if it covered <50% of useable liver tissue. The manually reviewed/modified ROIs were used as the training target. Multi-channel data for each imaging slice was treated as an independent training example. Data was split into a 3600 exam training set (14400 examples), and 1000 exam test set.Algorithm. Each example was centered and cropped down to the patient size, with coordinates retained to inverse-transform the ROI. Images were downsampled to 64x64, and a 12-layer 3-channel fully convolutional network was trained on the magnitude, stiffness, and confidence images to calculate ROIs by optimizing dice loss.
Evaluation. Dice coefficient and stiffness agreement with the target ROIs were calculated. Based on the MRE reproducibility threshold of 19%, ROIs with a stiffness difference of >=20% with the target were considered failed. Anatomical ROI leakage was assessed visually and cases with >10% leak were labeled as failed and 1-10% as sub-optimal. Leak of <1% area into partial volume was considered acceptable, as these cases would not be modified clinically. ROIs covering <50% of useable area were considered sub-optimal. Sub-optimal ROIs are cases likely to be modified clinically but do not carry a risk of wrong diagnosis if the reader fails to modify them as the reported stiffness is within MRE reproducibility limits.
Results
The dice coefficient between CNN ROIs and target ROIs reached 0.87 in the training set and 0.86 in the test set. The difference in calculated stiffness was 0.94% +/- 3.25% (mean +/- SD) in the training set and 1.37% +/- 7.54% in the test set, with correlation coefficient being excellent (>0.98) in both sets (Figure 2). The proposed CNN method improved the failure rate from 5.7% for the old method to 3%, and the rate of sub-optimal ROIs from 10.7% to 2.5%. The breakdown of types of issues for the two methods is shown in Figure 3. Examples of CNN improving on ALEC by avoiding ROI leakage into ascites and avoiding a vessel-related soft spot are shown in Figures 4 and 5. CNN analysis time for a single exam on an office PC was <5 seconds while ALEC takes around 3 minutes.Discussion
This study uses categorical validation of ROIs with the aim of evaluating how the tool will perform in the clinic. The stiffness difference of the CNN with the target was better than agreement between experienced human readers.[2-3] A comparison of stiffness agreement with target ROIs for the CNN and ALEC is, unfortunately, impractical as most of the target ROIs come directly from ALEC. The failure rates observed in this dataset are higher than those seen in validations of ALEC. We believe this to be a consequence of having a more challenging dataset resulting from pulling all series that were transferred to the clinical workstation. A spot check showed that some of the most difficult examples had been considered failed exams, and a different series was used in the clinical report.Conclusions
The CNN-based MRE analysis method substantially reduces the number of automated ROI failures, and has an excellent agreement with the final results of the reader-verified workflow.Acknowledgements
This work was supported by NIH EB001981.References
1. Muthupillai R, Ehman RL. Magnetic resonance elastography. Nat Med. 1996;2(5):601-3. 2. Serai, SD, et al. Repeatability of MR Elastography of Liver: A Meta-Analysis. Radiology. 2017. 285(1):92-100. 3. Dzyubak B, Venkatesh S, Manduca A, Glaser J, Ehman R. Automated liver elasticity calculation for MR elastography. J Magn Reson Imag. 2016;43(5):1055-63.Figures
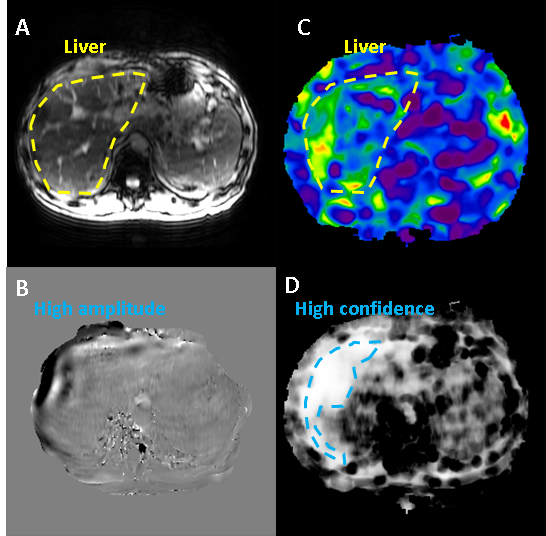
Figure 1: Example of MRE image set: A) magnitude image
showing anatomical information, B) phase image showing quantitative
displacement values which characterize wave propagation (peak-peak wavelength
is proportional to tissue stiffness), C) stiffness image with quantitative
values in kPa’s at every voxel, D) confidence image indicating quality of
inversion model fit to phase data. Stiffness and confidence images contain
information from the phase image, so it was not included as an explicit input.
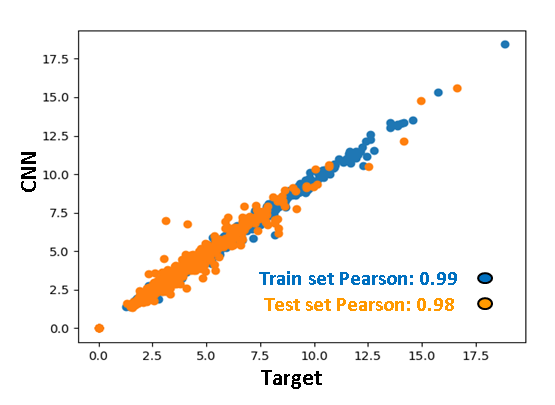
Figure 2: Agreement between stiffness calculated from CNN ROIs and target ROIs. The correlation is excellent in both the train and the test sets. The range of values in this study is substantially broader than the diagnostic range of 2.5-6 kPa, suggesting that the tool should perform well across a broad range of disease states.
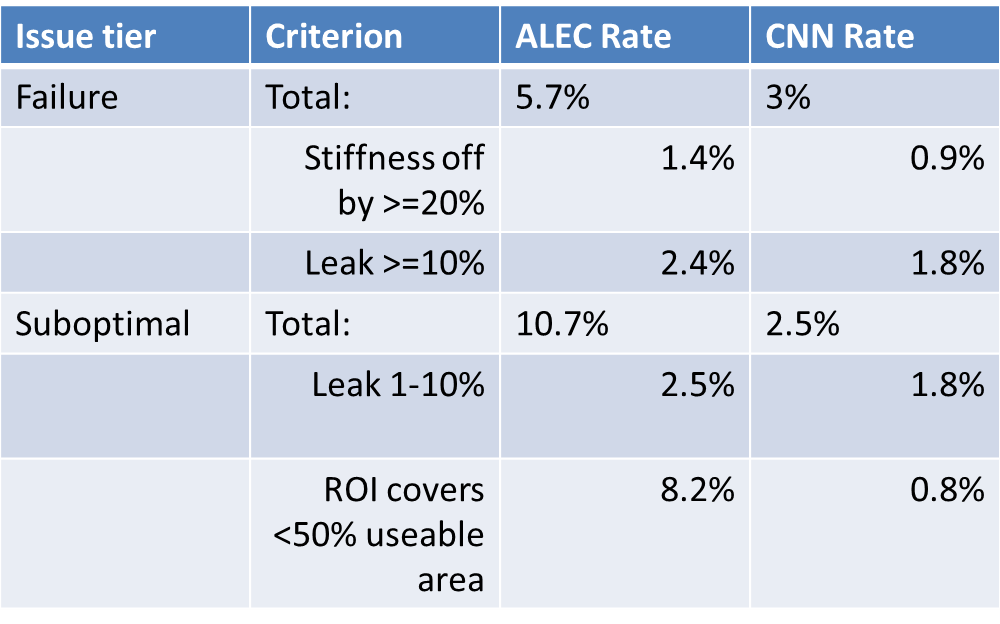
Figure 3: Breakdown of failure and sub-optimal ROI rates for the clinical tool (ALEC) and new tool (CNN). CNN shows a substantial reduction in both failed and sub-optimal ROIs.
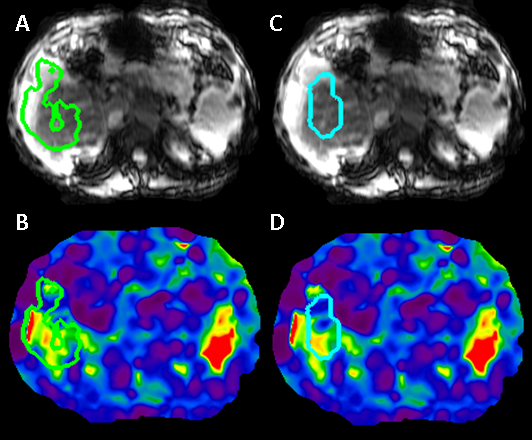
Figure 4: Illustration of improved anatomical segmentation
by CNN. ALEC fails to exclude ascites (A), a rare anatomical feature which is associated
with late-stage fibrosis, while CNN includes only liver tissue (C).
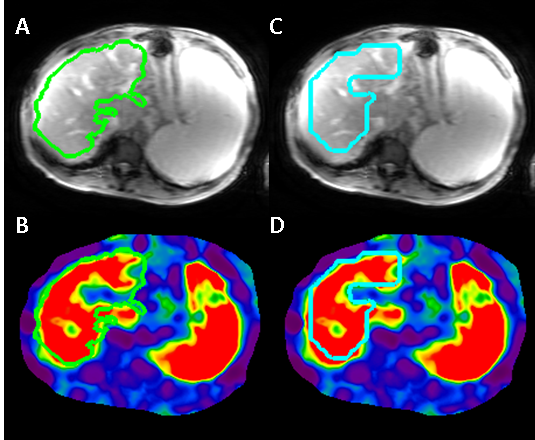
Figure 5: Illustration of improved artifact exclusion by
CNN. ALEC fails to exclude a soft spot caused by a mostly-out of plane blood
vessel (B), while the CNN tool excludes it successfully (D). Most vessels do
not cause a stiffness-related artifact (A vs B), which is only detectable based
on a sharp stiffness transition. An MRE dataset consist of 4 thick 1-cm slices,
which causes a 3D segmentation to also be ineffective at excluding blood
vessels.