3571
Whole-brain CBF and BAT mapping in 4 minutes using deep-learning-based, multi-band MR fingerprinting (MRF) ASL1The Russell H. Morgan Department of Radiology & Radiological Science, Johns Hopkins School of Medicine, Baltimore, MD, United States, 2Department of Biomedical Engineering, Johns Hopkins School of Medicine, Baltimore, MD, United States, 3Department of Neurosurgery, Johns Hopkins School of Medicine, Baltimore, MD, United States, 4F. M. Kirby Research Center for Functional Brain Imaging, Kennedy Krieger Institute, Baltimore, MD, United States
Synopsis
Arterial-Spin-Labeling (ASL) MRI has not been used widely in clinical practice because of lower SNR and the lack of ability to resolve cerebral-blood-flow (CBF) from bolus-arrival-time (BAT) effects1. MR fingerprinting (MRF) ASL is a recently developed technique which has the potential to provide multiple parameters such as CBF, BAT, T1 and cerebral-blood-volume (CBV) in one single scan2-6. However, it still suffers from low SNR. The present work proposes a multi-band MRF-ASL in combination with deep learning, which can improve the reliability of MRF-ASL parametric maps up to 3-fold and provide whole-brain mapping of CBF and BAT in 4 minutes.
INTRODUCTION:
ASL MRI as recommended by the white paper has not been used widely in clinical practice due to several reasons including the lack of bolus arrival time (BAT) information and confounding effects of tissue T1 and vessel contamination1. MR fingerprinting (MRF) ASL is a recently developed technique which has the potential to overcome some of these limitations2-6. However, previous reports on MRF-ASL were largely based on single-slice and the technique still suffers from low SNR. The present work aims to leverage the power of deep-learning to improve the reliability of hemodynamic maps while using multi-band acquisition to obtain whole-brain coverage. The specific concept of our deep-learning approach is to train the neural-network (NN) with high fidelity data (i.e. enormously averaged MRF-ASL data acquired over 40 minutes), then applying the NN on single-run (i.e. 4 minute) data. Performance of the technique on both healthy and brain tumor subjects was examined.METHODS:
MR Experiment:Fifteen healthy subjects (25.5 ± 2.8 yo, 7F) were scanned on a 3T Philips scanner, each receiving ten repetitions of the MRF-ASL protocol2. Imaging parameters: matrix size=64×64×16; voxel size=2.8×2.8x8mm3; multi-slice EPI; multi-band factor 2; 500 dynamics; scan duration=4min per run, 40min in total.
In addition, MRF-ASL data was also collected on a patient with brain tumor to demonstrate the clinical performance of this technique.
Training, validation, and testing of the neural network (NN):
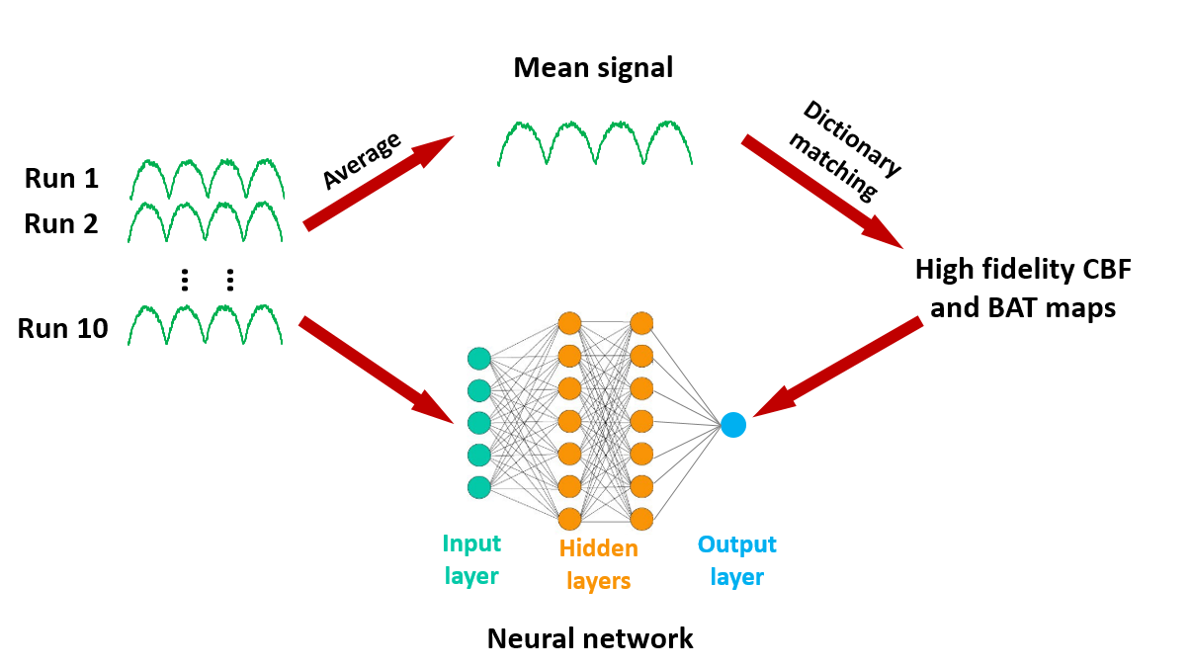
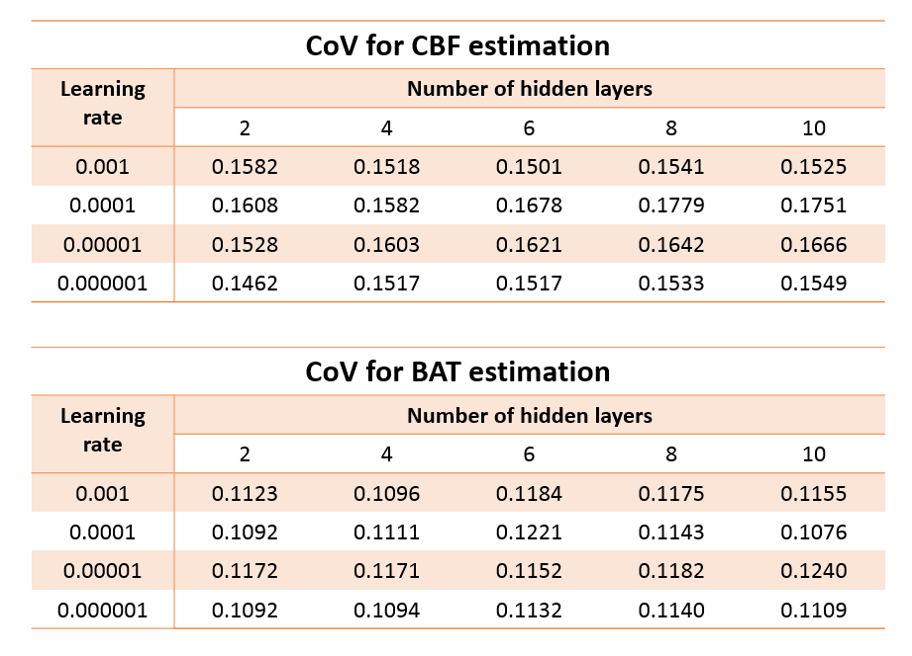
Data from the 15 subjects were divided into three groups, 5 as training, 5 as validation and 5 as testing datasets. For training of the NN (N=5), high-SNR data were obtained by averaging the 10 MRF-ASL runs into a single-run (Figure 1). CBF and BAT were then obtained from dictionary matching (DM) as described previously2. These high-SNR CBF and BAT maps were used as output variables in the training of the NN. The input variables used single run MRF-ASL data, so that the noise level matches that in future testing data. Fully connected NN was used, consisting of input/output layers and hidden layers (Figure 1). Since learning rate and the number of hidden layers are important hyperparameters in NN, we tested four different learning rates (0.001-0.000001) and five different hidden layers (2-10) in a matrix design.
Next, using the validation data (N=5), we applied the trained NN to single-run MRF-ASL data (4 min). The 10 runs acquired in each subject allowed the calculation of coefficient-of-variation (CoV) of the parametric values. The hyperparameters (i.e. learning rate, hidden layer number) corresponding to the lowest CoV were used as the optimal NN.
Finally, using the testing data (N=5), we applied the optimal NN to single-run MRF-ASL data and computed CoV across the 10 runs. Correlation coefficients (CC) between NN and dictionary-matching results were computed.
Additional considerations of the NN performance:
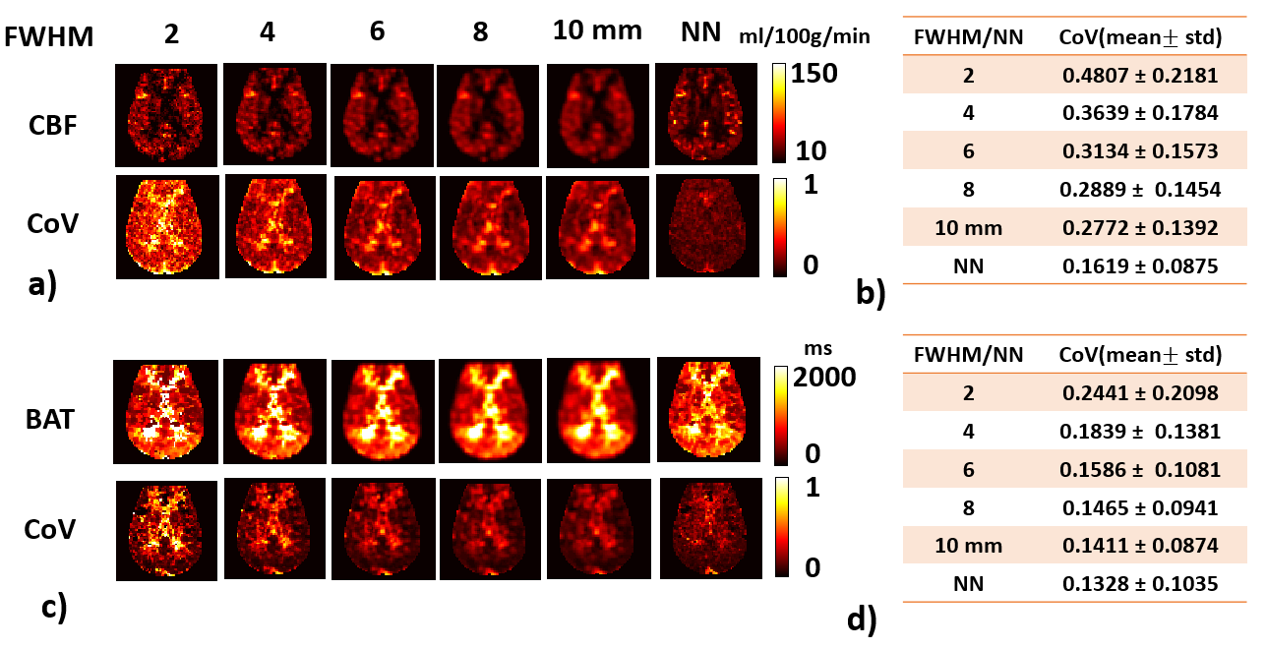
To examine whether NN-based maps were just a “smoothed-version” of DM-based results, Gaussian filter with 5 different FWHMs (2-10mm) were used to smooth the parametric maps derived from DM and compared to the NN results.
Finally, to examine whether experimental data are actually needed to train the NN, the NN was also trained with simulation data generated by perfusion kinetic model (without add any noise)2, and was applied on the testing dataset.
RESULTS and DISCUSSION:
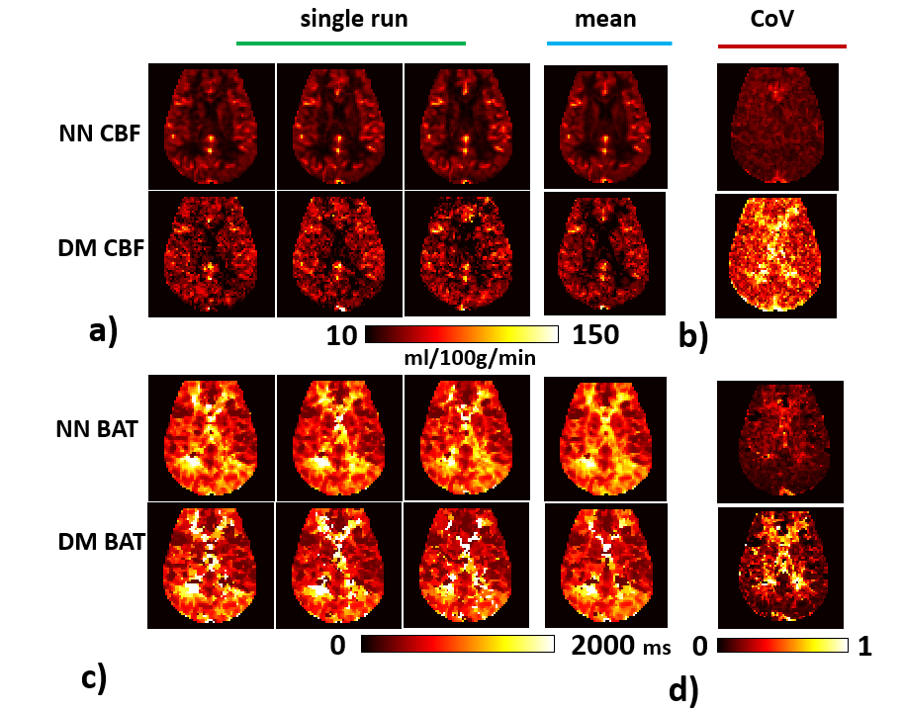
Table 1 shows the CoV matrix as a function of learning rate and hidden layer number, from the validation data. It can be seen that, for CBF, the lowest CoV corresponds to 2 hidden layers and a learning rate of 0.000001. For BAT, it is 10 hidden layers and a learning rate of 0.0001. However, it should be noted that the differences across layers/rates are small.Figure 2 shows representative CBF and BAT maps estimated using NN, in comparison with those using DM (arbitrary 3 out of 10 runs are shown). Corresponding CoV maps are shown in Figures 2b and e. Voxel-wise CoV of NN CBF results was 0.16±0.09, which is 1/3 of that of the DM (0.48±0.21). For BAT, CoV of NN and DM was 0.13±0.1 and 0.25±0.21, respectively.
Quantitative results between NN and DM were strongly correlated across subjects (testing data, N=5). For CBF, the cc value was 0.85 with a slope of 1.04. For BAT, the cc value was 0.95 with a slope of 0.97.
To demonstrate that the reduced CoV observed in the NN results is not simply a consequence of spatial smoothing, we smoothed the DM results at various FWHM (Figure 3). As can be seen, the CoV associated with NN results is still lower than the 10-mm smoothed DM results.
When using the simulated data to train the NN and applying it on the testing experimental data, CoV was found to be 0.34±0.22, which is greater than both NN and DM results, suggesting that NN trained with high-fidelity experimental data outperforms that trained with simulation data, presumably because perfusion kinetics are more complicated than depicted by the model.
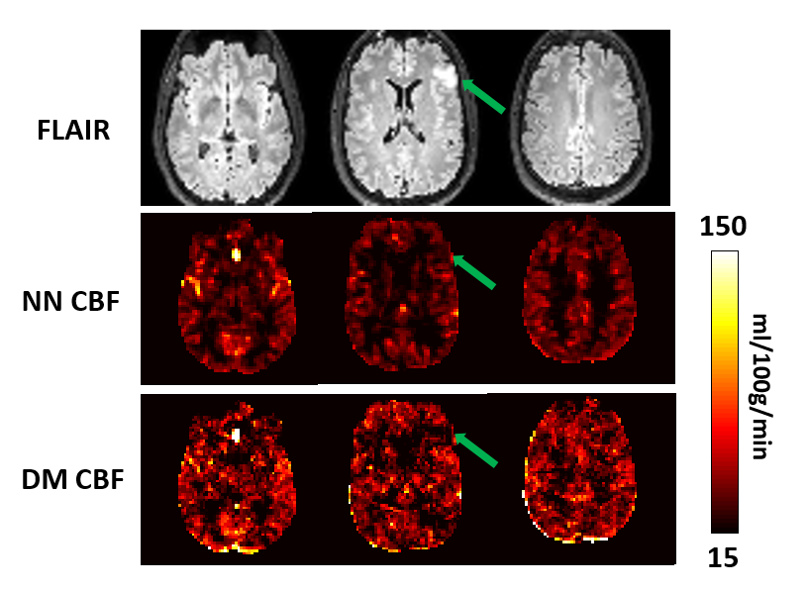
Figure 4 shows the results in brain tumor patient. The superior quality of the hemodynamic maps afforded by the NN results allowed more conspicuous depiction of hypoperfusion in the tumor.
CONCLUSION
Deep-learning improves the reliability of MRF-ASL parametric maps up to 3-fold, and can provide whole-brain, quantitative mapping in 4 minutes.Acknowledgements
No acknowledgement found.References
1. Alsop DC, Detre JA, Golay X et al. Recommended implementation of arterial spin-labeled perfusion MRI for clinical applications: A consensus of the ISMRM perfusion study group and the European consortium for ASL in dementia. Magn Reson Med 2015;73:102-116.
2. Su P, Mao D, Liu P, Li Y, Pinho MC, Welch BG, Lu H. Multiparametric estimation of brain hemodynamics with MR fingerprinting ASL. Magn Reson Med 2017;78:1812-1823.
3. Wright KL, Jiang Y, Ma D, Noll DC, Griswold MA, Gulani V, Hernandez-Garcia L. Estimation of perfusion properties with MR Fingerprinting Arterial Spin Labeling. Magnetic Resonance Imaging 2018;50:68-77.
4. Su P, Fan H, Liu P et al. MR fingerprinting ASL: Sequence characterization and comparison with dynamic susceptibility contrast (DSC) MRI. NMR Biomed 2019. doi: 10.1002/nbm.4202:e4202.
5. Zhang Q, Su P, Liao Y, Guo R, Qi H, Hu Z, Lu H, Chen H. Deep learning based MR fingerprinting ASL ReconStruction (DeepMARS). 2019. p 0820.
6. Lahiri A, Fessler A J, Hernandez-Garcia L. Optimazing MRF-ASL Scan Design for Precise Quantification of Brain Hemodybamics using Neural Network Regression. arXiv preprint. arXiv: 1905.06474.
Figures