3566
Retrofitting a Brain Segmentation Algorithm with Deep Learning Techniques: Validation and Experiments1Siemens Healthcare Pvt. Ltd., Bangalore, India, 2Vidyavardhaka College of Engineering, Mysuru, India, 3Advanced Clinical Imaging Technology, Siemens Healthcare AG, Lausanne, Switzerland, 4Department of Radiology, Centre Hospitalier Universitaire Vaudois (CHUV) and University of Lausanne (UNIL), Lausanne, Switzerland, 5Signal Processing Laboratory (LTS 5), École Polytechnique Fédérale de Lausanne (EPFL), Lausanne, Switzerland
Synopsis
Deep learning techniques have proved their robustness in solving medical image analysis problems. This study proposes a conservative approach to benefit from the use of these methods to incrementally improve the performance of a well-established brain segmentation method. For this purpose, convolutional neural networks are trained to perform a reliable skull-stripping, based on weak labels of the original algorithm. The performance of the new pipeline is evaluated in a large cohort of dementia patients and healthy controls. The results present significant improvements in reproducibility and computation speed, while preserving accuracy and power of discrimination between groups.
Introduction
Several studies have shown how deep learning methods out-perform well-established clinically validated methods in the medical image analysis field1, in particular for brain segmentation. New solutions based on convolutional neural networks (CNN) have been proposed in literature2,3; however, most of these techniques still require further clinical validation to be fully integrated in clinical routine. This work presents a more conservative approach to benefit from the use of new deep learning techniques and, at the same time, preserving and/or improving the original performance of a template-based segmentation algorithm included in a validated in-house prototype for brain morphometry analysis4.Skull-stripping usually affects reproducibility, accuracy, and overall execution time of brain segmentation algorithms, and it is critical in the detection of clinically relevant brain volume changes over time. This study evaluates the impact of using a CNN-based skull-stripping method trained on weak labels generated by the original algorithm and validates its effect on the overall performance of the original algorithm.
Materials and methods
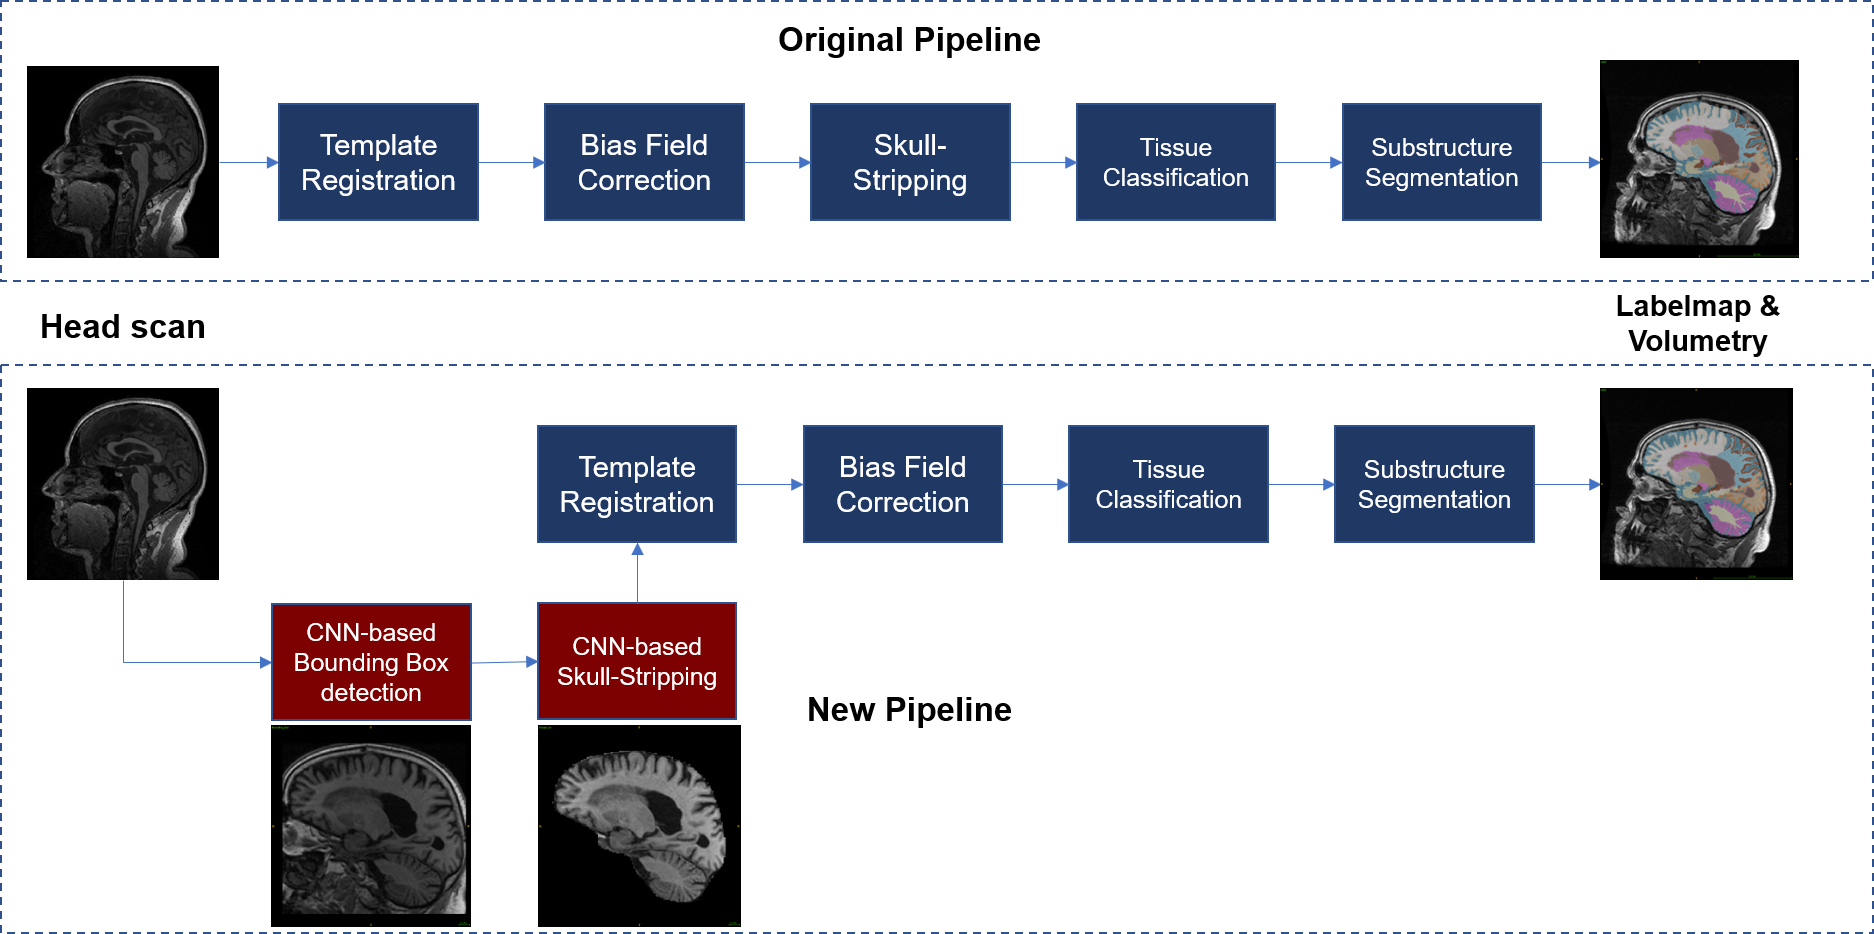
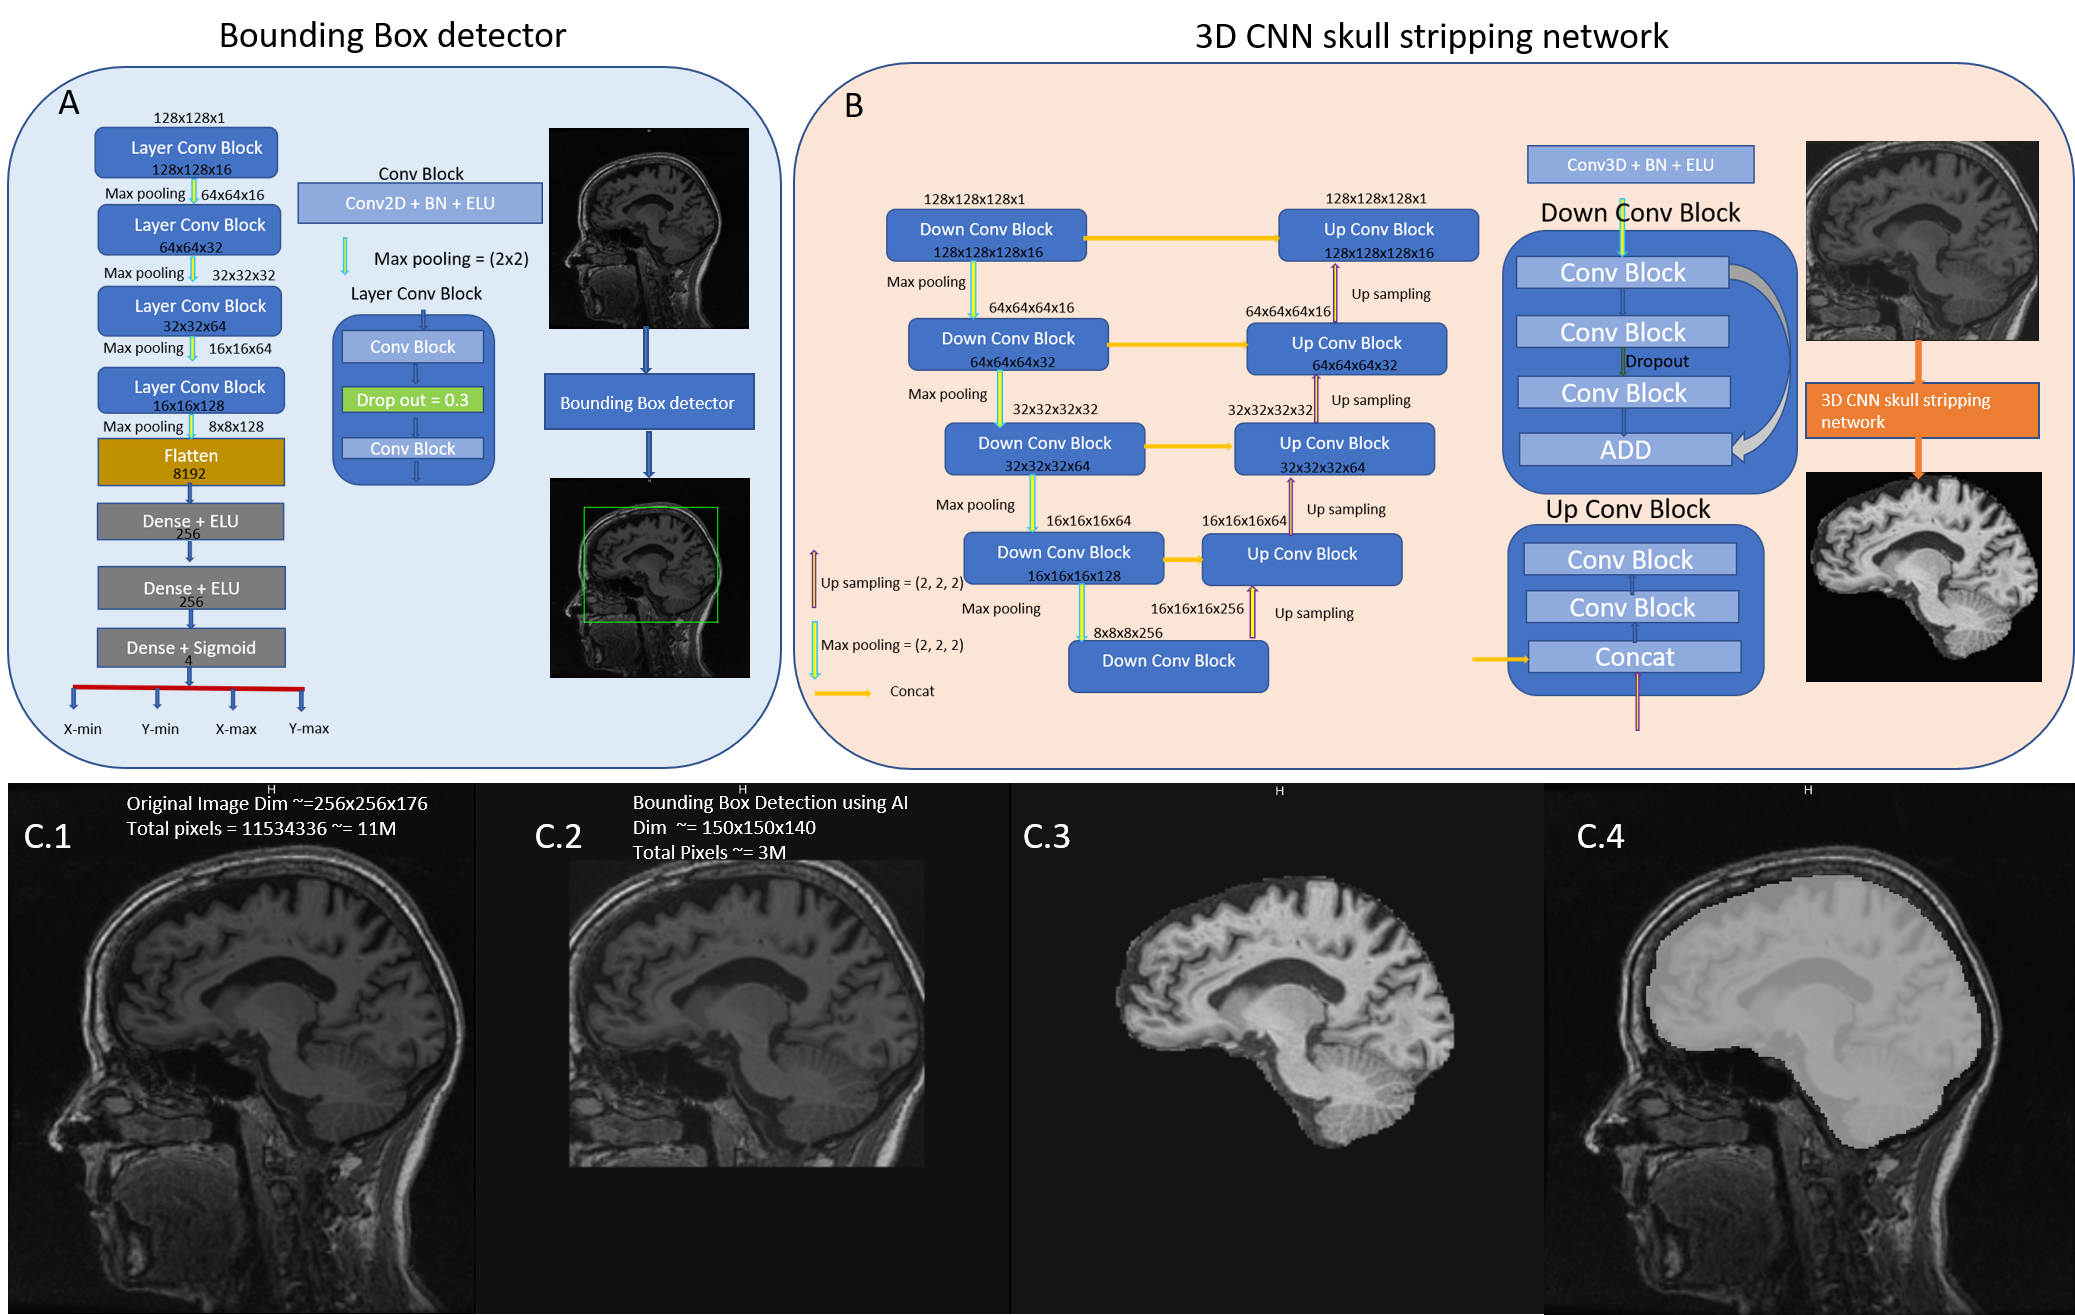
Figure 1 presents an overview of the original and new segmentation pipelines. The main modifications include CNN-based components for fast detection of a bounding box enclosing the brain and automated skull stripping (Figure 2). Bias field correction and following segmentation4 steps were adjusted by skull stripping T1w template to enable skull-stripped image inputs.For training the CNN-based algorithms, T1-weighted MR scans from 404 subjects were collected from the ADNI database5, 92 Alzheimer’s disease (AD) patients, 203 multiple cognitive impairment (MCI) patients and 109 healthy controls (HC), including repeated scans per subject. A total intracranial volume (TIV) mask per scan was automatically generated4, thus providing “weak labels” for training. Masks were manually corrected only in regions where a prominent under-segmentation by the original method was noticed. Data augmentation was performed by applying random rotations (±15°, X, Y, Z axes) and translations. After augmentation, a total of 2500 3D volumes were used for training, scans presenting image quality defects were excluded. The 3D volumes were resized to 128x128x128, while maintaining the aspect ratio. Each image’s intensities were normalized to zero mean and unit standard deviation. The TIV masks were also used to create reference data for training the bounding box detection network (Figure 2.A).
The 3D CNN model architecture for skull stripping uses the 3D volumes as input (Figure 2.B). Each conv block performs a 3D convolution followed by batch normalization and exponential linear unit activation with negative slope, α=1.0. A Xavier Normal Initializer7 was used for weights and Dice coefficient between the predicted and target masks was used as loss function. The network was trained for 200 epochs. The bounding box detection network was trained on 2D sagittal slices. Mean squared error was used as loss function.
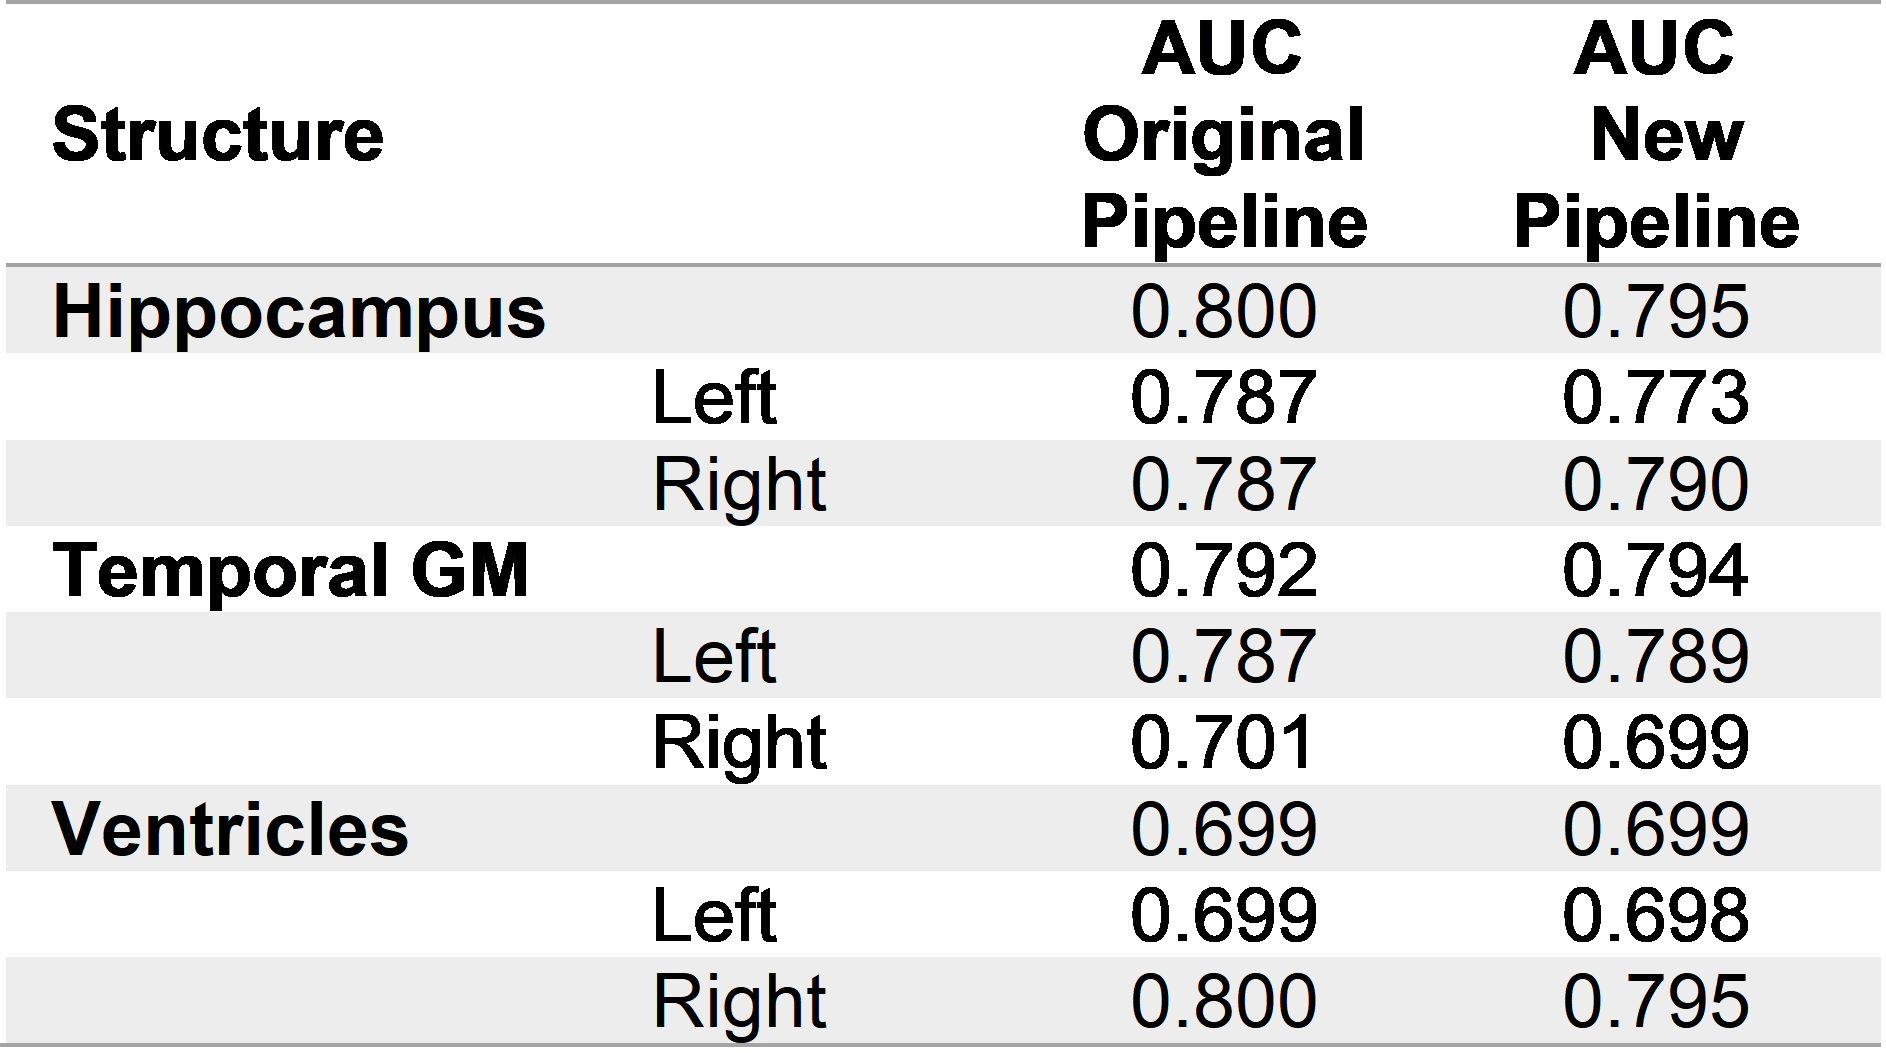
Repeatability was evaluated in a scan-rescan ADNI1 subset of 749 subjects (HC=214, MCI=367, AD=168) by computing the coefficient of repeatability6 (CR) of 15 brain regions normalized by their mean volume. P-values from a Pitman-Morgan7,8 test, Benjamini-Hochberg false discovery rate (FDRBH)-adjusted for multiple comparisons across regions, were evaluated for significance. Manual segmentation of 13 brain regions on 29 additional ADNI cases was used to validate segmentation accuracy using Dice coefficient. Wilcoxon test FDRBH-adjusted p-values were evaluated for significance. A subset of regions typically relevant for the clinical analysis of dementia (e.g. hippocampus, ventricles, temporal gray matter) was used to evaluate the discrimination power between AD and HC as the area under the ROC curve (AUC).
Results
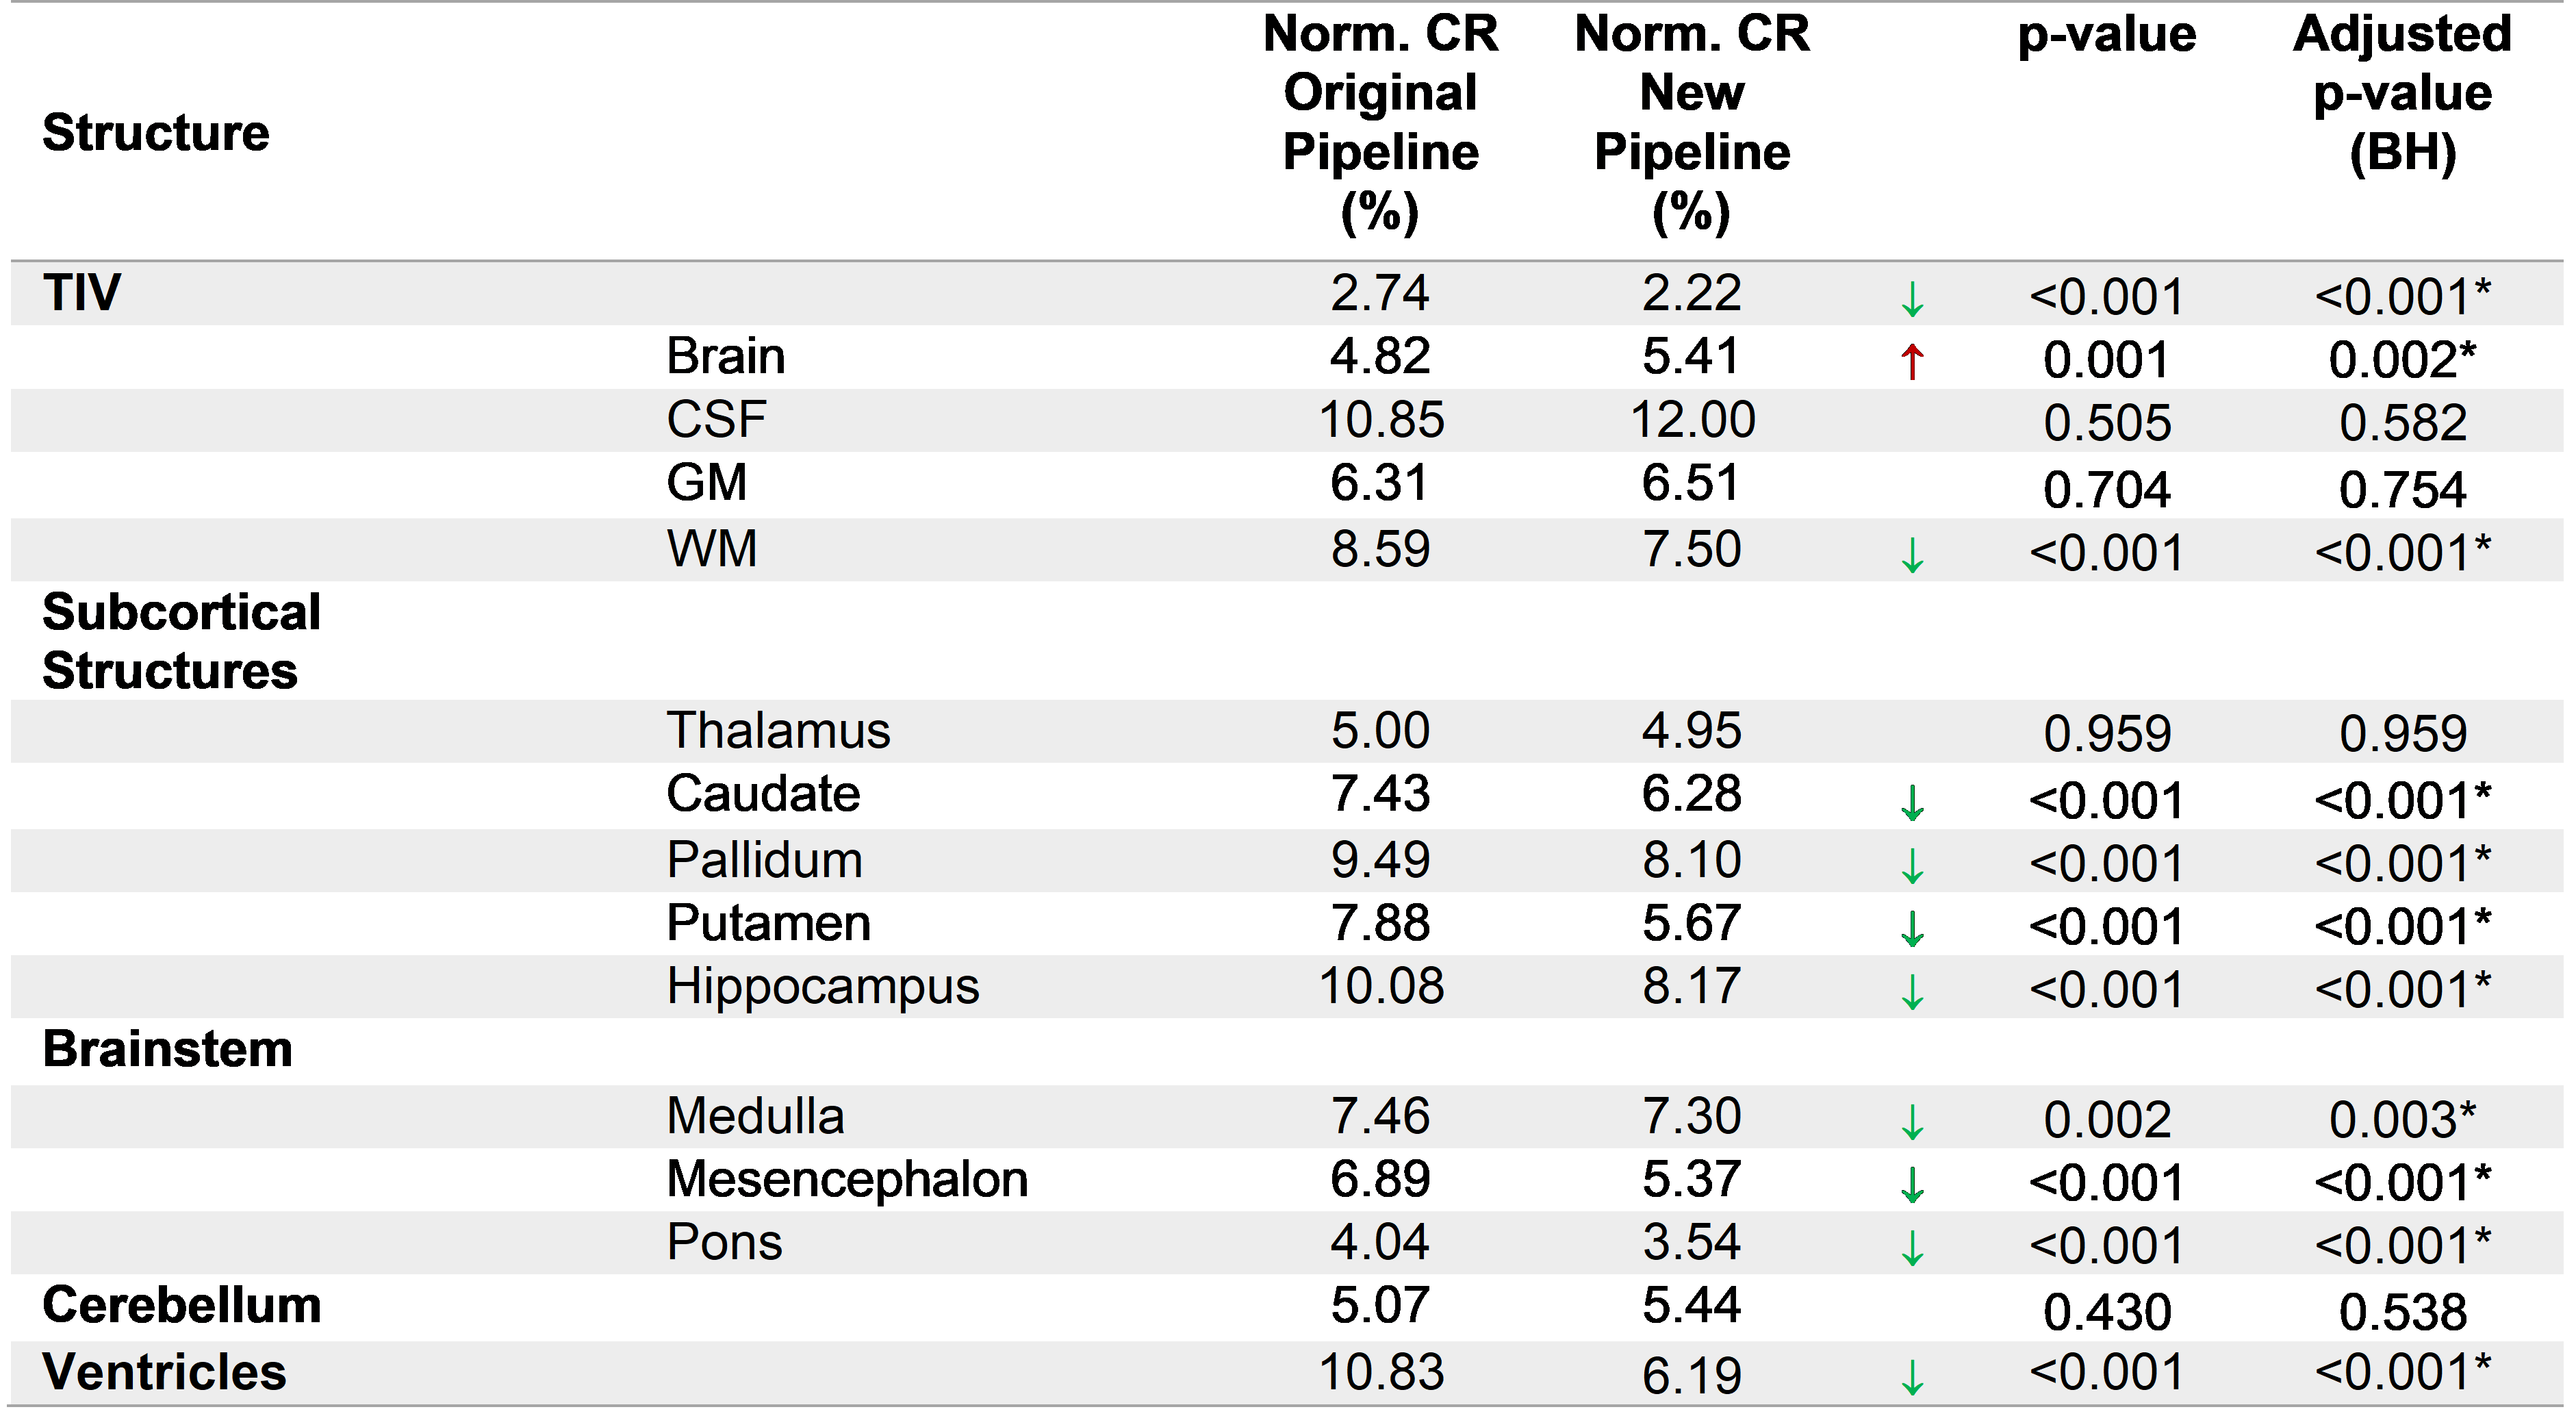
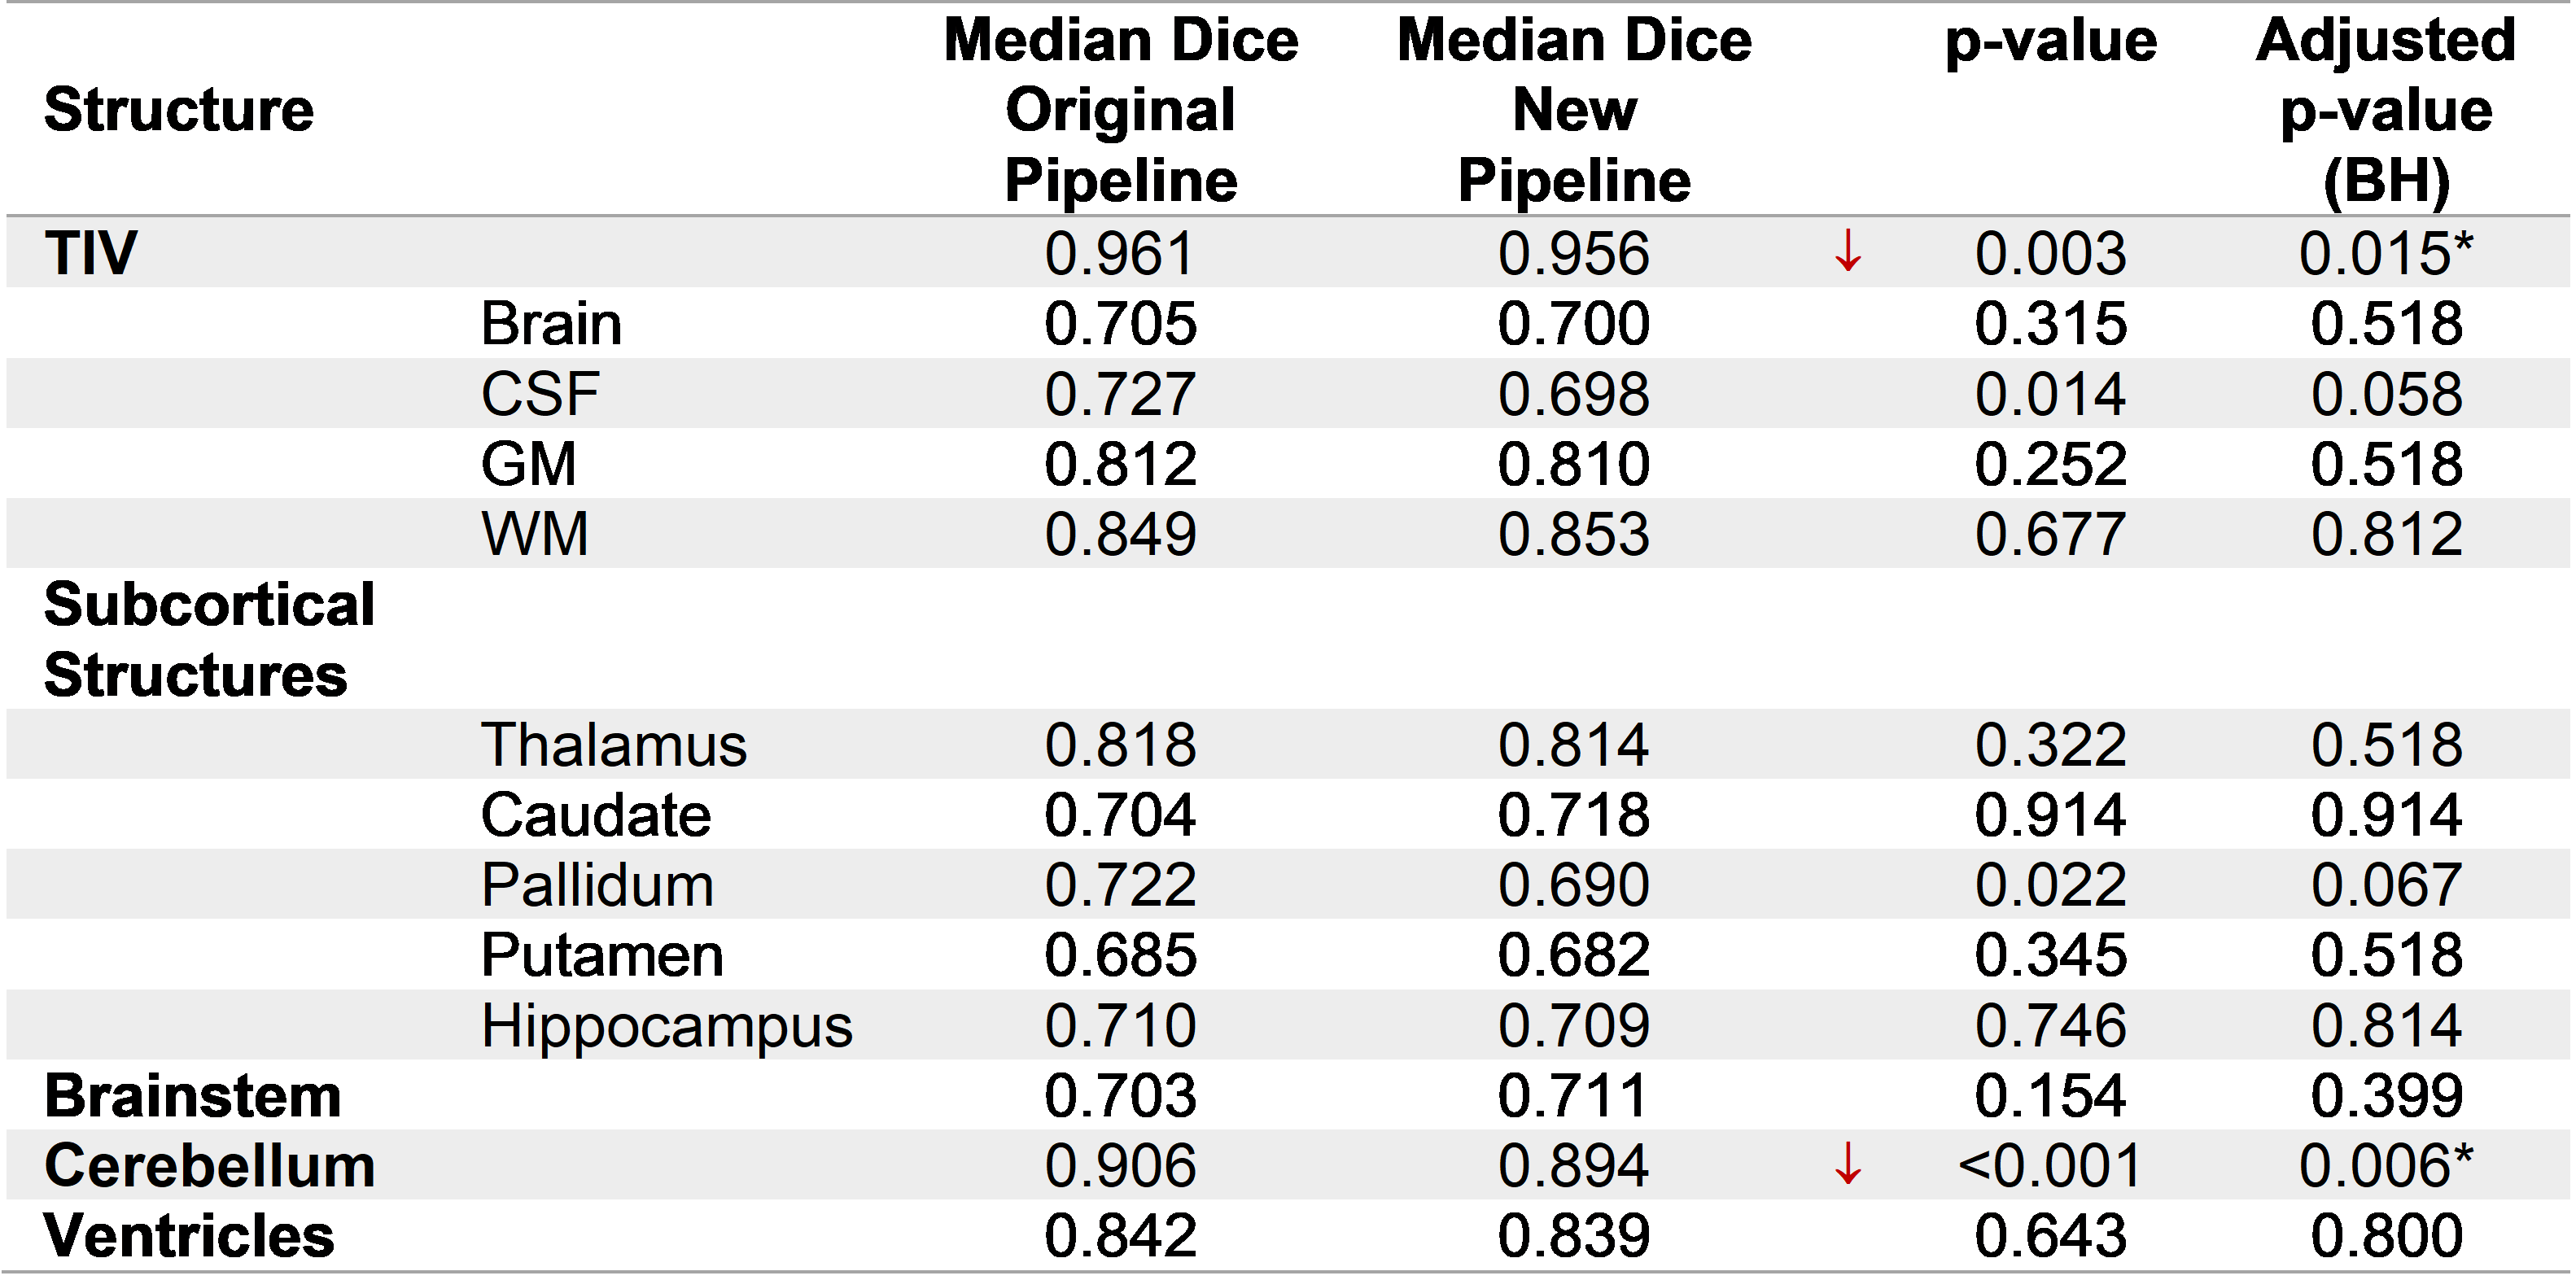
Most of the structures presented a significant improvement in repeatability (Table 1), particularly an important reduction of CR in the ventricles (4.64%), as well as in small substructures such as the putamen (2.21%) and the hippocampus (1.91%). The TIV had also a small improvement in repeatability (0.52%). In contrast, whole brain and cerebellum increased their variability (0.59% and 0.37%, respectively). Table 2 compares the median Dice between the methods and manual segmentations. For most of the structures there were no significant differences, except for the TIV and cerebellum. For the discrimination of AD vs. HC, the AUC did not present substantial differences (Table 3). The modifications in the pipeline made the computations 1.6x faster (Original pipeline: 110s vs. new pipeline: 69s, both running in Intel Core i7-4710MQ CPU 2.50 GHz).Discussion and Conclusions
This work presents a validation of the brain morphometry analysis after including a CNN-based skull-stripping in the original pipeline brain segmentation algorithm. Overall, the results present an increase in reproducibility whilst preserving the segmentation accuracy. Moreover, there is a non-negligible increase in speed induced by an early skull-stripping integrated in the former steps of the pipeline.The significant improvements in reproducibility suggest that these results may provide a more stable volumetry in longitudinal analysis which is crucial for the identification of neurodegenerative diseases; the present work only used cross-sectional data. This study does not present an analysis on the cortical regions that may explain the decrease in reproducibility for the whole brain. This requires further investigation. The accuracy remained in the same range for most of the regions. The effect in the TIV is explained by differences on the definition of TIV particularly in the bottom of the brain between manual segmentations and the template used in the automated algorithm.
Acknowledgements
Data collection and sharing for this project was funded by the Alzheimer's Disease Neuroimaging Initiative (ADNI) (National Institutes of Health Grant U01 AG024904) and DOD ADNI (Department of Defense award number W81XWH-12-2-0012). ADNI is funded by the National Institute on Aging, the National Institute of Biomedical Imaging and Bioengineering, and through generous contributions from the following: AbbVie, Alzheimer’s Association; Alzheimer’s Drug Discovery Foundation; Araclon Biotech; BioClinica, Inc.; Biogen; Bristol-Myers Squibb Company; CereSpir, Inc.; Cogstate; Eisai Inc.; Elan Pharmaceuticals, Inc.; Eli Lilly and Company; EuroImmun; F. Hoffmann-La Roche Ltd and its affiliated company Genentech, Inc.; Fujirebio; GE Healthcare; IXICO Ltd.; Janssen Alzheimer Immunotherapy Research & Development, LLC.; Johnson & Johnson Pharmaceutical Research & Development LLC.; Lumosity; Lundbeck; Merck & Co., Inc.; Meso Scale Diagnostics, LLC.; NeuroRx Research; Neurotrack Technologies; Novartis Pharmaceuticals Corporation; Pfizer Inc.; Piramal Imaging; Servier; Takeda Pharmaceutical Company; and Transition Therapeutics. The Canadian Institutes of Health Research is providing funds to support ADNI clinical sites in Canada. Private sector contributions are facilitated by the Foundation for the National Institutes of Health (www.fnih.org). The grantee organization is the Northern California Institute for Research and Education, and the study is coordinated by the Alzheimer’s Therapeutic Research Institute at the University of Southern California. ADNI data are disseminated by the Laboratory for Neuro Imaging at the University of Southern California.References
1. Lundervold AS, Lundervold A. An overview of deep learning in medical imaging focusing on MRI. Z Med Phys. 2019;29(2):102-127. doi:10.1016/J.ZEMEDI.2018.11.002
2. Akkus Z, Galimzianova A, Hoogi A, Rubin DL, Erickson BJ. Deep Learning for Brain MRI Segmentation: State of the Art and Future Directions. J Digit Imaging. 2017;30(4):449-459. doi:10.1007/s10278-017-9983-4
3. Fedorov A, Johnson J, Damaraju E, Ozerin A, Calhoun V, Plis S. End-to-end learning of brain tissue segmentation from imperfect labeling. In: 2017 International Joint Conference on Neural Networks (IJCNN). ; 2017:3785-3792. doi:10.1109/IJCNN.2017.7966333
4. Schmitter D, Roche A, Marechal B, et al. An evaluation of volume-based morphometry for prediction of mild cognitive impairment and Alzheimer’s disease. NeuroImage Clin. 2015;7:7-17. doi:10.1016/j.nicl.2014.11.001
5. Wyman BT, Harvey DJ, Crawford K, et al. Standardization of analysis sets for reporting results from ADNI MRI data. Alzheimers Dement. 2013;9(3):332-337. doi:10.1016/j.jalz.2012.06.004
6. Bland JM, Altman DG. Applying the right statistics: analyses of measurement studies. Ultrasound Obstet Gynecol. 2003;22(1):85-93. doi:10.1002/uog.122
7. Pitman EJG. A Note on Normal Correlation. Biometrika. 1939;31(1/2):9-12. doi:10.2307/2334971
8. Morgan WA. A Test for the Significance of the Difference Between the Two Variances in a Sample From a Normal Bivariate Population. Biometrika. 1939;31(1/2):13-19. doi:10.2307/2334972
Figures