3565
Retraining a Deep Learning Model to Detect Cerebral Microbleeds Using Single-Echo Stroke Data1Magnetic Resonance Innovations, Inc., Bingham Farms, MI, United States
Synopsis
Automatic cerebral microbleed detection is attainable with our two step model for many disease states. We attributed previously shown lower performance in stroke data to different scenarios unique to stroke, including asymmetrically prominent cortical veins. We improved our existing pipeline for this detection by retraining the deep learning step of our model using stroke cases both in the acute and subacute stages. The results were improved performance in validation data in stroke cases as well as our previously tested data (multiple diseases). This makes our pipeline a viable and versatile real time automatic microbleed detection procedure.
Introduction
Cerebral microbleeds (CMBs) are small foci of blood products found in patients affected by a multitude of conditions, including Alzheimer's disease, stroke, and traumatic brain injury1-2. While the location of CMBs has been associated with etiology, the number of CMBs could indicate the risk of future intracerebral hemorrhage and cognitive impairment3-4. Susceptibility weighted imaging (SWI) has proven to be one of the more powerful tools by which to detect CMBs and quantitative susceptibility mapping (QSM) to measure changes in oxygen saturation. Previously, we presented a two-stage CMB detection framework which contains a candidate detection stage based on a 3D fast radial symmetry transform of the composite images from SWI, and a false positive reduction stage based on deep residual neural networks using both the SWI and the high-pass filtered phase images. Our findings included different clinical etiologies and were published5. That work achieved an overall sensitivity of 95.8%, 70.9% precision, and 1.6 false positives per case. Stroke cases, however, had an increased number of false positives, partially due to asymmetrically prominent cortical veins. We aimed to correct this by retraining the deep learning model using stroke cases.Methods
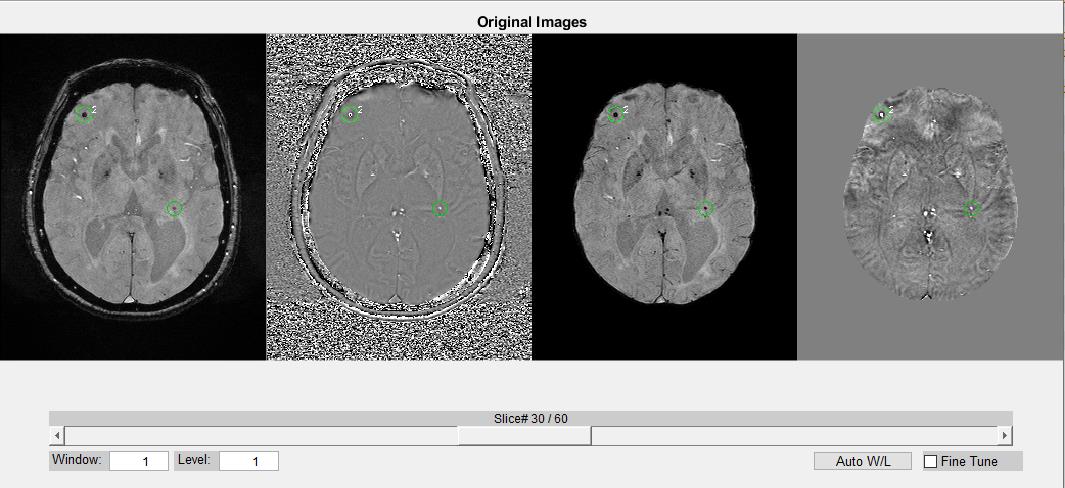
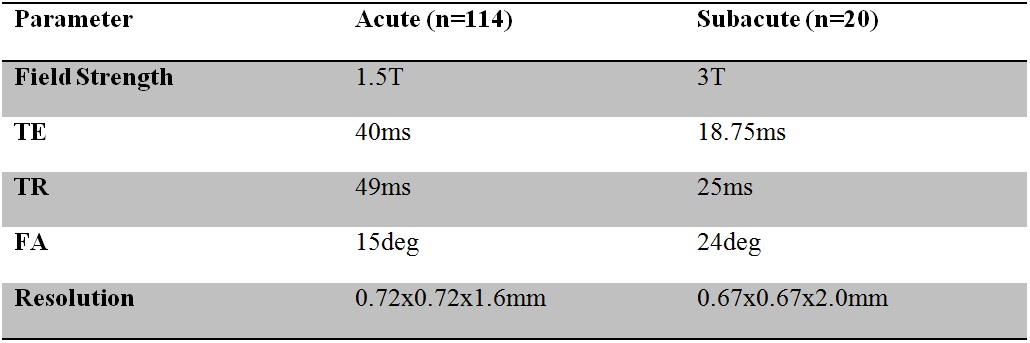
We prepared 134 single echo data sets for training and validation, with a mixture of acute and subacute stroke as detailed in table 1. Pre-processing was performed on the magnitude images using the N4 algorithm to remove the bias-field. This data was then rigidly registered to the MNI-152 template in order to extract the locations of CMBs. The phase images were processed with a homodyne high-pass filter to remove the background field. Susceptibility weighted images were generated by multiplying the susceptibility weighting masks four times into the magnitude images. To generate QSM, we first unwrapped the phase images using a Laplacian algorithm, and then applied the SHARP algorithm to reduce remnant background field. QSM data were generated using a truncated k-space division algorithm. Next, all the images were interpolated to 0.5mm isotropic resolution. The intensity range for all images was normalized to [-1, 1]. Initial predictions were obtained using our published deep learning model5. These predictions were reviewed by two SWI data processors (with 5 and 10 years of CMB detection experience) and one radiologist. The gold standard was established based on the consensus of all three raters. Deep learning models using phase and SWI images as input were trained in keras 2.3.0, with Tensorflow 1.14.0 as the backend. The details of the training procedures can be found in Liu et al. 20195. We fine tuned the learning rate to 0.003, and weight decay to 0.002. The training was performed twice, and four models were saved, based on their AUCs on the validation data. For evaluating the model’s performance, we used the area under the ROC curve (AUC), average precision, and accuracy (with a probability threshold 0.5).Results
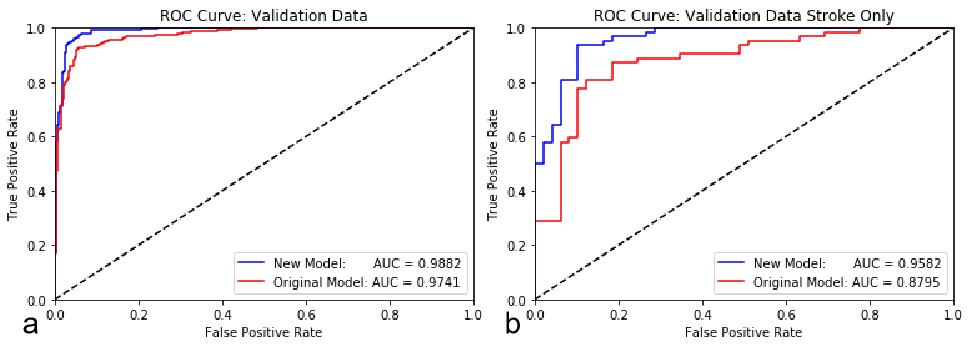
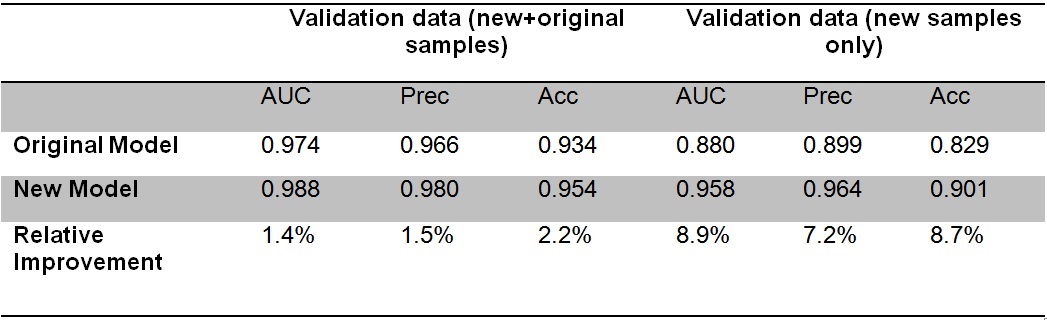
We improved the performance of our model by retraining it using additional stroke data, which included many false positives previously. Combined with our original cases, there were 3543 samples (with 1603 CMBs) in the training set and 591 samples (255 CMBs) in the validation set. The performance of the original model on the newly prepared training and validation data was used as the baseline. Our existing model did not perform well on stroke data previously, and this was replicated with the data used in this work. Using the stroke validation data, the new model increased these measures another 7 to 9% above the original model to 96%, 96% and 90%, respectively (see Table 2 and Figure 1). We also tested the new model on the previous data in order to eliminate the possibility of overfitting the model to our current stroke cases. The new model improved the three performance measures by 1 to 3% on all the data combined (see Table 2), proving that versatility of the model was not lost from adding the new cases to the training.Discussion
We successfully retrained a deep learning model in order to increase accuracy and precision when automatically detecting CMBs in stroke. This two step model performed well both in our new data (stroke only) and in our previous cohort, which includes multiple etiologies. Stroke subjects often have prominent cortical veins pronounced in SWI data. When captured traveling through an axial slice, those veins may produce false results in many automatic CMB detection techniques due to their similar properties. Furthermore, stroke subjects might have other structural findings in the form of vein damage, reperfusion injury, or hemorrhages. Since those scenarios can be unique to stroke, the model performs poorly on stroke data when trained using data with mostly other etiologies. Retraining using stroke data with proved fruitful, as we improved all of our performance metrics in our validation. We were able to use the existing model to make predictions on the new data, which expedited the labeling process.Conclusion
In conclusion, retraining this already powerful pipeline improved its performance on stroke data by eliminating false positives caused by etiology specific scenarios. This brings automatic CMB detection one step closer to being a viable option as a real time processing in acute stroke.Acknowledgements
Dr. Luo Yu
Shanghai Fourth Province People Hospital
Shanghai, China
Dr. Shuang Xia
Tianjin First Center Hospital
Tianjin, China
References
1- Greenberg, S.M., Vernooij, M.W., Cordonnier, C., Viswanathan, A., Al-Shahi Salman, R.,Warach, S., et al., 2009. Cerebral microbleeds: a guide to detection andinterpretation. Lancet Neurol. 8 (2), 165–174.
2- Yates, P.A., Villemagne, V.L., Ellis, K.A., Desmond, P.M., Masters, C.L., Rowe, C.C., 2014.Cerebral microbleeds: a review of clinical, genetic, and neuroimaging associations.Front. Neurol. 4, 205.
3- Fan, Yu Hua, Zhang, Lei, Lam Wynnie, W.M., Mok Vincent, C.T., Wong, Ka Sing, 2003.Cerebral microbleeds as a risk factor for subsequent intracerebral hemorrhagesamong patients with acute ischemic stroke. Stroke 34 (10), 2459–2462.
4- Poels, M.M.F., Ikram, M.A., van der Lugt, A., Hofman, A., Niessen, W.J., Krestin, G.P.,et al., 2012. Cerebral microbleeds are associated with worse cognitive function: theRotterdam Scan Study. Neurology 78 (5), 326–333.
5- Liu, S., Utriainen, D., Chai, C., Chen, Y., Wang L., Sethi, S. K., Xia, S., Haacke, E. M., 2019. Cerebral microbleed detection using Susceptibility Weighted Imaging and deep learning. Neuroimage 198, 271–282.
Figures