3554
Segmentation of Contrast Enhancing Brain Tumor Region using a Machine Learning Framework based upon Pre and Post contrast MR Images
Neha Vats1, Virendra Kumar Yadav1, Manish Awasthi1, Dinil Sasi1, Mamta Gupta2, Rakesh Kumar Gupta2, and Anup Singh1,3
1Centre for Biomedical Engineering, Indian Institute of Technology, Delhi, New Delhi, India, 2Department of Radiology, Fortis Memorial Research Institute, Gurugram, India, 3Biomedical Engineering, AIIMS, New Delhi, India
1Centre for Biomedical Engineering, Indian Institute of Technology, Delhi, New Delhi, India, 2Department of Radiology, Fortis Memorial Research Institute, Gurugram, India, 3Biomedical Engineering, AIIMS, New Delhi, India
Synopsis
Segmentation of contrast enhancing tumor region from post-contrast T1-W MR images is sometime difficult due to low enhancement or presence of infarct tissue around or inside tumor, which exhibits similar intensity as contrast enhancement. Relative difference map obtained from pre-and post-contrast T1-weighted images can increase sensitivity to enhancement visualization as well as clearly differentiate infarct tissue from enhancing lesion. The objective of the current study was to evaluate accuracy of segmentation of contrast enhancing lesion using Support Vector Machine (SVM) classifier developed on relative difference map intensities. Optimized SVM classifier enabled accurate segmentation of contrast enhancing tumor lesion.
Introduction
Accurate delineation of brain tumor is important for diagnosis and treatment planning by the radiologist. Magnetic Resonance Imaging(MRI) is a widely used medical imaging technique for diagnosis of brain tumor. On contrast-enhanced T1-weighted(W) MR images, tumor area where Blood-Brain Barrier breaks show enhancement and it is an indication of an aggressive type of tumor. It is necessary to segment the active or aggressive tumor region for better diagnosis and surgical planning. Various manual, automatic and semi-automatic segmentation techniques are reported in literature for brain tumor segmentation1,2,3,4. Manual delineation of tumor region is a time-consuming process and radiologist dependent thus leads to intra and inter variability in segmentation results5. So, there is a need to automate the process of brain tumor segmentation. The current study aimed to develop Support Vector Machine(SVM) classifier based semi-automatic segmentation of contrast-enhanced(CE) brain tumor region. We hypothesize that for SVM based CE tumor region segmentation, the relative percentage image obtained from T1-W pre and post-contrast MR data provides better accuracy as compared to conventional post-contrast T1-W images.Method
In this IRB-approved retrospective study, MRI data of 20 brain tumor patients(4 Grade II, 8 Grade III and 8 Grade IV patients) have been acquired at a local hospital on 3T whole-body MRI (Ingenia, Philips Healthcare, The Netherlands). The MRI protocol for this study includes conventional T1-W, post-contrast T1-W and Dynamic Contrast-Enhanced(DCE) T1-W MR images. The MRI protocol parameters are shown in Table 1. Pre-processing(Noise Removal, Skull Stripping and Registration) of post-contrast T1-W and DCE MRI data was done. Conventional post-contrast T1-W MR images were normalized between 0-255. Relative percentage image(RPI) was calculated by taking the difference of average of last 4 time-point(Spre) from the average of first 4 time-point images(Spost) of DCE MRI data and further dividing it by Spre. The obtained relative image was normalized between 0-255 and named as RPI. CE tumor region mask was manually segmented by MTech student and validated by experienced Radiologist(>25 years of MR imaging experience). SVM classifier was trained on the manually segmented mask for CE region on both RPI and post-contrast T1-W images separately for 15 patient datasets(3 Grade II, 6 Grade III and 6 Grade IV patients). SVM classifier was implemented using MATLAB 2018b and optimized with respect to its hyperparameters(c for linear kernel; c and gamma for Radial Basis Function (RBF) kernel) based upon 10-fold cross-validation. Trained SVM classifier was tested on additional 5 brain tumor patients(1 Grade II, 2 Grade III and 2 Grade IV) for segmentation of accurate CE tumor region. Rather than using an entire image for training/testing, a local region-of-interest(ROI) around tumor region in slice containing maximum enhancing tumor lesion was selected and further processing was carried out only within this ROI. This manual ROI was drawn on a single central tumor slice of the patient and multiplied with all the slices to get the total volume of the CE tumor. The RPI intensity values and post-contrast T1-W image intensity values of the ROI region are used as feature set for training SVM classifier separately to segment CE tumor region.Results and Discussion
Figure 1 shows the curve of the training and validation error at different c values obtained while training a linear SVM classifier. The graph shows that the least validation error(1.078%) is obtained at c = 0.1 for RPI. In the case of post-contrast T1-W image-based SVM training, the least validation error of 23% is obtained at c = 0.001. Test error of SVM classifier at best c value was 3.26% in case of RPI and 25% in case of post-contrast T1-W image. Figure 2 shows the semi-automatic SVM based CE tumor region segmentation results using RPI for 3 tumor patients, one from each grade. The SVM based segmentation using post-contrast T1-W image have high error as compared to RPI based SVM segmentation due to mixture of several tissue signals in a single voxel in post-contrast T1-W image causing partial volume effect. Also, Enhancing tumor area on post-contrast T1-W image may represent false-enhancing non-tumor component that may be an infarct. The segmentation results using post-contrast T1-W image include these enhancing non-tumor components also if present but the proposed approach using RPI removes these components from enhancing tumor region as shown in Figure3. Figure4 shows the signal intensity time curve for the enhancing tumor region and the infarct region. The current approach needs slight modification for the removal of blood vessels which might be present in the tumor region. The current study validates that the proposed SVM based semi-automatic segmentation approach can be used to segment CE tumor region using RPI. However, the study needs to be validated on more number of datasets and further modification in the proposed approach needs to be done.Conclusion
SVM based upon RPI intensities provided accurate segmentation of CE tumor compared to conventional post-contrast T1-W based SVM classifier. The proposed method accurately removed infarct region from segmented CE tumor region, which is a challenge in post-contrast T1-W images. The proposed approach require selection of a local region-of-interest around tumor region in a single slice containing largest tumor area. This ROI approach reduced processing time and improved accuracy.Acknowledgements
This work was supported by Indian Institute of Technology, Delhi and Fortis Memorial Research Institute, Gurugram. The authors thank Dr. Anirban Sengupta and Dr Sumeet Agarwal for discussion on machine learning.References
- Bakas S, Reyes M, Jakab A, et al. Identifying the Best Machine Learning Algorithms for Brain Tumor Segmentation, Progression Assessment, and Overall Survival Prediction in the BRATS Challenge. 2018. http://arxiv.org/abs/1811.02629.
- Wang G, Li W, Ourselin S, Vercauteren T. Automatic brain tumor segmentation using cascaded anisotropic convolutional neural networks. Lect Notes Comput Sci (including Subser Lect Notes Artif Intell Lect Notes Bioinformatics). 2018;10670 LNCS:178-190. doi:10.1007/978-3-319-75238-9_16
- Gordillo N, Montseny E, Sobrevilla P. State of the art survey on MRI brain tumor segmentation. Magn Reson Imaging. 2013;31(8):1426-1438. doi:10.1016/j.mri.2013.05.002
- Artzi M, Blumenthal DT, Bokstein F, et al. Classification of tumor area using combined DCE and DSC MRI in patients with glioblastoma. J Neurooncol. 2015;121(2):349-357. doi:10.1007/s11060-014-1639-3
- Heye Tobias; Merkle EM, Reiner CS, Davenport MS, et al. Reproducibility of Dynamic Part II . Comparison of Intra- and Interobserver Variability with Manual Region of Interest Placement versus. Radiology. 2013;266(3):812-821.
Figures
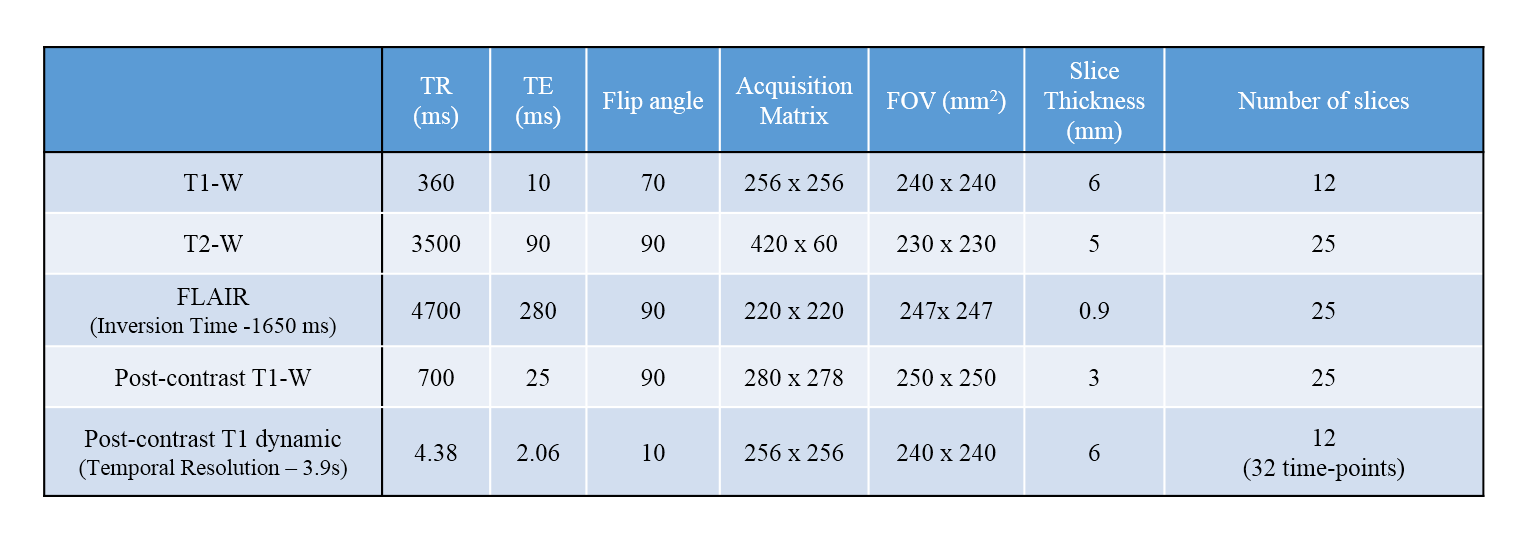
Table
1: Table
represents the MRI protocol parameters used in the current study. At
the fourth time
point of
the 3D-DCE-MRI data acquisition, 0.1 mmol/kg bodyweight of GD-BOPTA
(gadobenate dimeglumine) was
administered intravenously at a rate of 3.0 ml/sec.
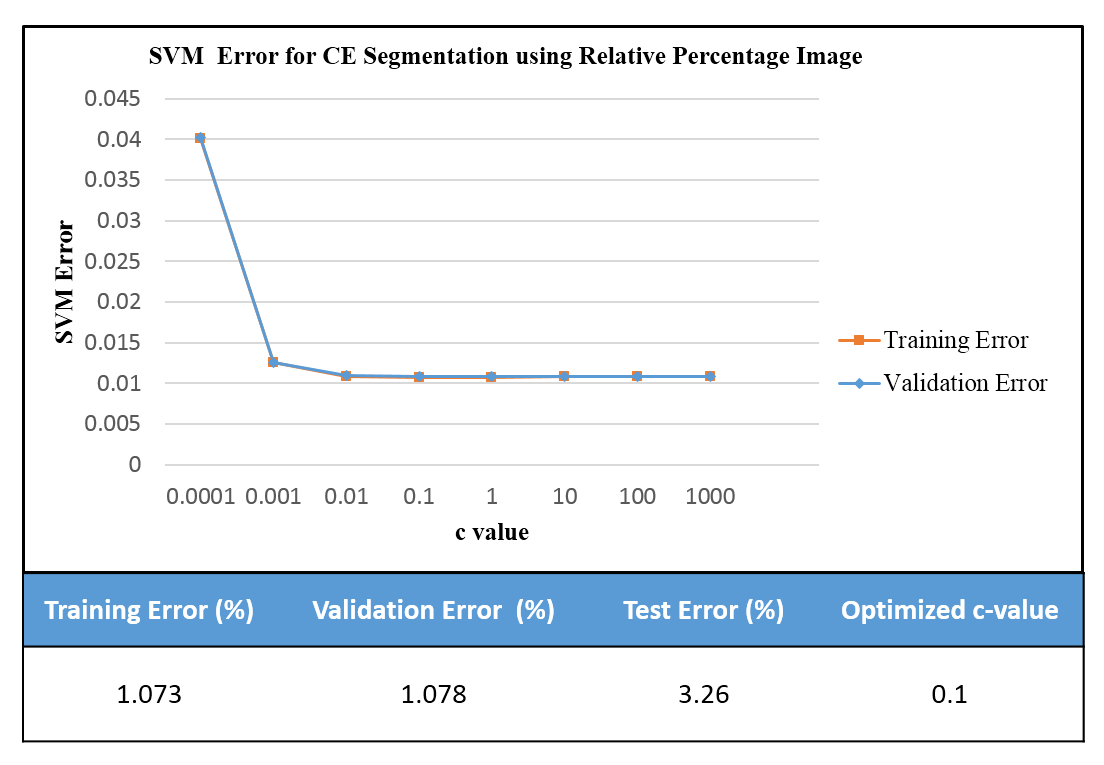
Figure
1: Figure
represents the curve for Support
Vector Machine (SVM)
training and validation error based upon 10-fold cross validation for
segmentation of Contrast Enhanced (CE) Tumor Region from Relative percent
image. The training, validation and testing error at optimized c-value are
shown underneath.
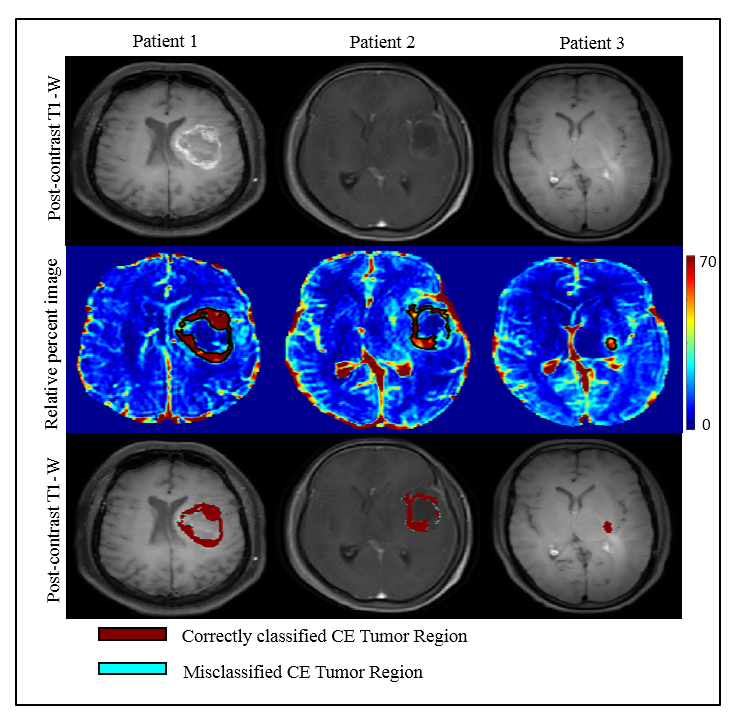
Figure
2: Row1
shows the post-contrast T1-W image from 3 patients (Patient1
–Grade IV; Patient 2
- Grade
III; Patient 3- Grade II).
Row2 shows
the SVM segmented CE
Tumor Region
contoured over Relative percent
image. Row3 represents
the correctly classified and misclassified CE
tumor region
overlaid
on
post-contrast T1-W image
for three patients, one from each grade. CE – Contrast Enhancing.
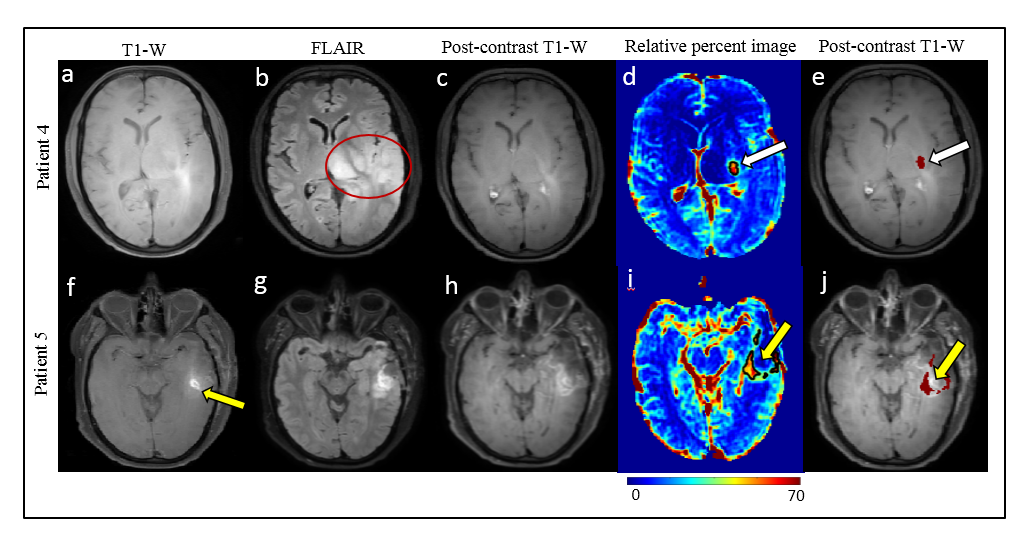
Figure 3:
Row1
shows GradeII patient
where Flair(b) show abnormal
tumor(red
contour)
but CE
is not
visible on
post-contrast
T1-W(c).
However,
RPI(d)
detects enhancement(white
arrow). SVM
segmented CE
is
shown by black contour on RPI(d) and
overlaid by red color on post-contrast T1-W(e).
Row2 shows post-surgery patient
with recurrence
of CE
and infarct
can also be seen on pre-contrast
T1-W(yellow arrow(f)).
The segmentation results of SVM(i,j) show
correct classification
of CE
from normal
brain tissue and infarct also.
RPI –Relative Percent Image, CE-Contrast Enhancement.
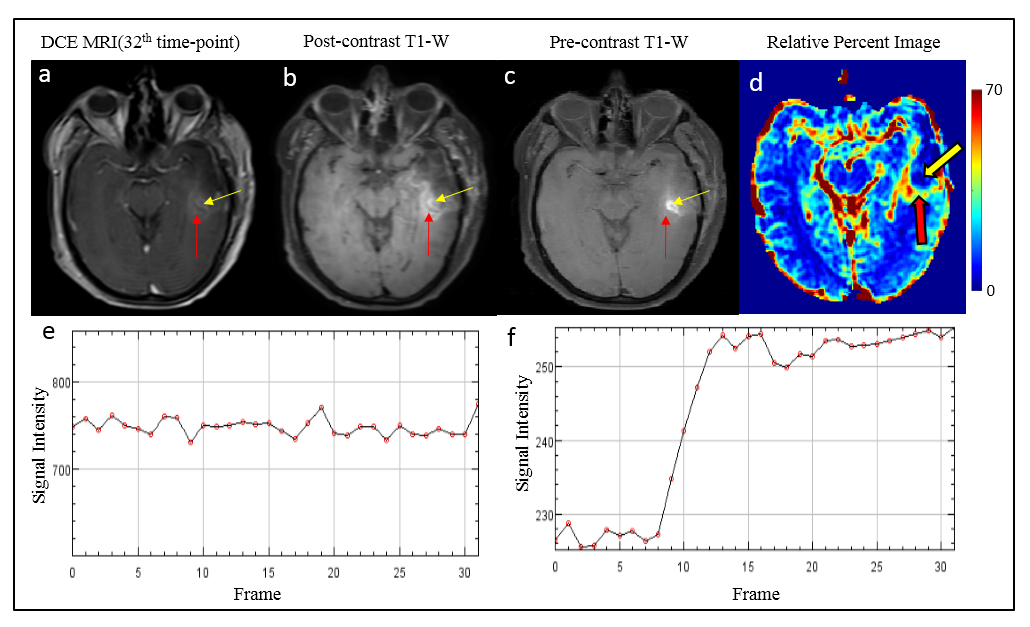
Figure
4: Figure
4 (a,b,c,d)
shows the DCE MR image at 32th time-point, Post-contrast T1-W image, Pre-contrast T1-W image and
relative percent image respectively. Yellow arrow represents the infarct region
and red arrow represents the CE tumor region. Figure 4 (e,f)
represents the signal intensity time curve for infarct region and CE tumor
region respectively. CE
- Contrast
Enhancing,
DCE MRI - Dynamic contrast Enhanced MRI.