3550
PET Image Denoising Using Structural MRI with a Dilated Convolutional Neural Network1Biomedical Engineering, Stony Brook University, Stony Brook, NY, United States, 2Psychiatry, Stony Brook University, Stony Brook, NY, United States, 3Radiology, Stony Brook University, Stony Brook, NY, United States
Synopsis
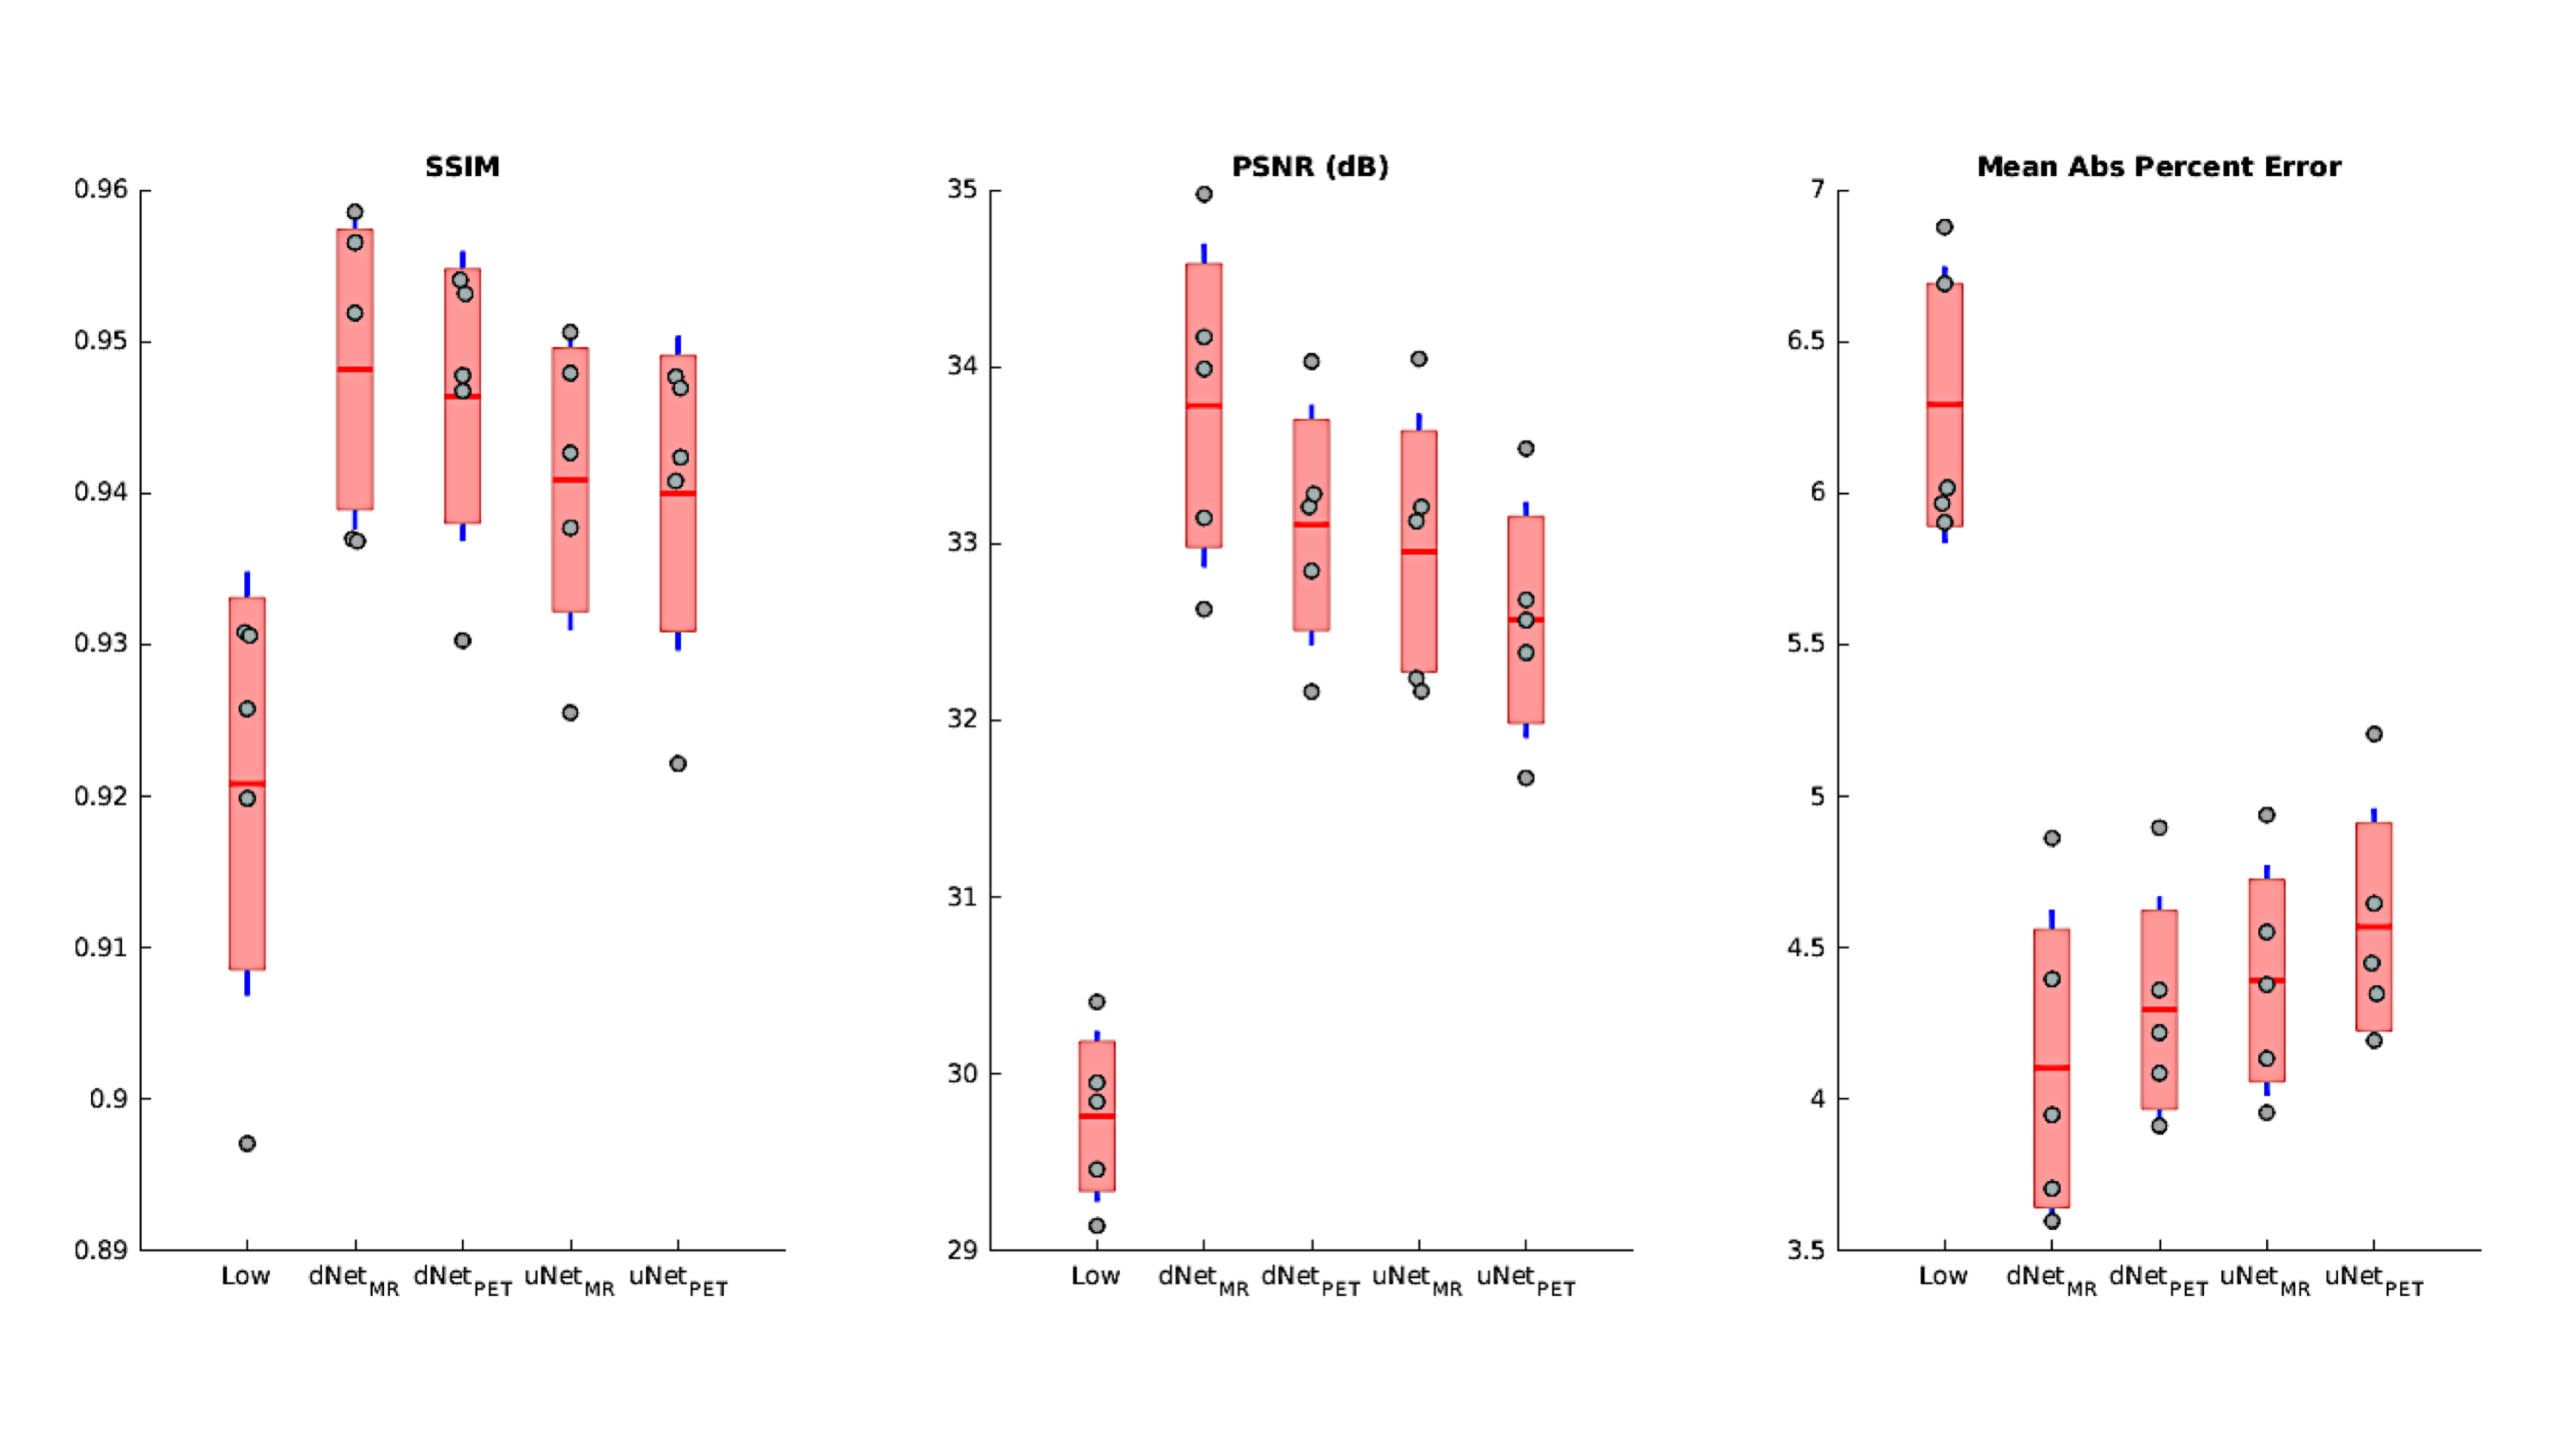
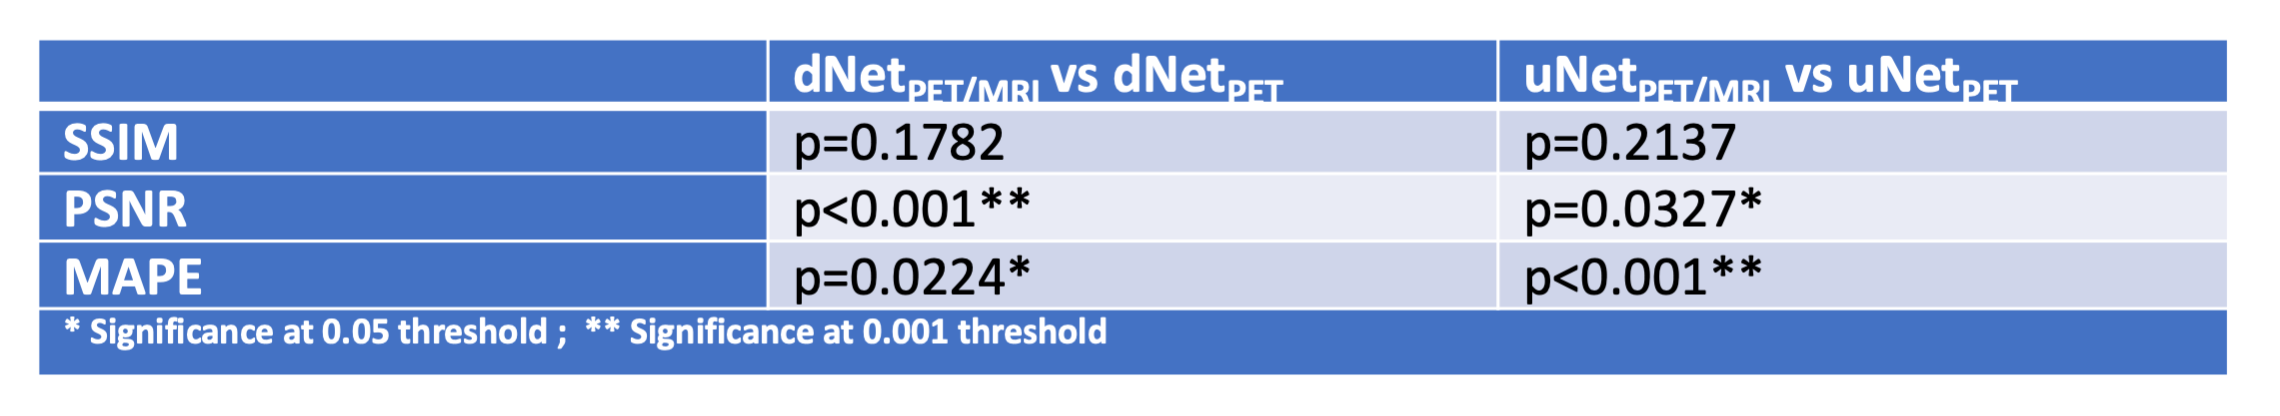
We developed a new PET denoising model by utilizing a dilated CNN (dNet) architecture with PET/MRI inputs (dNetPET/MRI) and compared it to three other deep learning models with objective imaging metrics Structural Similarity index (SSIM), Peak signal-to-noise ratio (PSNR) and mean absolute percent error (MAPE). The dNetPET/MRI performed the best across all metrics and performed significantly better than uNetPET/MRI (pSSIM=0.0218, pPSNR=0.0034, pMAPE=0.0305). Also, dNetPET performed significantly better than uNetPET (p<0.001 for all metrics). Trend-level improvements were found across all objective metrics in networks using PET/MRI compared to PET only inputs within similar networks (dNetPET/MRI vs. dNetPET and uNetPET/MRI vs. uNetPET).
Introduction
In Positron Emission Tomography (PET), reducing counts while maintaining image quality is a task needed to be optimized. Previous developments of deep learning techniques to denoise PET images have utilized well-known uNet architecture1, 2; wherein more complex networks, such as GAN and cycle-consistent GAN, work with uNet-like architectures as their generators3, 4. Previous works have also shown that incorporating structural MRI as an input improves performance5; this allows for the network to preserve edges in the PET network output. Despite this success, the field is in its infancy and work to further optimize architectures needs to be exploited.We have recently introduced the dilated CNN (dNet) for PET denoising and demonstrated that it allows for better edge preservation and improved objective image quality measures such as peak signal-to-noise ratio (PSNR), structural similarity index (SSIM) and mean absolute percent error (MAPE)6. In this study, we develop a new PET denoising model by utilizing the dNet architecture with both PET and MRI inputs (dNetPET/MRI) and compare it to three other deep learning models.
Methods
dNet combines the skip connections similar to uNet but with the notion of a dilated convolution7. Figure 1 shows the dilated convolution kernels used in dNet. We developed dNetPET/MRI to estimate full-count as the output and compared it to three other models: dNet with PET only, uNet with PET/MRI and uNet with PET only inputs (dNetPET, uNetPET/MRI, uNetPET, respectively). Comparison of these models was evaluated through objective imaging metrics PSNR, SSIM and MAPE. Residual learning was included into all networks. A total of 35 18F-FDG brain PET/MRI studies, with 8,400 total slices, were acquired and split into training (n=7,200 slices) and testing (n=1,200 slices). Each subject was administered between 148-185 MBq (4-5mCi) of 18F-FDG. Listmode data was collected for 60 minutes after the injection of 18F-FDG on a Siemens Biograph mMR PET/MRI scanner. Low-count PET data (10% count) were generated through Poisson thinning from the full listmode file. PET images were reconstructed using Siemens’ E7tools with ordered subset expectation maximization (OSEM). MPRAGE images were used alongside reconstructed low-count PET as inputs to the PET/MRI networks.Results
All four networks were successfully trained to synthesize full-count from low-count PET images. Figure 2 shows SSIM, PSNR and MAPE values for the independent testing set evaluated on the four networks compared to low-count. The dNetPET/MRI performed the best across all metrics and performed significantly better than uNetPET/MRI (pSSIM=0.0218, pPSNR=0.0034 , pMAPE= 0.0305). Also, dNetPET performed significantly better than uNetPET (p<0.001 for all metrics). Trend-level improvements were found across all objective metrics in networks using PET/MRI compared to PET only inputs within similar networks (dNetPET/MRI vs. dNetPET and uNetPET/MRI vs. uNetPET); with PET/MRI networks significantly outperforming PET only networks in PSNR and MAPE (Table 1).Discussion
We have developed the dNet architecture with structural MRI as additional input for low-count PET denoising and compared it to the well-established uNet. Besides the proposed network, we constructed dNetPET, uNetPET/MRI, and uNetPET. Across all objective metrics, dNetPET/MRI outperformed all of the other networks. Both dNet architectures (with or without MRI inputs) also significantly outperformed their uNet counterparts, indicating that they are superior for denoising. Typically, uNet architectures down-sample and up-sample feature maps as they are fed into the network, which degrades resolution and fine details. Notably, uNet processing introduces some degree of blurring from two primary sources. The first source is the mathematical nature of the convolution. Secondly, is the common practice of downsampling and subsequently re-upsampling feature maps as they pass through the network. Dilated kernels are a method to oppose this blurring effect. Our dNet, with an expanding field of view, avoids the downsampling and, subsequent, upsampling schemes that degrade images to preserve resolution.Conclusion
This is the first work to use dNet architecture for low-count PET denoising with structural MRI as additional input. This network has shown to outperform uNet across various objective imaging metrics. Although various other methods have been introduced recently for low-count PET denoising, such as GAN, cycle-consistent GAN, etc., they typically all use generators that have uNet-like architectures. Combining these novel GAN’s with the expanding field of view that dilated kernels allows may improve upon previously acquired results – further improving the field of PET/MR denoising.Acknowledgements
No acknowledgement found.References
1. L. Xiang, Y. Qiao, D. Nie, L. An, W. Lin, Q. Wang and D. Shen, Neurocomputing 267, 406-416 (2017).
2. J. Xu, E. Gong, J. Pauly and G. J. a. p. a. Zaharchuk, (2017).
3. Y. Lei, X. Dong, T. Wang, K. Higgins, T. Liu, W. J. Curran, H. Mao, J. A. Nye and X. Yang, Physics in Medicine & Biology (2019).
4. W. Lu, J. A. Onofrey, Y. Lu, L. Shi, T. Ma, Y. Liu and C. Liu, Physics in Medicine & Biology 64 (16), 165019 (2019).
5. K. T. Chen, E. Gong, F. B. d. C. Macruz, J. Xu, A. Boumis, M. Khalighi, K. L. Poston, S. J. Sha, M. D. Greicius, E. Mormino, J. M. Pauly, S. Srinivas and G. Zaharchuk, Radiology 290 (3), 649-656 (2019).
6. K. Spuhler, M. Serrano-Sosa, R. Cattell, C. DeLorenzo and C. Huang, arXiv preprint arXiv:1910.11865 (2019).
7. L.-C. Chen, G. Papandreou, F. Schroff and H. Adam, arXiv preprint arXiv:1706.05587 (2017).
Figures