3549
Predicting T2 Maps from Morphological OAI Images with an ROI-Focused GAN
Bragi Sveinsson1,2, Akshay Chaudhari3, Bo Zhu1,2, Neha Koonjoo1,2, and Matthew Rosen1,2
1Massachusetts General Hospital, Boston, MA, United States, 2Harvard Medical School, Boston, MA, United States, 3Stanford University, Stanford, CA, United States
1Massachusetts General Hospital, Boston, MA, United States, 2Harvard Medical School, Boston, MA, United States, 3Stanford University, Stanford, CA, United States
Synopsis
The osteoarthritis initiative (OAI) performed several morphological MRI scans on both knees of a large patient cohort, but only acquired T2 maps in the right knee of most patients. We train a conditional GAN to use the morphological scans acquired in both knees to predict the T2 map, using the acquired T2 map in the right knee as a training target. Post-training, we apply the network to predict T2 values in the left knee, without an acquired T2 map.
Introduction
In a magnetic resonance imaging (MRI) exam, several MRI sequences are often applied to the same anatomy, resulting in various image contrasts and scan planes, with each sequence taking several minutes. To fit within the allotted exam time, sequences are sometimes omitted from the scan protocol. For example, in the Osteoarthritis Initiative (OAI) MESE T2 maps (12 minutes) were only acquired in the right knee to save time, while morphological scans were acquired in both knees1. Here, we train a conditional GAN to predict a T2 map based on morphological scans, using OAI data from the right knee. The trained network is then used to predict T2 maps in the left knee femoral cartilage, not acquired in the protocol.Methods
We collected data from approximately 4,600 OAI subjects. The subjects were split into training, validation, and testing data with the proportions 80%, 10%, and 10%, respectively. The sequences used in the right knee consisted of sagittal double-echo in steady-state (DESS), fat-suppressed sagittal turbo-spin echo (TSE), and coronal TSE without fat suppression. Additionally, a sagittal multi-echo spin-echo (MESE) sequence, collected in the right knee, was used to produce a T2 map. The morphological scans were resampled to align voxel-by-voxel with the T2 map slices in each patient (Figure 1). This resulted in over 500,000 slices in total.The morphological scans were then used as separate channels of input data to a conditional GAN structure2, inspired by the Pix2Pix approach3. A U-Net4 generator produced a T2 map, which was subsequently input to a patch-based discriminator3. Discriminator performance, combined with an L1 penalty, was used to calculate a loss for the generator. To further focus the network on the femoral articular cartilage region, a mask covering that area was produced with a different, previously developed, neural network5 and used as an additional input (Figure 1). The mask was then used to produce an additional loss for the cartilage area. To achieve this, a separate discriminator was used that only focused on the cartilage mask region, resulting in the combined objective function
$$G = \mathrm{arg} \underset{G}{\operatorname{min}} \underset{D_{whole}}{\operatorname{max}} \underset{D_{mask}}{\operatorname{max}} \mathscr{L}_{cGAN_{whole}}(G, D_{whole} ) + \lambda_1 \mathscr{L}_{L1_{whole}}(G) + \lambda_2 \mathscr{L}_{cGAN_{mask}}(G, D_{mask} ) + \lambda_3 \mathscr{L}_{L1_{mask}}(G)$$
with λ1=25, λ2=3, λ3=75, and “whole” and “mask” representing functions for the whole image and the mask, respectively. The network structure is shown in Figure 2. Training was done using two NVIDIA Pascal-architecture GTX 1080 Ti’s (11 GB GPU RAM each) over 20 epochs with a batch size of 16, resulting in a training time of 30 hours.
Post-training, the network was used to predict T2 maps in both right and left knees of the patients in the test data set (456 subjects). The mean T2 over the whole right knee was computed using MESE data and using the network, and the results for the two methods compared. The neural network (NN) predictions for the right and left knee were plotted and linear regression analysis performed. A more detailed analysis was then performed by examining a slice from 15 randomly selected patients in the test data set and semi-automatically segmenting the cartilage into deep/superficial and anterior/central/posterior regions, resulting in 6 regions per knee. The T2 in each region using the MESE and the neural network were compared.
Results
Sample images are shown in Figure 3, showing the anatomical DESS and predicted T2 in both knees of a subject in the test set, and the ground truth MESE T2 estimate in the right knee. Visually, the images look very similar. Figure 4a shows a Bland-Altman plot comparison of the NN-predicted T2 and the MESE T2 estimate for the right knee for the whole test dataset. On average, the predicted T2 was about 2 ms higher than the MESE T2. Linear regression analysis on the data in Figure 4b did not indicate correlation between the estimates in the right and left knee (R2 = 0.00094). Figure 5 shows the results for the laminar regional analysis of the 15 randomly chosen subjects in the test dataset. The two methods generally agree well, with little bias.Discussion
The results indicate that a neural network can be trained to predict a T2 map from acquired anatomical data. Figures 4-5 show the NN-predicted T2 to track the MESE T2 quite well, although with a slight bias. We have, for the first time to our knowledge, generated T2 maps in the left knees of OAI subjects, reducing the need for the 12-minute MESE T2 mapping scan. The results did not indicate these to be correlated to the predicted values in the right knee. Future work will examine using fewer inputs to the network (for example, forgoing the coronal TSE scan). These results could lead to shorter scan protocols to the benefit of patients, researchers, clinicians, and medical payers.Conclusion
A neural network architecture with cGANs and a separate loss function for the cartilage region can be used to synthesize T2 values in femoral cartilage without a T2-mapping scan.Acknowledgements
DARPA 2016D006054References
1. Peterfy et al. The osteoarthritis initiative: report on the design rationale for the magnetic resonance imaging protocol for the knee. Osteoarthritis and Cartilage, 2008; 16: 1433-1441. 2. Goodfellow et al. Generative adversarial nets. In Advances in neural information processing systems, 2014: 2672-2680. 3. Isola et al. Image-to-image translation with conditional adversarial networks. arXiv 2017. 4. Ronneberger et al. U-net: Convolutional networks for biomedical image segmentation. In International Conference on Medical image computing and computer-assisted intervention, 2015: 234-241. 5. Desai et al. ad12/DOSMA: v0.0.9: DOSMA (prerelease), 2019. https://doi.org/10.5281/zenodo.2559549Figures
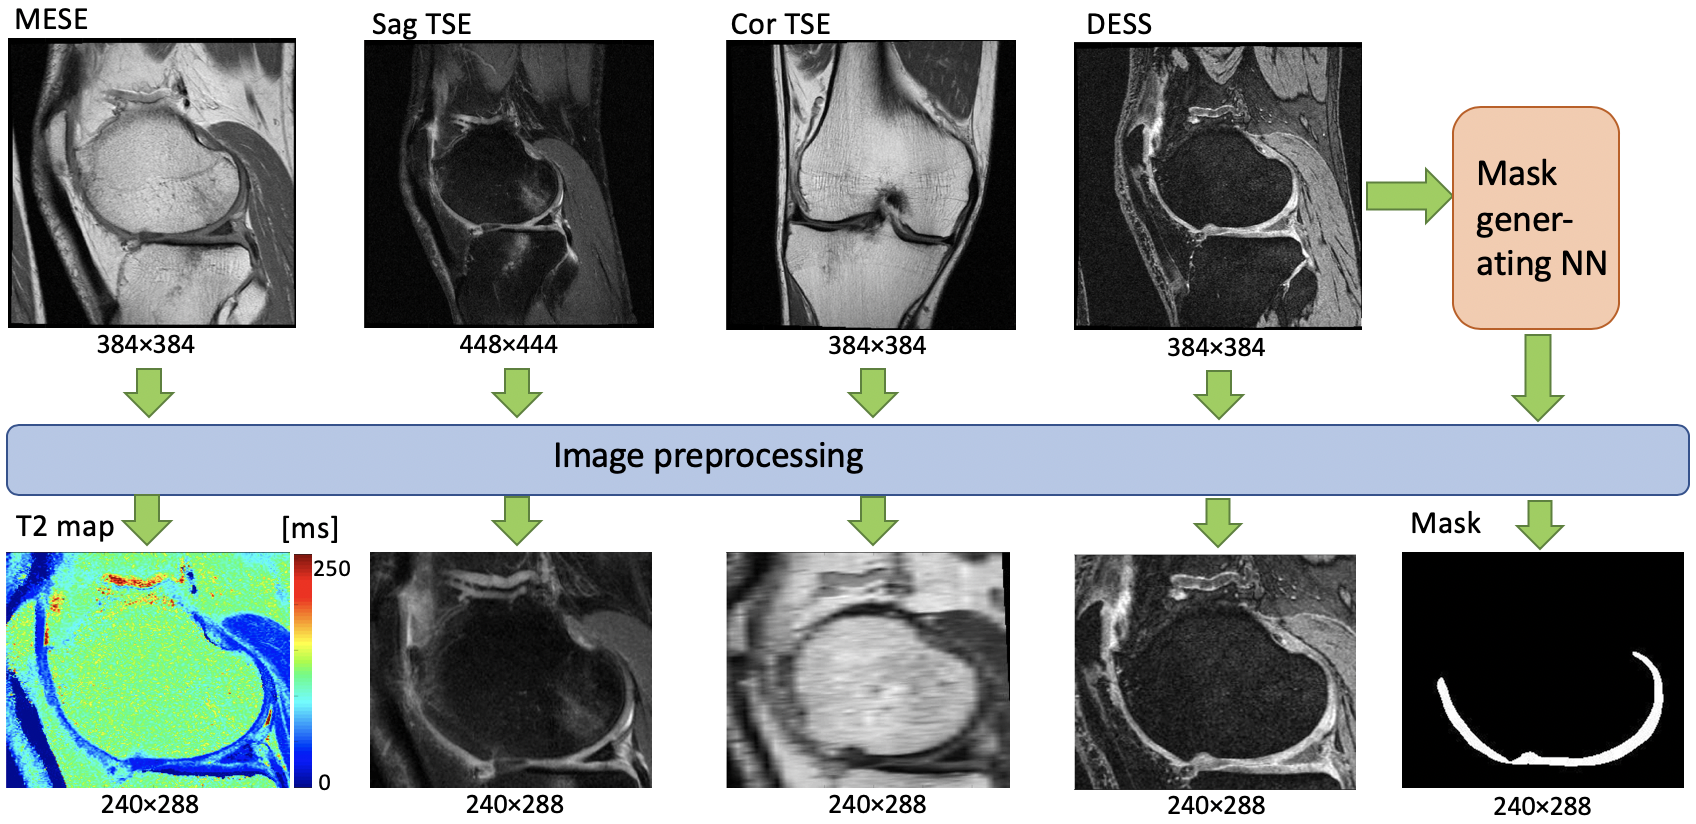
Figure 1: Preprocessing of data before being used as inputs
and reference data for the neural network. A mask is generated by a separate
network to create a heavier loss function for the cartilage region.
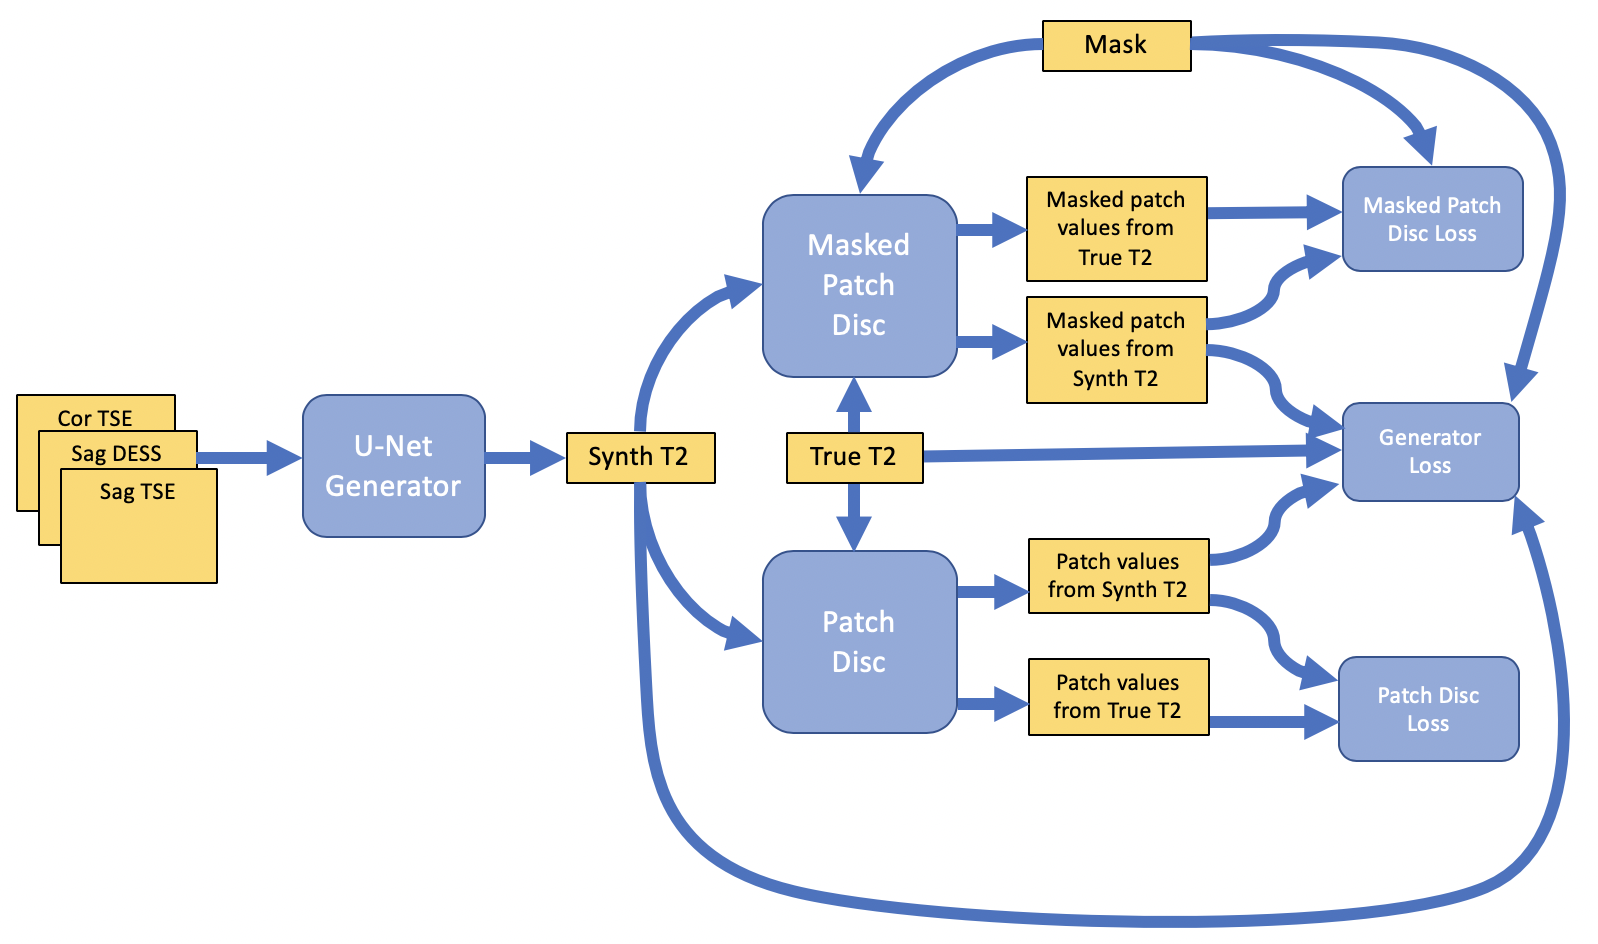
Figure 2: The neural network, consisting of a U-Net
generator and two discriminators, one for whole image and one for the
cartilage.

Figure 3: Sample results showing predicted T2 and
anatomical DESS in the left and right knee of a test set subject, along with
the MESE T2 estimate in the right knee.
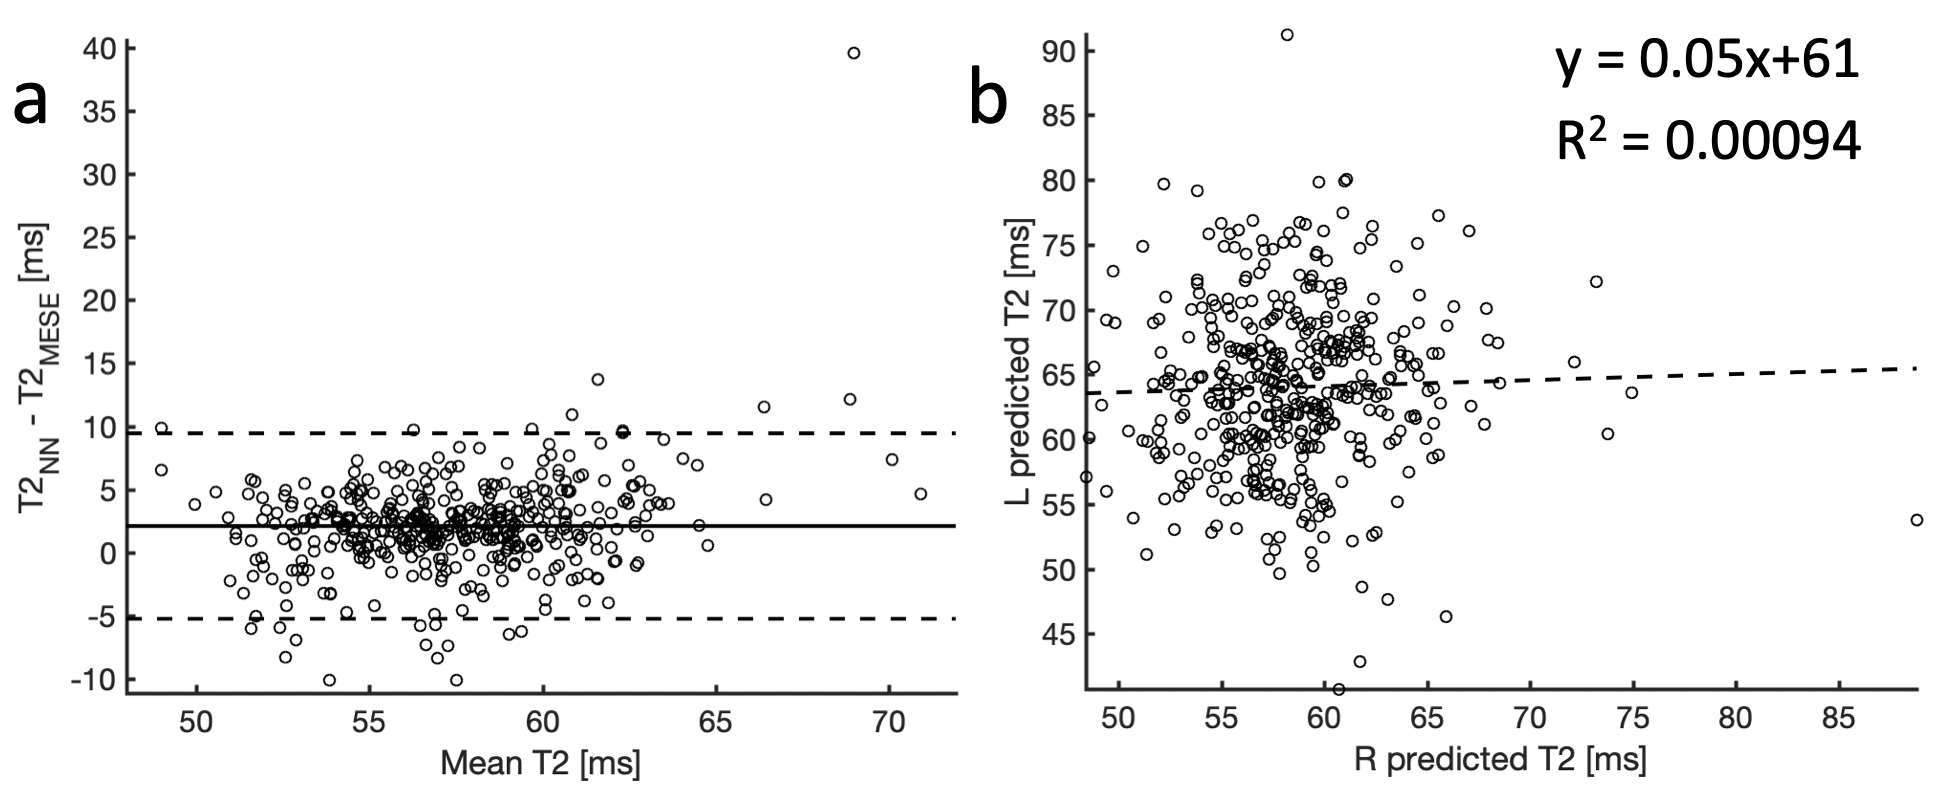
Figure 4: (a) A Bland-Altman plot comparing the T2 from
MESE and from the neural network. The plot shows a slight positive bias of the neural network by about 2ms, and a 95% confidence range (mean ± 1.96 standard deviations, dashed lines) of about
7.5ms. (b) The T2 predictions in the
right and left knee. The results do not indicate correlation between the two predictions (R2 = 0.00094).
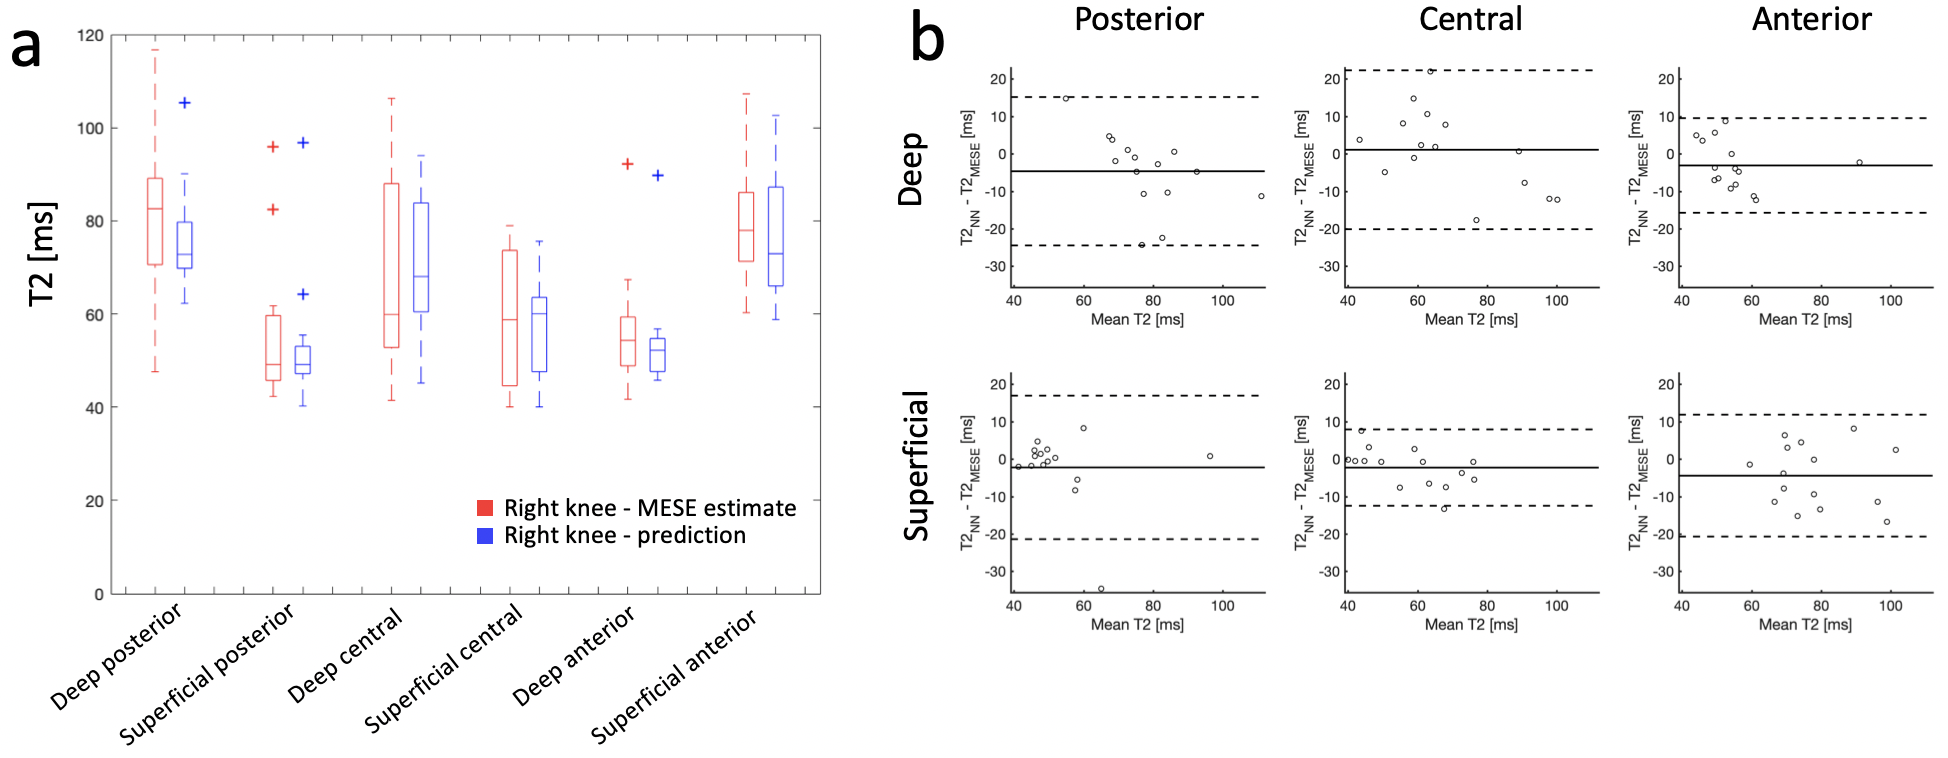
Figure 5: (a) Distributions of mean values of predicted (blue)
and MESE (red) T2 estimates in 6 different regions of femoral cartilage in 15
subjects randomly chosen from the test data set. (b) Bland-Altman plots showing
the difference between the two estimates. The dashed lines show a 95% confidence range (mean ± 1.96 standard deviations). The plots show very small bias for each region, and 2 standard
deviations are generally between 10-20 ms.