3538
Empirically-Trained Image Contrast Synthesis for Intravascular MRI Endoscopy1Department of Electrical and Computer Engineering, Johns Hopkins University, Baltimore, MD, United States, 2MR Research Division, Department of Radiology, Johns Hopkins University, Baltimore, MD, United States
Synopsis
Parameterized image synthesis is desirable for region-specific image contrast and protocol optimization. While this could arguably be performed with quantitative mapping and Bloch equation simulations, it is not well-suited for real-time cine MRI or MRI endoscopy in a real-time interventional application with views changing from frame-to-frame. Here we propose to use empirical data to calibrate signal behavior patterns from a specific MRI endoscopic device and pulse sequences to fit new acquisitions from which extra images and ultimately guide automated local contrast optimization.
Purpose
Intravascular MRI endoscopy uses a micro-MRI transmit/receive coil moving through blood vessels(1–3), with a goal of facilitating the detection and diagnosis of vascular disease or for guiding and monitoring therapy delivery such as the treatment of tumors involved with blood vessels(4,5). Recently the speed of MRI endoscopy was accelerated from ~2 frames-per-second (fps) to ~10fps using highly under-sampled nonlinear reconstruction and graphics processing units to achieve real-time display and feedback(6).During MRI endoscopy from the viewpoint of the coil at the probe-head, the surrounding tissue is ever-varying. A single set of protocol parameters is generally not optimal for all locations or even a specific region-of-interest. Adjusting the parameters on-site is time-consuming, requiring user experience, and knowledge of the MRI physics and properties of the local environment. Protocol parameter-based image synthesis is desirable as a first step towards automatic optimization of image contrast during high-speed acquisitions. Conventionally image synthesis is done by Bloch equation simulation, but this requires additional quantitative mappings that may not account for all contrast mechanisms (the true contrast in MRI endoscopy is a convolution of through-plane signals that reflect the highly nonuniform coil profile and the adiabatic excitation) and takes time that compromises the real-time nature of the signal stream. Here we propose a method that learns the contrast behavior from empirical data as a calibration set for a specific endoscopy coil. This can then be applied to synthesize image contrasts for unacquired parameter sets based on a fit to a few acquired images at updated locations.
Methods
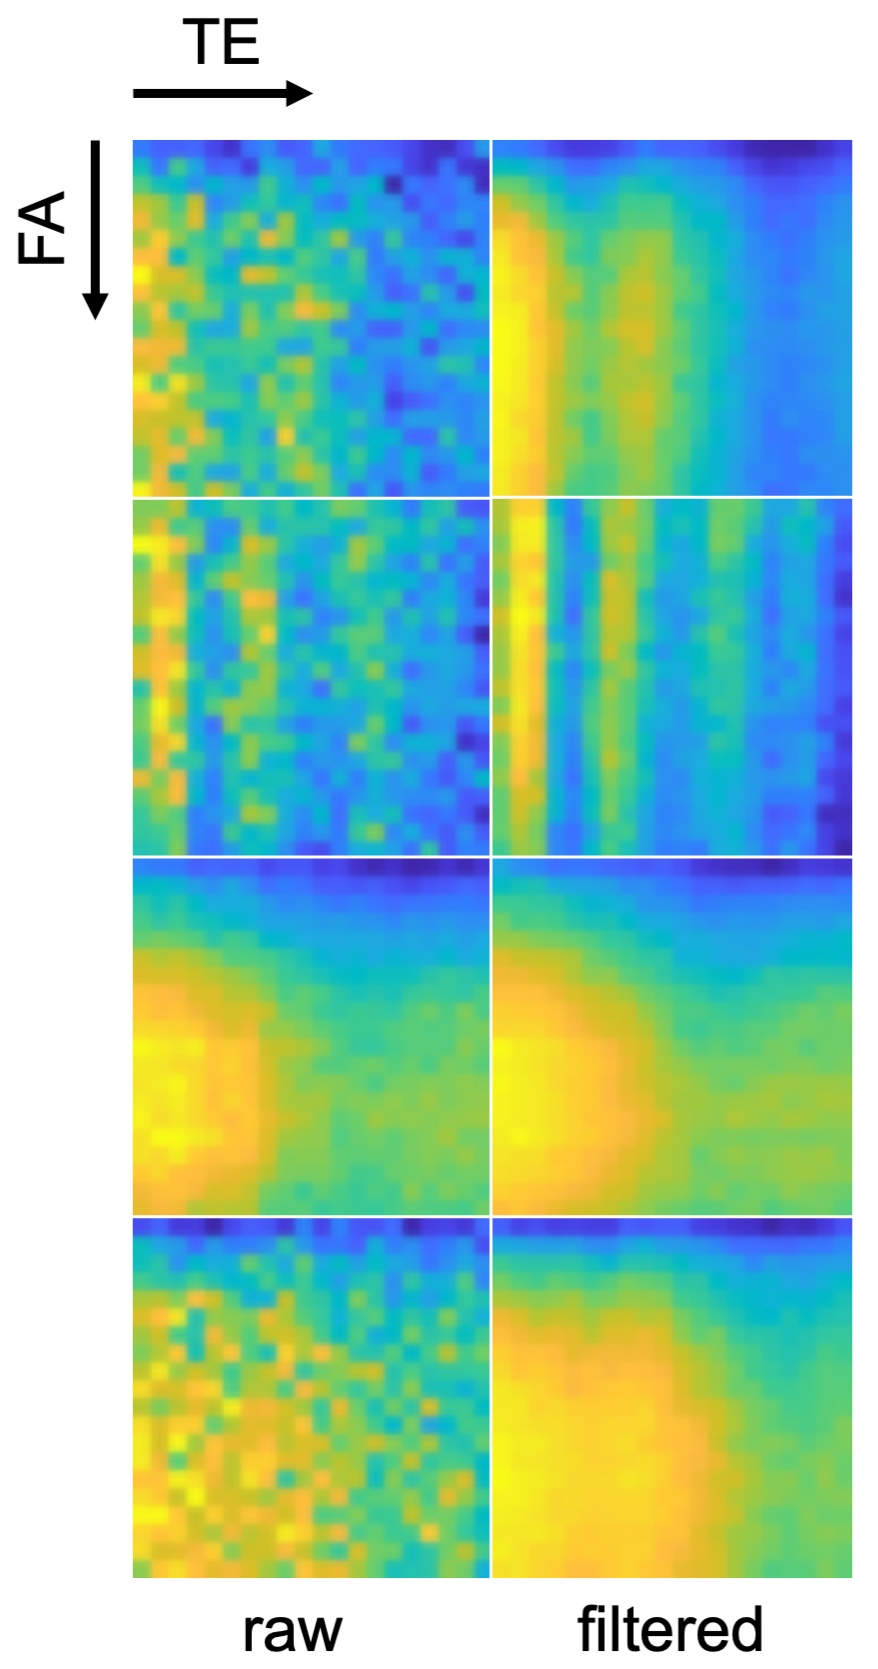
A loop MRI coil catheter fitted to a Siemens clinical 3T Prisma MRI scanner was used to acquire endoscopic images in post-mortem human artery samples acquired from our pathology department. These vessels had atherosclerosis plaques including calcifications. Images with a range of protocol parameters–repetition time, TR; flip angle, FA; echo time, TE–were acquired from different vessels, initially constraining the adjustment dimensions to FA and TE. 400 images were acquired with a FLASH sequence modified for MRI endoscopy by replacing the excitation pulse with an adiabatic ‘BIR-4’ pulse(1,2) (MRI parameter sets: 20 FA x 20 TE, FA=5-100°, TE=5.6-13.2ms, TR=20ms, time of acquisition, TA=3.6s, field of view, FOV=40mm, resolution=200µm) to create a “parameterized image library.” The same procedure was repeated in other vessels for testing.After acquisition, the signals at each pixel location of the endoscopy foreground (91x91 pixels) were extracted to form 8281 signal patterns in FA-TE space. The patterns were used to train a variational autoencoder (VAE) (encoder =2 fully-connected layers; decoder =3 fully-connected layers) with 50 epochs(7). The latent code space dimension of the autoencoder was set to 10 to constrain the propagation of information and force the output to retain only the strong signal patterns, as a denoising step. These signal patterns were treated as a calibration set to use as a basis for synthesizing new endoscopy images that could be used to automatically optimize contrast with minimal new input data.
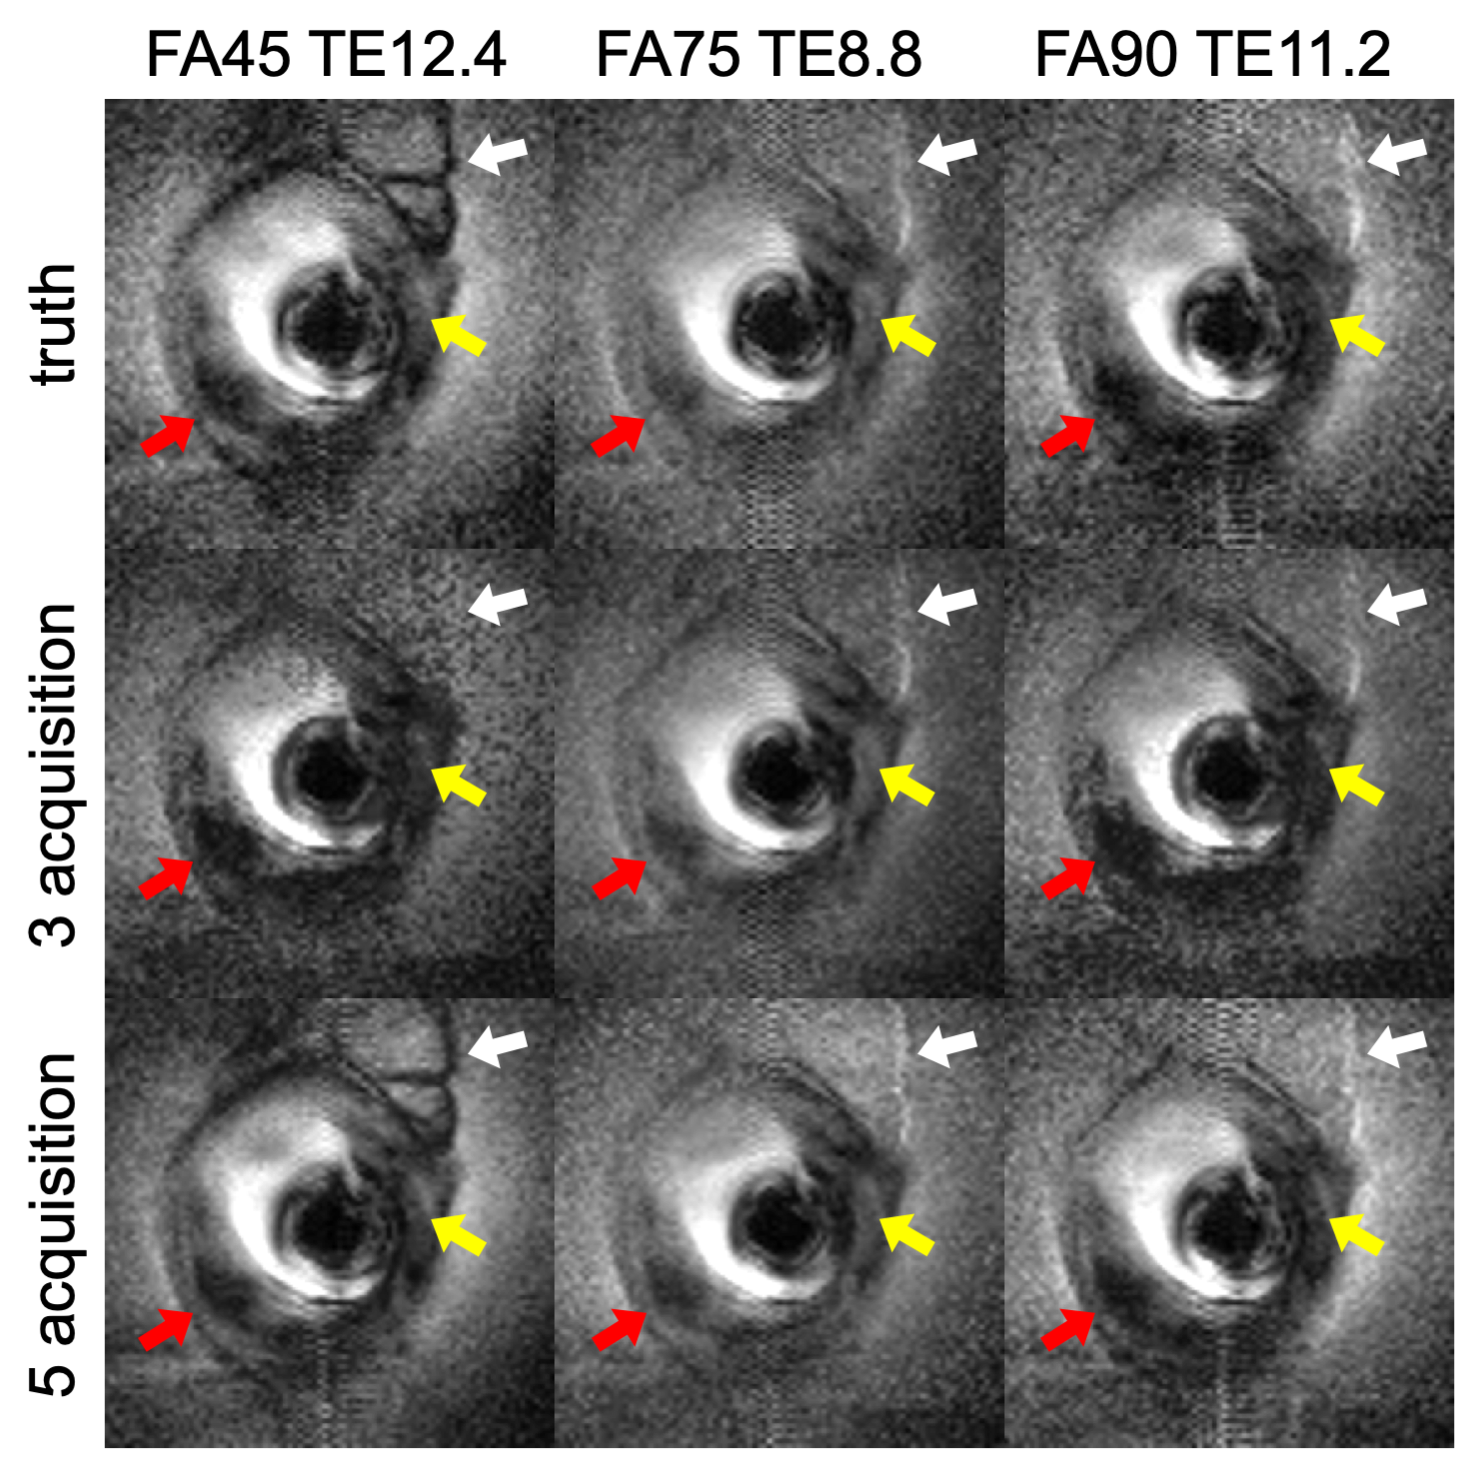
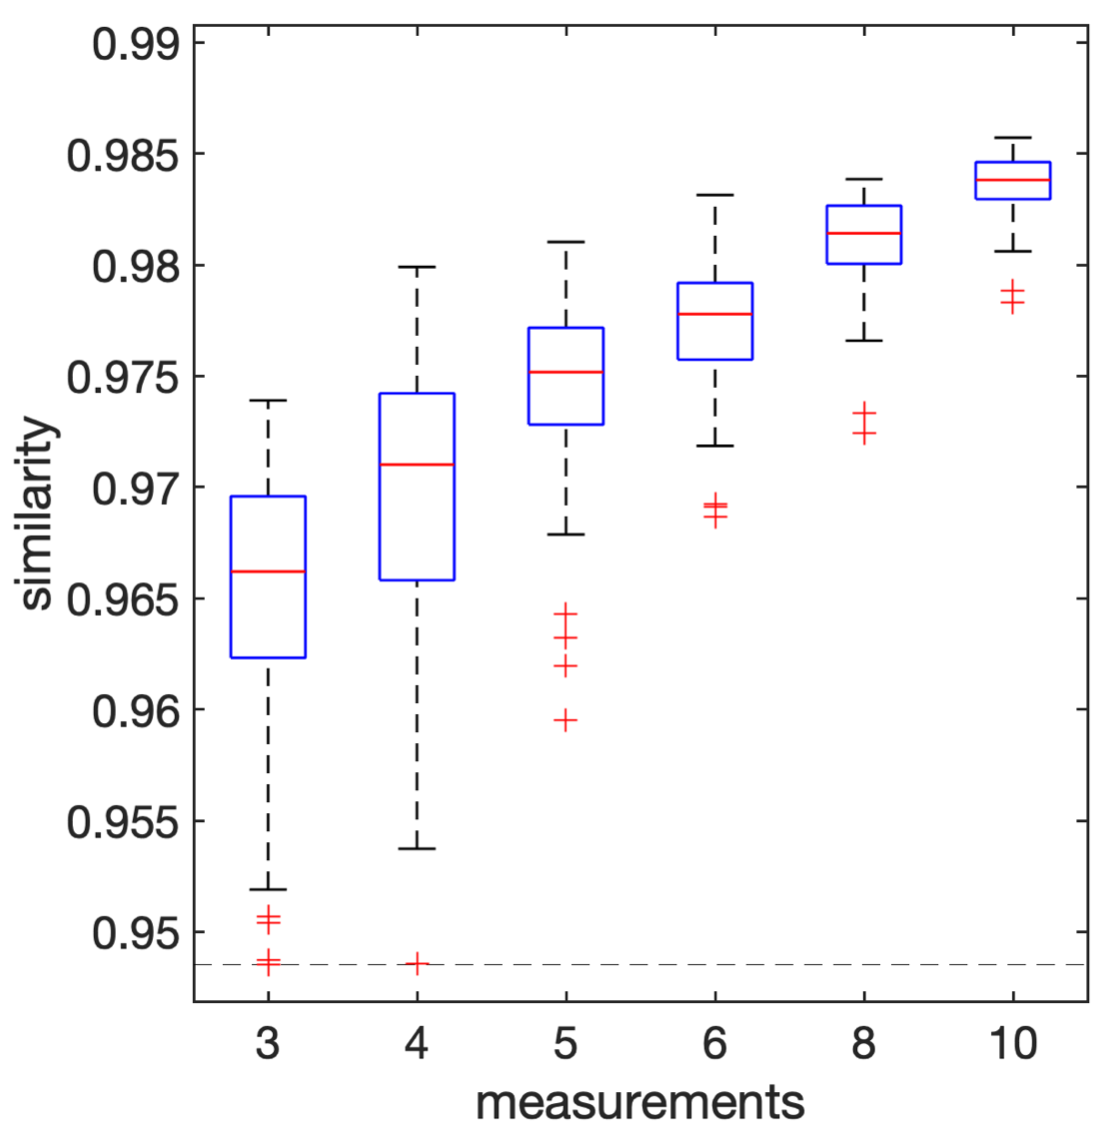
The application was tested by arbitrarily selecting several protocol settings (3 acquisitions: FA/TE= 20/10.8, 45/8.8, 70/6.8; or 5 acquisitions: FA/TE=20/10, 50/8, 60/12.4, 70/12.8, 95/11.2) from the set of test images. For each pixel location of the test image, the signals were matched based on their ‘cosine similarity’ to the most probable filtered signal patterns in the calibration set, to fill the signal in the rest of the 400 parameter locations. After rearrangement, the upshot was a set of images representing a best estimate of the test image contrast at 400 parameter combinations. This can be used to guide subsequent selection of acquisition parameters. For reference, the testing procedure was run 100 times with 3-10 random parameter selections and the average cosine similarity of the estimated images as compared to ground truth was calculated.
Results
Figure 1 shows examples of endoscopic human vessel images in the calibration set acquired with different parameters. The dark discoidal regions in the center are the endoscopy coils. Note the difference in visibility of the attached tissue (white arrows) and the differentiation of calcifications in the vessel wall (yellow arrows). Figure 2 shows examples of signal patterns of pixels at different locations. The raw acquisition and filtered data illustrate the network’s retention of FA-TE contrast features and suppression of noise features. Figure 3 shows synthesized images of the testing sample at unseen parameter settings from 3 acquisitions and 5 acquisitions, as well as the ground truth. Note the visibility and differentiability of attached tissues, calcifications and vessel walls (arrows). Box plots in Figure 4 shows the distribution of average similarity between the synthesized images and ground truth as a function of the number of measurements.Discussion
This work demonstrates the feasibility of using empirical data for parameterized image synthesis in MRI endoscopy, yielding comparable image quality. The cosine similarity evaluation is used for reference here, but may not be the ultimate criterion for perception quality. Such synthesis has the potential to guide automatic localized contrast optimization in a real-time in vivo setting such as the interventional applications intended here. Further investigation to extend the process to higher dimensional parametric spaces and to conventional MRI acquisition settings is underway.Acknowledgements
Supported by NIH grant R01 EB007829 and the Russell H Morgan Chair in Radiology.References
1. Sathyanarayana S, Bottomley PA. MRI endoscopy using intrinsically localized probes. Med. Phys. 2009;36:908–919 doi: 10.1118/1.3077125.
2. Sathyanarayana S, Schär M, Kraitchman DL, Bottomley PA. Towards Real-Time Intravascular Endoscopic Magnetic Resonance Imaging. JACC Cardiovasc. Imaging 2010;3:1158–1165 doi: 10.1016/j.jcmg.2010.08.014.
3. Hegde SS, Zhang Y, Bottomley PA. Acceleration and motion-correction techniques for high-resolution intravascular MRI. Magn. Reson. Med. 2015;74:452–461 doi: 10.1002/mrm.25436.
4. Wang G, Zhang Y, Hegde SS, Bottomley PA. High-resolution and accelerated multi-parametric mapping with automated characterization of vessel disease using intravascular MRI. J. Cardiovasc. Magn. Reson. 2017;19:89 doi: 10.1186/s12968-017-0399-6.
5. Liu X, Ellens N, Williams E, et al. High-resolution intravascular MRI-guided perivascular ultrasound ablation. Magn. Reson. Med. 2020;83:240–253 doi: 10.1002/mrm.27932.
6. Xiaoyang Liu, Parag Karmarkar, Dirk Voit, Jens Frahm, Paul Bottomley. Real-time MRI endoscopy at up to 10 frames/sec. In: Proc. Intl. Soc. Mag. Reson. Med. 26 (2018). Paris, France; 2018. p. 0603.
7. Kingma DP, Welling M. Auto-Encoding Variational Bayes. ArXiv13126114 Cs Stat 2013.
Figures