3531
Analysis of Deep Learning models for Diagnostic Image Quality Assessment in Magnetic Resonance Imaging.
Jeffrey Ma1, Ukash Nakarmi1, Cedric Yue Sik Kin1, Joseph Y. Cheng1, Christopher Sandino2, Ali B Syed1, Peter Wei1, John M. Pauly2, and Shreyas S Vasanawala1
1Department of Radiology, Stanford University, Stanford, CA, United States, 2Department of Electrical Engineering, Stanford University, Stanford, CA, United States
1Department of Radiology, Stanford University, Stanford, CA, United States, 2Department of Electrical Engineering, Stanford University, Stanford, CA, United States
Synopsis
In this abstract we investigate deep learning frameworks for medical image quality assessment and automatic classification of diagnostic and non-diagnostic quality images.
Introduction
Magnetic Resonance Images (MRI) suffer from several artifacts[1,2]. Often times these artifacts go undetected during scanning and patients are rescheduled to revisit/rescan due to undiagnostic image quality. This is an inefficient use of expensive resources, expert time and creates burdens on patient as well as on healthcare providers. Our work is motivated by this need for an automated framework capable of accessing medical image quality and detecting diagnostic and non-diagnostic images seamlessly. In this abstract, we present our results and learnings from our preliminary project. We investigated several frameworks for image quality assessment and investigated several challenges therein.Methods: Data Collection and Deep Learning Models
Data Collection and Labeling: For our preliminary study, we used 3D volume T2-weighted MR abdomen images collected at Stanford University and Lucile Packard Children’s Hospital. The data consists of images from 69 volunteers with varying degrees of motion artifacts. Each patient data has about 30 slices, totaling to about 2111 512x512 MR images in the DICOM format. The entire dataset was rated by two different radiology experts into two classes of image quality: 0 – poor/non-diagnostic(~518 images); 1 – diagnostic(~1220) as shown in Fig.1. The dataset was split into training, evaluation, and testing sets using a 70-10-20 percent split, respectively.Deep Learning Models: In this work, we investigate the performance of two different CNN based DL architectures: C1) A simple 4-layer convolutional neural network and C2) A standard convolution kernel-based ResNet-10 architecture[3]. Figure 2 depicts a simple 4-layer convolutional neural network used in this study. Our architecture is as follows: normalized input greyscale MR image of size 512x512 flows through a 10x10 convolution, followed by a 7x7 convolution, and two 3x3 convolutions. Each convolutional layer is performed with stride 2, downsampling the image at each layer. After each convolutional layer, a Rectified Linear Unit (ReLU) activation is performed, followed by a batch normalization. The final feature tensor is flattened and fully connected to 2 output logits. For ResNet-10, the model was built as described in [3]. Both models were implemented on TensorFlow ver. 1.11.0. Each model was trained on the dataset for 10,000 steps with a batch size of 32 using the ADAM optimizer with a learning rate of 1e-3.
Experiments, Results and Discussions
In DL models, deeper the network, the more non-linear features are captured by the network[4,5]. However, to our surprise, we noticed that a simple 4-layer convolution network was performing better than the more sophisticated ResNet-10 model during the training and validation phase as shown in Fig. 3. Such behavior was also observed in other deeper models. (ResNet-34, results not depicted here.). This behavior is also reflected in the Area Under Curve (AUC) study for the test data set as shown in Fig.3. It is clearly seen from the training/validation curves and the AUC curve that a more sophisticated model might not be necessary for a simple two-class classification problem such as this. It encouraged us to investigate deeper into the ResNet-10 model and understand the model's behavior as we go deeper into the model. To understand image features extracted by ResNet-10 we visualized activations maps and investigated discriminating image features learned by it for two different classes at different layers. For this purpose, we created a set of toy example images. We took a sample image from the diagnostic class and added motion artifacts[6] to yield the same image with non-diagnostic quality. Then, the activation maps in each of these two images allowed us to observe if a particular layer in the model is correctly generalizing or differentiating between the classes. Our analysis on the activation maps revealed that as we go deeper in the model, features learned by layers are not discriminating much between the diagnostic and non-diagnostic class as shown in Figure 4. We can clearly see that while low-level features (features from the first layer) are discriminating between two classes, the deeper features (features from the last layer) from ResNet-10 are not very discriminating between two classes. This is possibly what caused the deeper model not performing better as expected.Challenges: Our initial study revealed that the following three are key challenges in creating a deep learning pipeline for automatic diagnostic quality assessment. i) Inter-rater Subjectivity: To measure the consistency between two raters we evaluated Jaccard indices[7]. We observed that there is less than 40% agreement between the two raters. ii) Unbalanced Data: The accuracy of the model is heavily influenced by unbalanced data distribution. In MR image assessment, data are non-uniformly distributed over diagnostic and non-diagnostic classes. Figure 5 shows the confusion matrix that depicts the accuracy and error of the model. We can see that the accuracy is heavily influenced by the dominating class (diagnostic class in our case) that has a higher data distribution density. iii) Unreliable labels: Figure 5 shows an example of a faulty label. Such faulty labels not only affects the model training but also lead to error in accuracy calculation and evaluation.
Conclusion
In this abstract, we analyzed two deep learning models for MR image quality assessments and investigated several challenges in MR image quality assessment for the automatic classification of diagnostic and non-diagnostic images.Acknowledgements
This work is supported in part by the NIH R01EB009690 and NIH R01 EB026136 grants, and by GE Healthcare.References
- Zaitsev, Maxim, et al. “Motion Artifacts in MRI: A Complex Problem with Many Partial Solutions.” Journal of Magnetic Resonance Imaging: JMRI, vol. 42, no. 4, pp. 887–901, Oct. 2015.
- Vasanawala, Shreyas S., et al. “Navigated Abdominal T1 MRI Permits Free-Breathing Image Acquisition with Less Motion Artifacts.” Pediatric Radiology, vol. 40, no. 3, pp. 340–44, Mar. 2010.
- He, Kaiming, et al. “Deep Residual Learning for Image Recognition.” ArXiv:1512.03385 [Cs], Dec. 2015.
- C. -C. Jay Kuo, “Understanding Convolutional Neural Networks with A Mathematical Model”, arXiv, 1609.04112, 2016.
- J.Kaushik, “Understanding Convolutional Neural Networks”, arXiv, 1605.09081, 2016.
- Herbst M, Maclaren J, Lovell-Smith C, et al. “Reproduction of motion artifacts for performance analysis of prospective motion correction in MRI”. Magn Reson Med. pp 182–190. 2014.
- Bouchard, Mathieu, et al. “A Proof for the Positive Definiteness of the Jaccard Index Matrix.” International Journal of Approximate Reasoning, vol. 54, no. 5, pp. 615–26, July 2013.
Figures
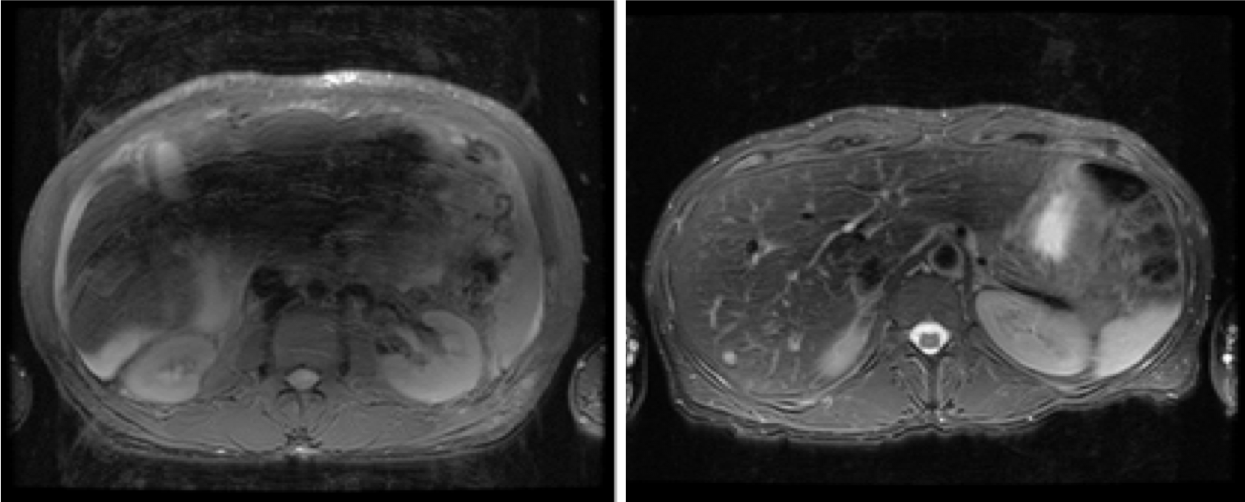
Figure 1. An example of each of the two
classes
of image quality. Left-most is poor quality (0, non-diagnostic), the right
is
diagnostic quality (1).
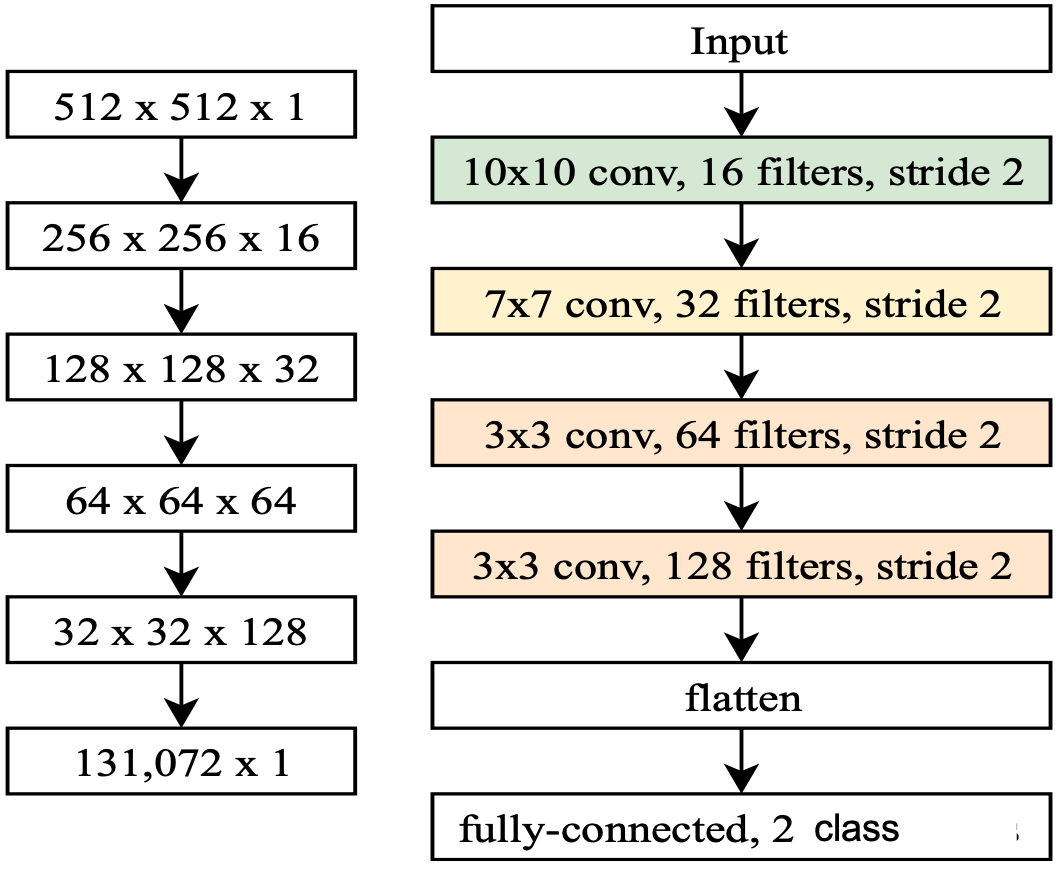
Figure 2. A diagram depicting the 4-layer
convolutional neural network (ConvNet)
model. The shape of an image tensor throughout the model is shown on the left.
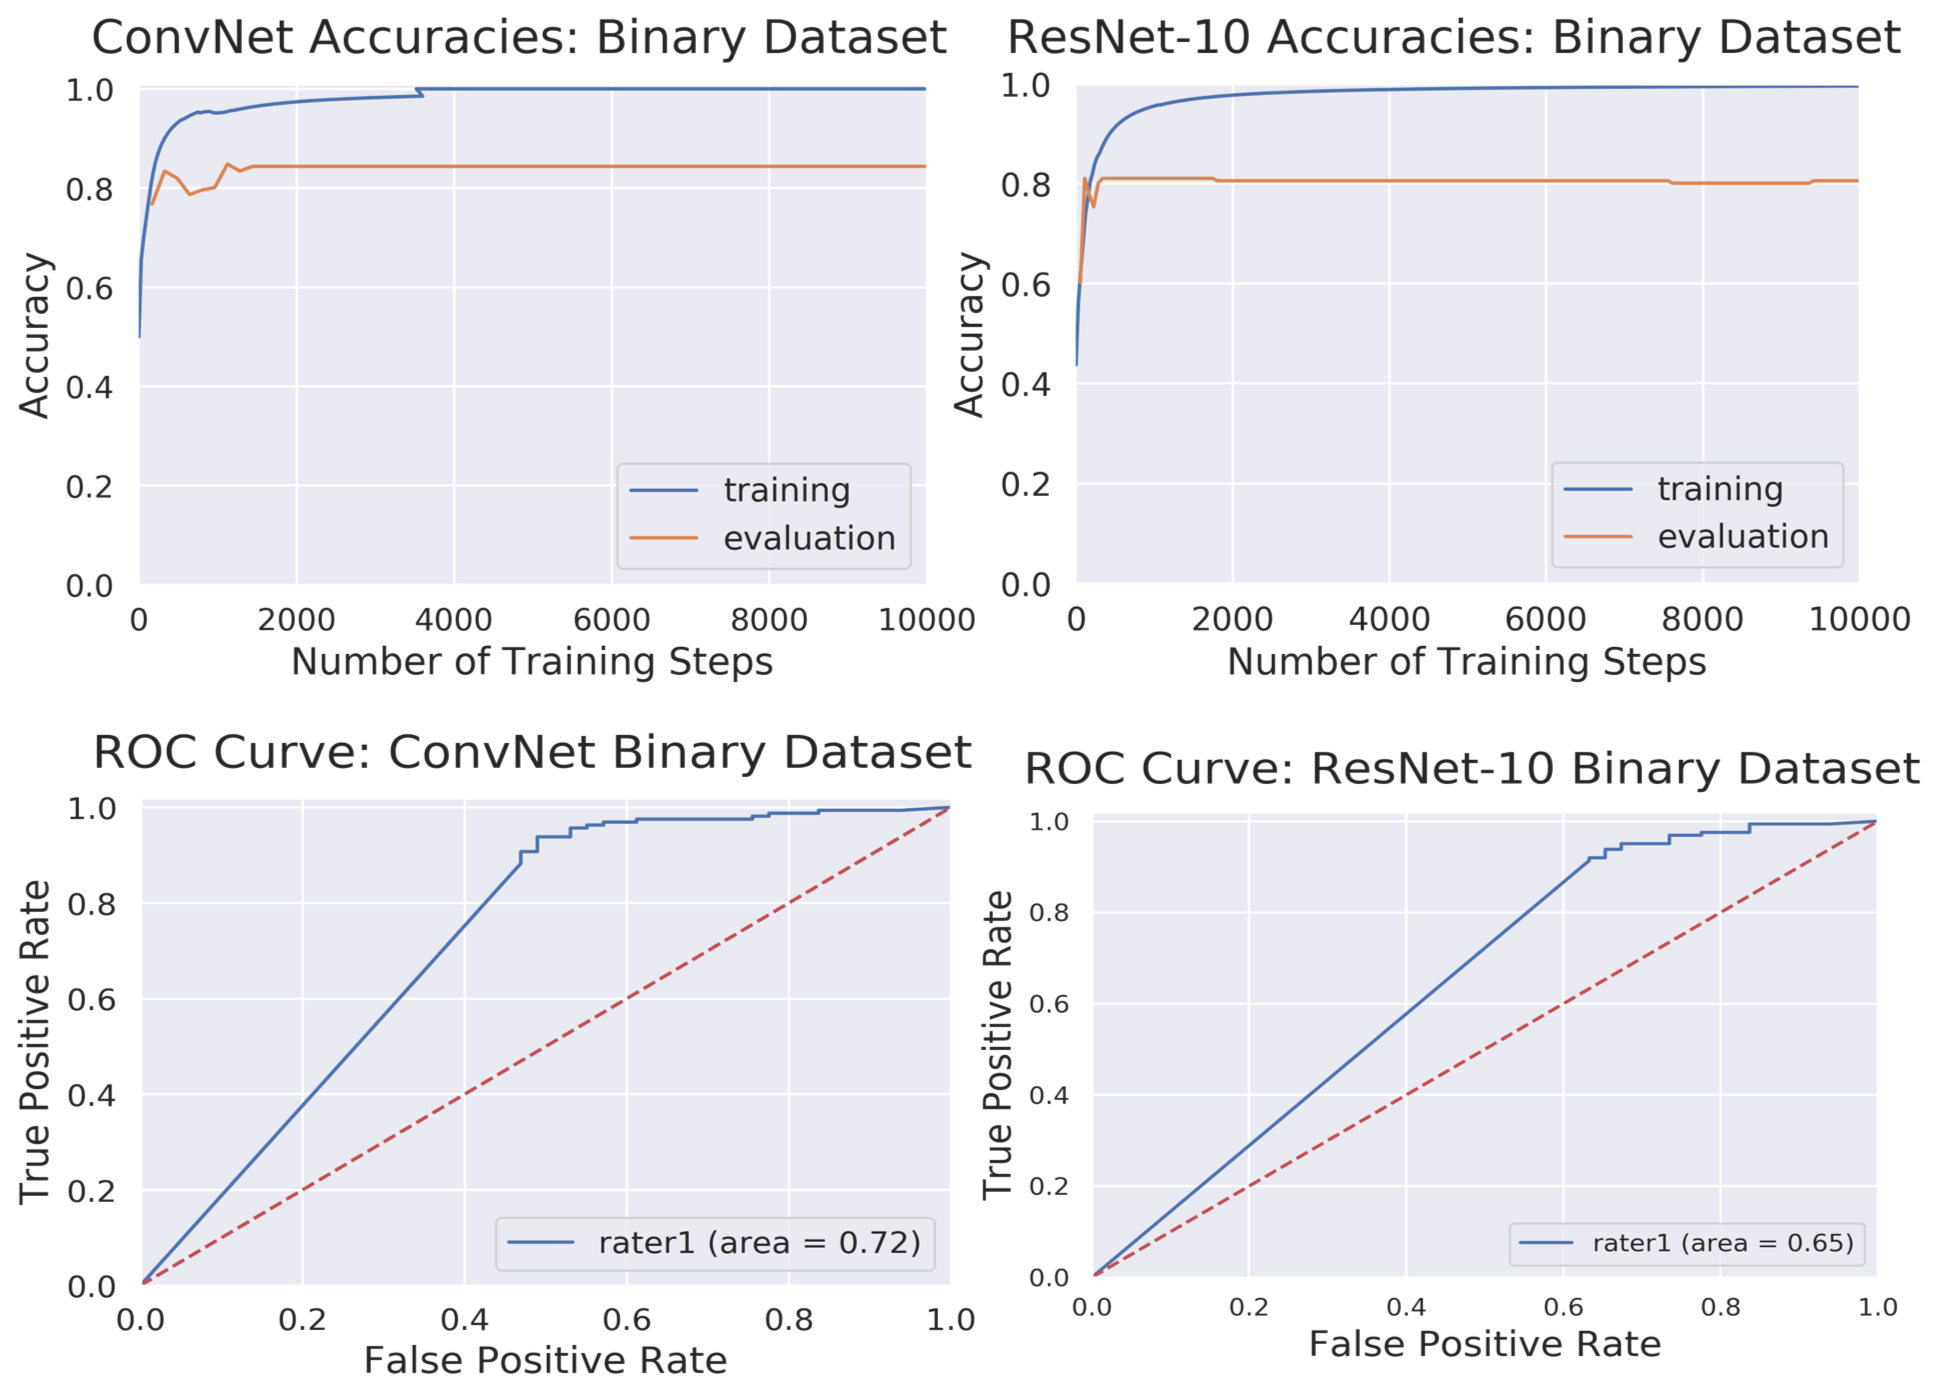
Figure 3. Top: Training and
evaluation accuracy curves for ConvNet
and ResNet-10 architectures. Bottom: AUC-ROC
curves for diagnostic
image quality classification using ConvNet and ResNet-10 models. For
reference, an excellent model has an AUC as close to 1 as possible, while a
very poor model would have an AUC close to 0.5.
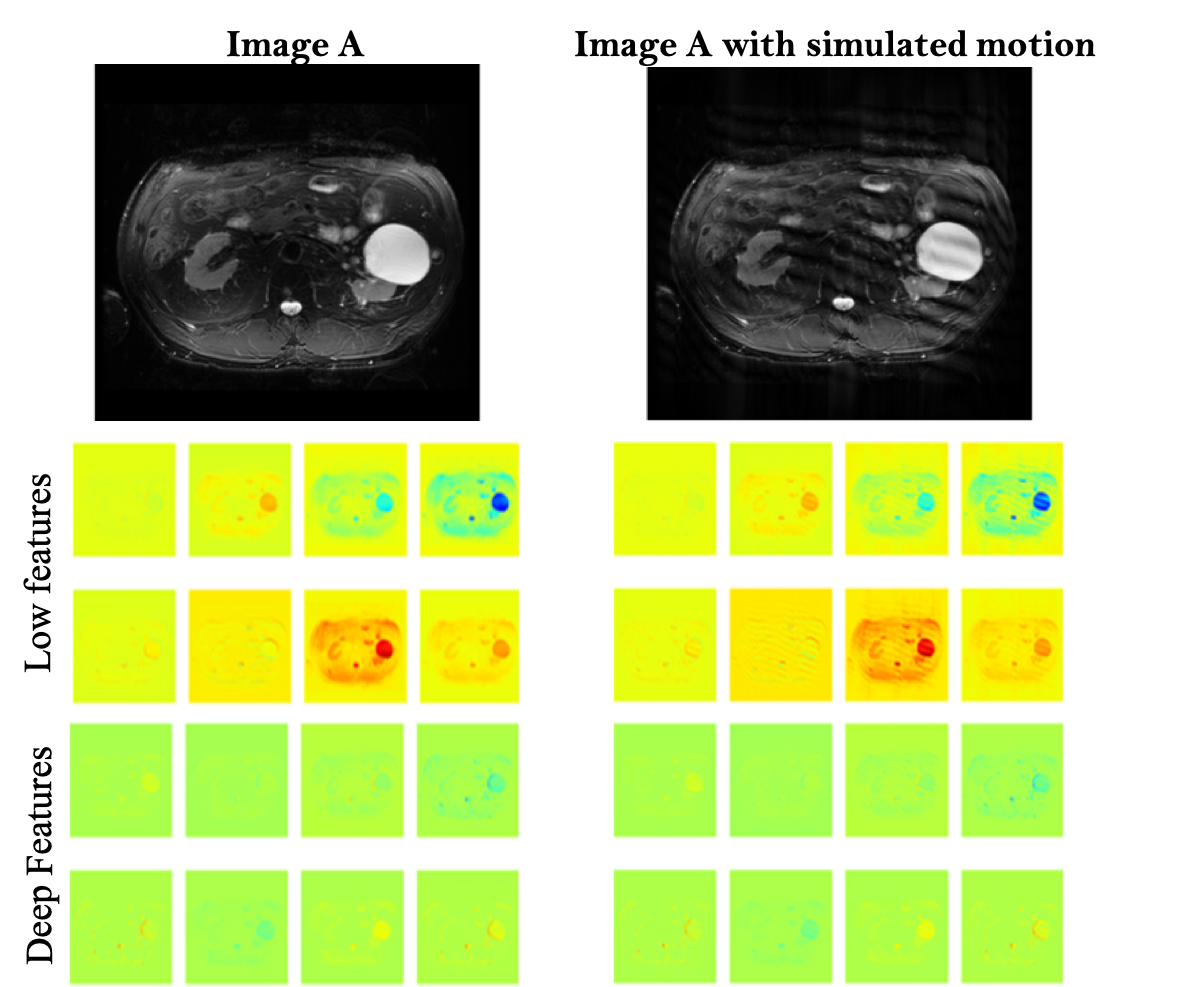
Activation maps for images through the deep
ResNet-10 model. It
shows
representative activation maps from the first layer (low-features) and last
layer (deeper-features).
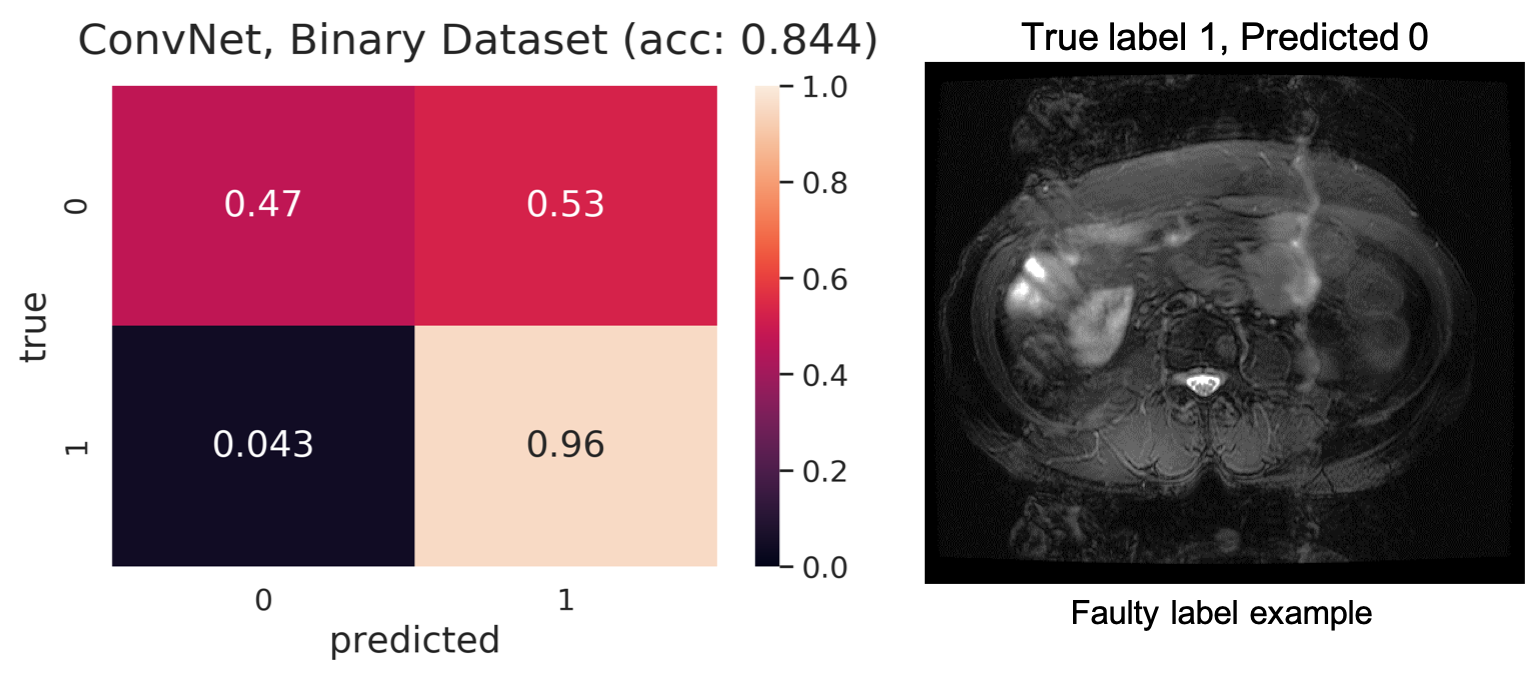
Challenges in developing an automatic pipeline for MR image quality assessment and classification tasks.