3525
Prediction of prostate cancer aggressiveness using open-source machine learning tools for 5-minute prostate MRI: PRODIF CAD 1.01Department of Diagnostic Radiology, University of Turku, Turku, Finland, 2Department of Future Technologies, University of Turku, Turku, Finland, 3Department of Biomedical Engineering, Case Western Reserve University, Cleveland, OH, United States, 4Department of Pathology, Institute of Biomedicine, Turku, Finland, 5Department of Urology, Turku University Hospital, Turku, Finland, 6Medical Imaging Centre of Southwest Finland, Turku University Hospital, Turku, Finland, 7Department of Radiology, Icahn School of Medicine at Mount Sinai, New York, NY, United States
Synopsis
Acquisition time of a routine prostate MRI can be up to 20-25 minutes leading to significant financial burden on healthcare systems as the number of prostate MRI continue to increase. We developed, validated and tested an open-source radiomics/texture tools for 5-minute biparametric prostate MRI (T2-weighed imaging and DWI obtained using 4 b-values (0, 900, 1100, 2000 s/mm2)) using whole mount prostatectomy sections of 157 men with prostate cancer, PCa, (244 PCa lesions). Best features were corner detectors with AUC (clinically insignificant vs insignificant prostate cancer) in the range of 0.82-0.89. Code and data are available at: https://github.com/haanme/ProstateFeatures and http://mrc.utu.fi/data .
INTRODUCTION
Increasing use of prostate MRI in men with a clinically suspected or diagnosed prostate cancer (PCa) is placing increasing financial burden on healthcare systems worldwide (1). Biparametric MRI (bpMRI) (no iv contrast injection) has lower acquisition time and lower cost than routine multiparametric MRI. Moreover, further reduction of scan time can be achieved by careful optimization of bpMRI acquisition protocol. In the current study, we aimed to develop, validate and test an open-source machine learning tools for bpMRI with acquisition time of only 5 minutes (Figure 1).METHODS
One hundred fifty-seven men with diagnosed PCa underwent 3T prostate MR (Ingenuity PET/ MR, Philips, Best, the Netherlands) using 32 channel manufacturer's cardiac coils before prostatectomy. Transversal T2-weighted images (T2w) were acquired using a single-shot turbo spin-echo sequence with TR/TE 4668/130 ms, FOV 250x320 mm2, acquisition/reconstruction matrix size 250x320/512x672, slice thickness 2.5 mm and scan time of 1 minute 10 seconds. Diffusion weighted imaging was performed with single-shot SE epi sequence with TR/TE 3141 ms/51 ms, FOV 250×250 mm2, acquisition/reconstruction matrix 100x99 / 224x224, slice thickness 5 mm, diffusion gradient timing (Δ) 24.5 ms, diffusion gradient duration (δ) 12.6 ms, 4 of scanned 12 b-values were used (number of signal averages) 0 (2), 900 (2), 1100 (2), 2000 (4) s/mm2 (2), and scan time of 3 minutes and 17 seconds. The combined scan time of T2w and DWI (4 b-values) was 4 minutes and 27 seconds.DWI data sets were fitted using monoexponential (ADCm) function utilizing the Broyden-Fletcher-Goldfarb-Shanno algorithm in Leastsqbound‐scipy library (3). T2w signal intensities (“intensity drift”) were corrected using histogram alignment method as described by Nyul et al. (4). Whole prostate gland was manually delineated and the volumes were considered for histogram alignment (Figure 1). Each individual tumor focus in whole mount prostatectomy sections was graded separately based on the International Society of Urological Pathology (ISUP) guidelines (5) and Gleason Grade Groups (GGG) were assigned. Prostate cancer extent on each MRI acquisition (T2w, DWI) was manually delineated using whole mount prostatectomy sections as “ground truth”.
Feature extraction
First-order statistics (mean, standard deviation, median, range, 25th and 75th percentile) from T2w and ADCm signal intensities were calculated. Additionally, features derived from edge detector maps (6) (Figure 1), shape features, high-pass and low-pass filtered data, and 3D Laws features were obtained. Low and high-pass filters were implemented before extracting statistics from signal to evaluate the performance of other implemented feature extraction techniques in relation to simple noise filtering to the data. Finally, a three-dimensional version of Laws features (7) and shape feature of surface curvature (8, 9) were extracted from 3D mesh after applying marching cubes algorithm to the binary lesion. All 3D feature extractions were preceded by resampling image data into isotropic voxel size. When applicable, all features were calculated from whole prostate, PCa lesions, and whole gland region excluding the lesion. Multiple parameters were applied to feature extraction algorithms where considered suitable.
Feature selection and machine learning
Random stratified (based on proportion of low grade GGG 1,2 vs >2) split with 70-30 ratio was performed into training (n=107) and unseen testing (n=50) data (Figure 2, 3). In total, 5836 features which have earlier demonstrated good short-term repeatability (10), were calculated from T2w and ADCm. The features were grouped by their functioning principle, and 2 best features were included from each of 9 feature groups using Minimum Redundancy Maximum Relevance (MRMR), followed by Nearest Neighbour based relevance calculation using Boruta R package (11), removing features expressing significantly low relevance. Finally, clusters found significant with Pvclust package (12) were reduced by removing redundant features until no features were found to resemble others, resulting 9, 8 and 4 features for feature sets from T2w only, ADCm only, and T2w combined with ADCm, respectively. The training data of 107 patients was used in 3-fold cross validation to estimate performance of three logistic regressor models for T2w, ADCm and T2w combined with ADCm. The performance measure was Area Under Receiver Operator Characteristic Curve (AUC) for prediction of GGG 1 vs >1 based on whole mount prostatectomy. Feature selection, regress or fitting and statistical analyses were implemented using R (version 3.5.3, R Foundation for Statistical Computing, Vienna, Austria).
RESULTS
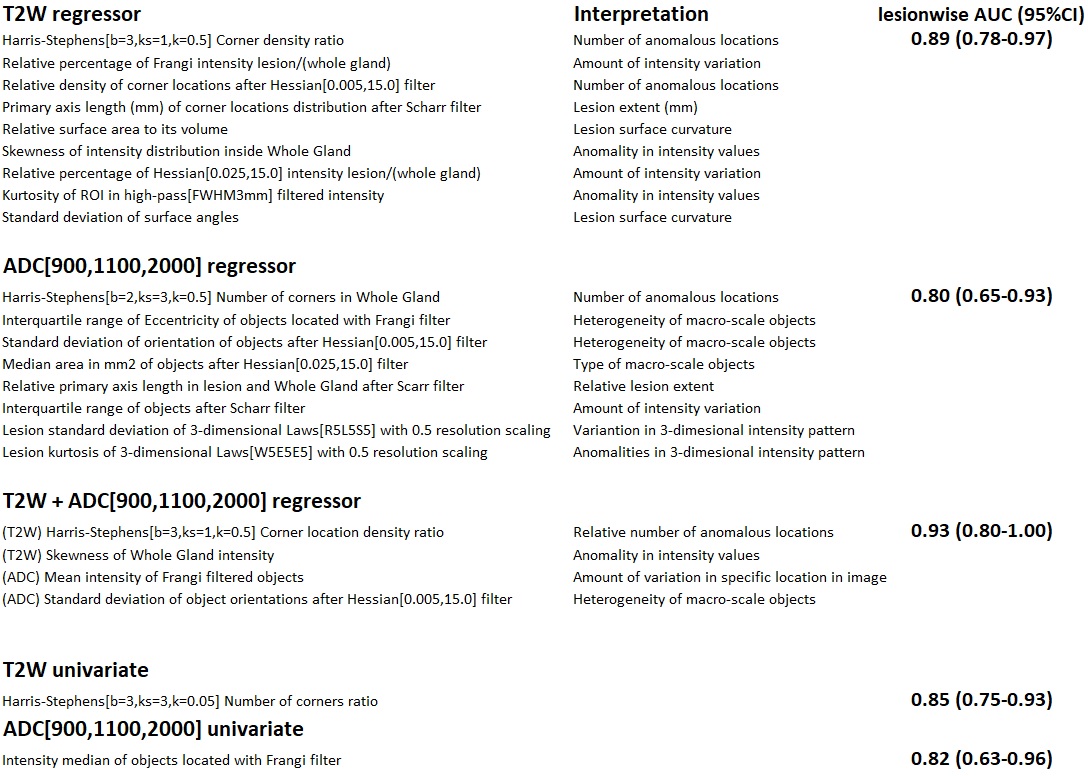
Best individual features selected with training set were ADCm Frangi filter intensity, and T2w Harris-Stephens number of corner locations ratio (Figure 4). Their performance in unseen data in terms of AUC (95%CI) was 0.82 (0.63-0.96) and 0.85 (0.75-0.93) in lesion-wise analysis. Features selected for logistic regressor are listed in Figure 4. Logistic regressor classification performance AUC (95%CI) was 0.86 (0.77-0.94), 0.89 (0.81-0.96), 0.91 (0.82-0.98) for T2w alone, ADCm alone and bpMRI T2W with ADCm, respectively.DISCUSSION/CONCLUSION
Machine learning using radiomic/texture features extracted from optimized 5-minute bpMRI (2) have a good classification performance for differentiating PCa with GGG≤1 (“clinically insignificant PCa”) versus PCa with GGG>1 (“clinically significant PCa”).Acknowledgements
This study was financially supported by grants from Orion Pharma Research Foundation (HM), Sigrid Jusélius Foundation (HM, HA, IJ), Finnish Cultural Foundation (HM, IJ), clinical Researcher Funding from the Academy of Finland (PT), TYKS-SAPA Research funds (HM, PT,OE, MP, JS, JPB, HA, IJ), Finnish Cancer Society (IJ), Instrumentarium Research Foundation (IJ, HA). Funding from Instrumentarium Science Foundation, Sigrid Jusélius Foundation, Turku University Hospital, TYKS-SAPA research funds were used to cover the cost of MRI examinations.References
1. Barnett CL, Davenport MS, Montgomery JS, Wei JT, Montie JE, Denton BT: Cost-effectiveness of magnetic resonance imaging and targeted fusion biopsy for early detection of prostate cancer. BJU Int 2018; 122:50–58.
2. Merisaari H, Jambor I: Optimization of b-value distribution for four mathematical models of prostate cancer diffusion-weighted imaging using b values up to 2000 s/mm2: Simulation and repeatability study. Magn Reson Med 2015; 73.
3. Toivonen J, Perez IM, Movahedi P, Merisaari H: Prediction of prostate cancer aggressiveness using texture features of T2- weighted imaging , diffusion weighted imaging and T2 mapping. PLOS ONE:1–33.
4. Nyul LG, Udupa JK: On standardizing the MR image intensity scale. Magn Reson :1072–1081.
5. Epstein JI, Egevad L, Amin MB, Delahunt B, Srigley JR, Humphrey PA: The 2014 international society of urological pathology (ISUP) consensus conference on gleason grading of prostatic carcinoma definition of grading patterns and proposal for a new grading system. Am J Surg Pathol 2016; 40:244–252.
6. Harris, C.G. and Stephens M: A combined corner and edge detector. In Alvey Vis Conf; 1988:10–5244.
7. Suzuki MT, Yaginuma Y: A solid texture analysis based on three-dimensional convolution kernels. Videometrics IX 2007; 6491(January 2007):64910W.
8. Cuocolo R, Stanzione A, Ponsiglione A, et al.: Clinically Significant Prostate Cancer Detection on MRI: a Radiomic Shape Features Study. Eur J Radiol 2019; 116(March):144–149.
9. Chen T, Li M, Gu Y, et al.: Prostate Cancer Differentiation and Aggressiveness: Assessment With a Radiomic-Based Model vs. PI-RADS v2. J Magn Reson Imaging 2019; 49:875–884.
10. Merisaari H, Taimen P, Shiradkar R, et al. Repeatability of radiomics and machine learning: Short-term repeatability study of 112 patients with prostate cancer using Diffusion Weighted Imaging. Magn Reson Med in press
11. Kursa MB, Rudnicki WR: Feature selection with the Boruta package. J Stat Softw 2010; 36:1–13.
12. Suzuki R, Shimodaira H: Pvclust: an R package for assessing the uncertainty in hierarchical clustering. Bioinformatics 2006; 22:1540–1542.
Figures
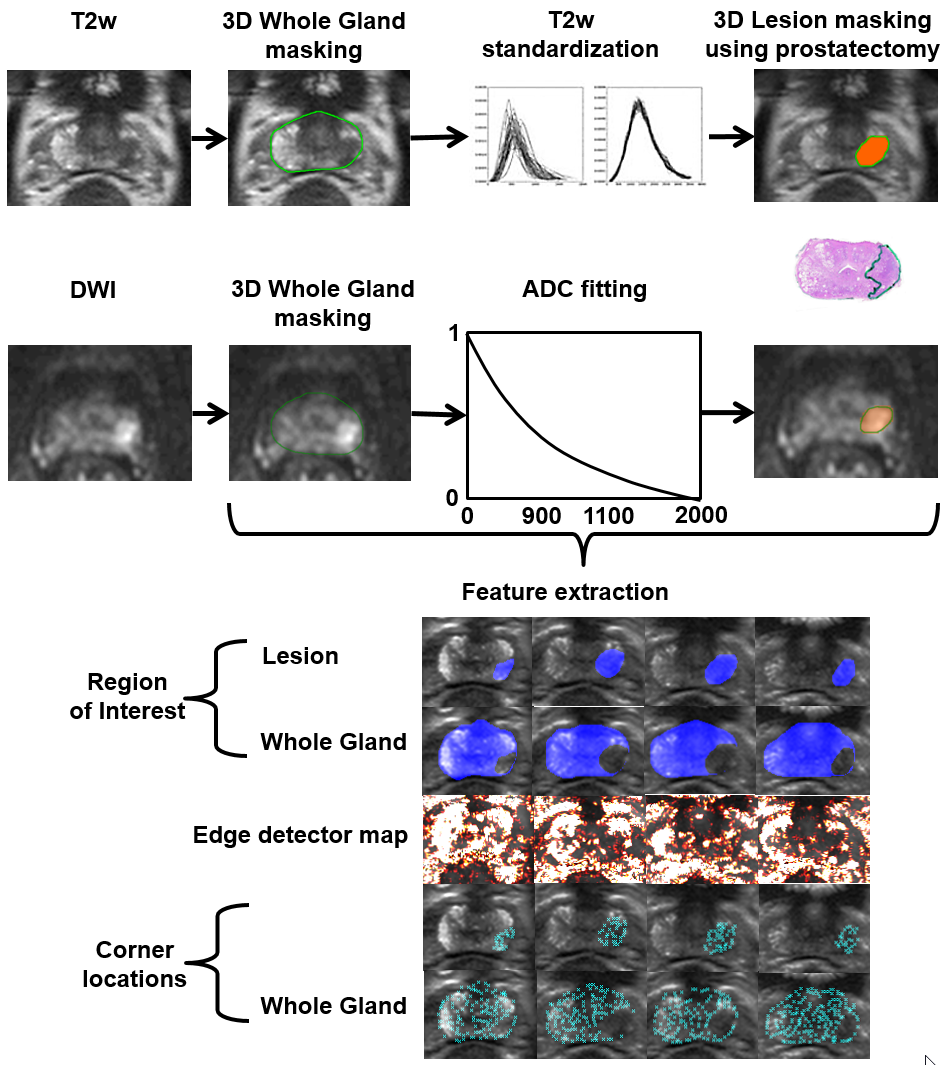
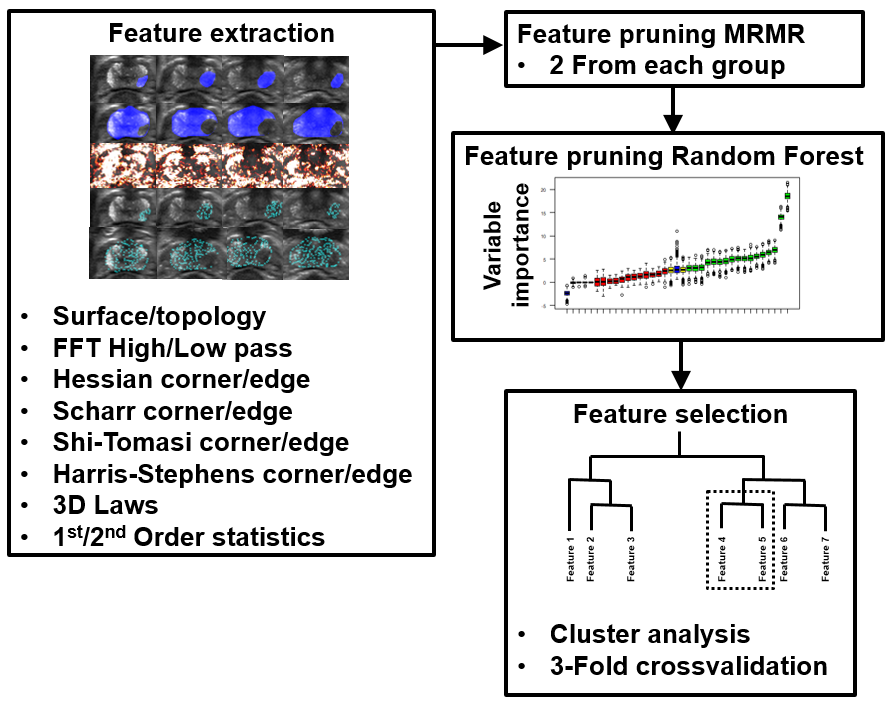
Figure 2: Feature pruning and selection process for 5-minute biparametric MRI.
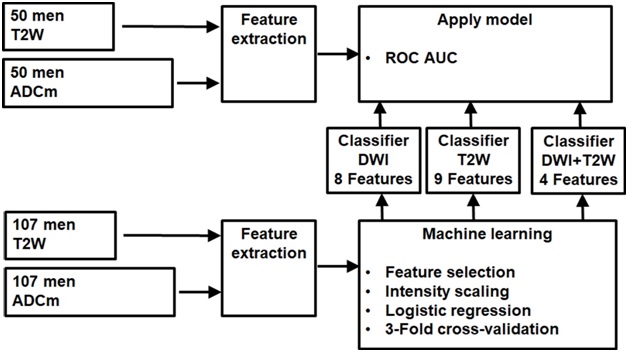
Figure 3: Machine learning pipeline for bi-parametric MRI.