3520
Region of Interest Localization in Large 3D Medical Volumes by Deep Voting
Marc Fischer1,2, Tobias Hepp3, Ulrich Plabst2, Bin Yang2, Mike Notohamiprodjo3, and Fritz Schick1
1Section on Experimental Radiology, Department of Radiology, University Hospital Tübingen, Tübingen, Germany, 2Institute of Signal Processing and System Theory, University of Stuttgart, Stuttgart, Germany, 3Diagnostic and Interventional Radiology, University Hospital Tübingen, Tübingen, Germany
1Section on Experimental Radiology, Department of Radiology, University Hospital Tübingen, Tübingen, Germany, 2Institute of Signal Processing and System Theory, University of Stuttgart, Stuttgart, Germany, 3Diagnostic and Interventional Radiology, University Hospital Tübingen, Tübingen, Germany
Synopsis
Identifying Regions of Interest (ROI) such as anatomical landmarks, bounding boxes around organs, certain Field of Views or the selection of a particular body region is of increasing relevance for fully automated analysis pipelines of large cohort imaging data. In this work, a 3D Deep Voting approach based on recent advancements in the field of Deep Learning is proposed, which is able to locate ROIs including single points like anatomical landmarks as well as planes to identify region separators within 3D MRI and CT datasets.
Introduction
With the advent of Deep Learning (DL)1 many medical image analysis tasks can be handled by fully automated approaches. Especially large epidemiological imaging studies such as the UK Biobank2 and the German National Cohort (NAKO)3 require automated pipelines to enable quantitative analyses of thousands of datasets. Many of these tasks could benefit from preceding steps, providing additional information on the position of certain anatomical landmarks, bounding boxes around specific organs, a suitable Field of View (FOV) or the selection of a desired body region. In this work we present a generic approach to identify such Regions of Interest (ROI) automatically. We demonstrate the performance of our approach on two tasks: localizing the center of the femoral heads in PD-weighted MRI and separating body regions in contrast-enhanced whole-body CT volumes.Methods
We introduce an efficient patch-based Neural Network (NN) for the localization of arbitrary ROIs in volumetric medical images (see Fig. 2). The network architecture follows core ideas of UNet4, VNet5, DeepLabv3+6 and Attentive Spatial Pyramids (ASP) based of ideas on ESPNet7 and CBAM8 to capture context adaptively. By incorporating a large receptive field in combination with a small output region, the architecture remains memory efficient and can cast accurate predictions without prominent boundary effects at the patch edges.Inspired by recent works based on Deep Voting9,10,11 our approach features two different output volumes. The first output consists of foreground masks that learn to segment a spherical extent around each ROI. The second output consists of voxel-wise offset predictions for each dimension that point towards the ground truth ROI. A combination of Cross-Entropy loss for the foreground masks and Huber loss for the offsets is used during training. As such the network learns to use characteristics of the underlying anatomy of each region to estimate an offset field. The masking limits the offset vectors to a certain extent around the ROI, so only eligible voxels in proximity can cast a vote. Voxels with a mask value below 0.4 are discarded. The remaining votes are weighted by the mask value and aggregated into a heatmap as is known from the Hough transform. Landmarks and region separators are subsequently identified as the maximum of the resulting heatmaps.
For the localization of the center of the femoral heads we used 80 MR datasets of general population subjects from the NAKO imaging study. All PD-weighted fast spin echo images have been acquired on a 3T MRI scanner with imaging parameters; isotropic resolution 1.0mm, matrix size 384x264x160, TE=33ms, TR 1200ms and bandwidth=500Hz/px. As ground truth, the center of each femoral heads has been annotated carefully for each subject (Fig.1b).
For the separation of body regions, we used contrast enhanced (portal venous phase) whole body staging CTs of 80 melanoma patients. For pre-processing all CTs were resampled to a common resolution of 1.6x1.6x5.0mm3 and a matrix size of 256x256x280. Three body region separators at the transitions between head, thorax, abdomen and legs have been defined by an experienced radiologist for each dataset (Fig.1d).
A four-fold cross-validation is applied with resulting splits of 60 training and 20 test subjects. Image augmentation, such as scaling, elastic deformations and various noise types are applied. The training consists of 800 epochs with a batch size of 24 elements.
Results
The femoral head center localization is depicted in Fig. 3. The mask and the magnitude of the offset vectors are precisely predicted as can be seen by the color-coded overlays. The resulting heatmaps are closely condensed around each center. For the region separators (Fig. 4), the volumes are processed with an accurate mask and offset vectors. However, there are minor discontinuities in the prediction. The resulting aggregated heatmap represents the correct ROI but is not as well condensed. In both cases the foreground masks follow closely the ground truth with a mean accuracy of 0.9996% and 0.9601% respectively. Quantitative results of the deviations of the located ROIs to the ground truth positions along relevant dimensions are summarized in Fig.5.Discussion
Regardless of the modality, the approach provides consistent foreground masks and offset predictions. For the landmark localization excellent results could be achieved, which is a helpful prerequisite for automated segmentation12 and thereby subsequent analyses with respect to geometrical and structural properties.For the CT data with less textural characteristics, a good localization of the region separator could be achieved. In this context, ambiguity of the ground truth must be taken into account, as a single slice has been defined as the separator of two regions. Albeit these separators can contain varying anatomical features, the NN generalizes well to the test subjects. We also note that discontinuities within the offset prediction occur at the transition between different patch volumes. Thus, a larger patch size may be beneficial in providing stratified results. In the future, more complex ROIs will be investigated such as non-axis aligned region separators.
Conclusion
The proposed approach enables accurate and robust localization of ROIs for 3D medical data. We successfully demonstrated the performance of our network to localize the center of the femur head in MRI and to separate body regions in whole body CT volumes.Acknowledgements
No acknowledgement found.References
- Litjens G, Kooi T, et al. A survey on deep learning in medical image analysis. Medical image analysis 2017;42:60-88.
- Petersen SE, Matthews PM, et al. Imaging in population science: cardiovascular magnetic resonance in 100,000 participants of UK Biobank-rationale, challenges and approaches. Journal of Cardiovascular Magnetic Resonance. 2013;15(1):46.
- Bamberg F, Kauczor HU, et al. Whole-Body MR Imaging in the German National Cohort: Rationale, Design, and Technical Background. Radiology 2015;277(1):206-220.
- Ronneberger O, Fischer P, Brox T. U-net: Convolutional networks for biomedical image segmentation. International Conference on Medical image computing and computer-assisted intervention (MICCAI). Springer, Cham, 2015:234-241.
- Milletari F, Nassir N, Ahmadi SA. V-net: Fully convolutional neural networks for volumetric medical image segmentation. 3D Vision (3DV), 2016 Fourth International Conference on. IEEE, 2016:565-571.
- Chen LC, Zhu Y, Papandreou G, et al. Encoder-decoder with atrous separable convolution for semantic image segmentation. Proceedings of the European conference on computer vision (ECCV). 2018:801-818.
- Mehta S, Rastegari M, et al. ESPNet: Efficient spatial pyramid of dilated convolutions for semantic segmentation. Proceedings of the European Conference on Computer Vision (ECCV). 2018:552-568.
- Woo S, Park J, et al. CBAM: Convolutional block attention module. Proceedings of the European Conference on Computer Vision (ECCV). 2018:3-19.
- Xie Y, Kong X, et al. Deep voting: A robust approach toward nucleus localization in microscopy images. International Conference on Medical Image Computing and Computer-Assisted Intervention (MICCAI). Springer, Cham, 2015:374-382.
- Papandreou G, Zhu T, et al. Towards accurate multi-person pose estimation in the wild. Proceedings of the IEEE Conference on Computer Vision and Pattern Recognition (CVPR). 2017:4903-4911.
- Chen R, Ma Y, Chen N, et al. Cephalometric Landmark Detection by Attentive Feature Pyramid Fusion and Regression-Voting. International Conference on Medical Image Computing and Computer-Assisted Intervention (MICCAI). Springer, Cham, 2019:873-881.
- Fischer M, Schwartz M, et al. Landmark-guided Hip Segmentation in 3D MR Images of a Large-Scale Cohort Study. Proceedings of the European Society for Magnetic Resonance in Medicine and Biology (ESMRMB) 2019.
Figures
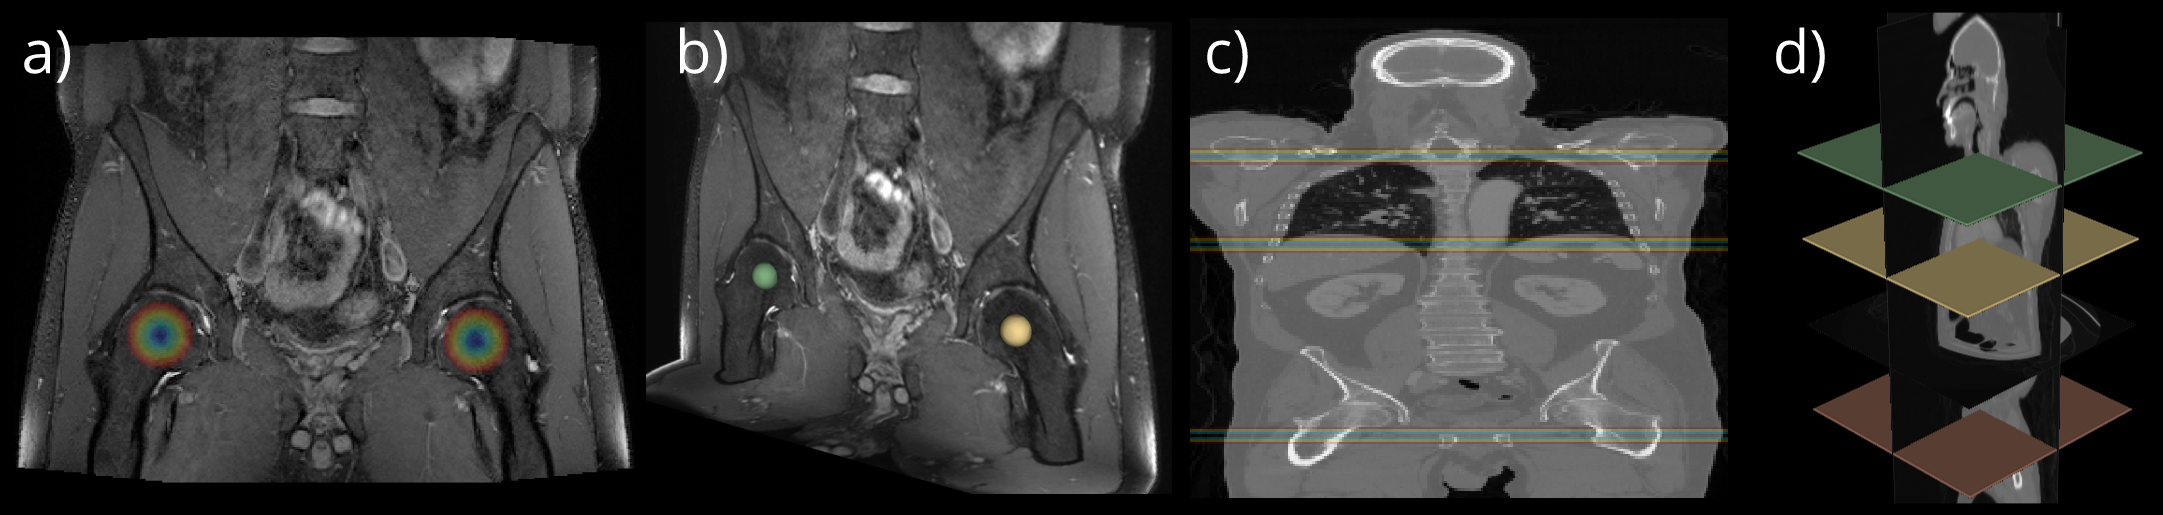
Fig. 1: Overview of the PD-weighted MRI (a) and CT (c) volumes. Each dataset comprises 80 subjects. Exemplary coronal slices (a, c) are illustrated. The corresponding ground truth annotation indicating each ROI is shown besides the volumes. A sphere of the femoral head centers (b) and the planes of the region separators (d) are depicted. The overlay in (a, c) illustrates the magnitude of the offset vectors within a spherical extent around each ROI.
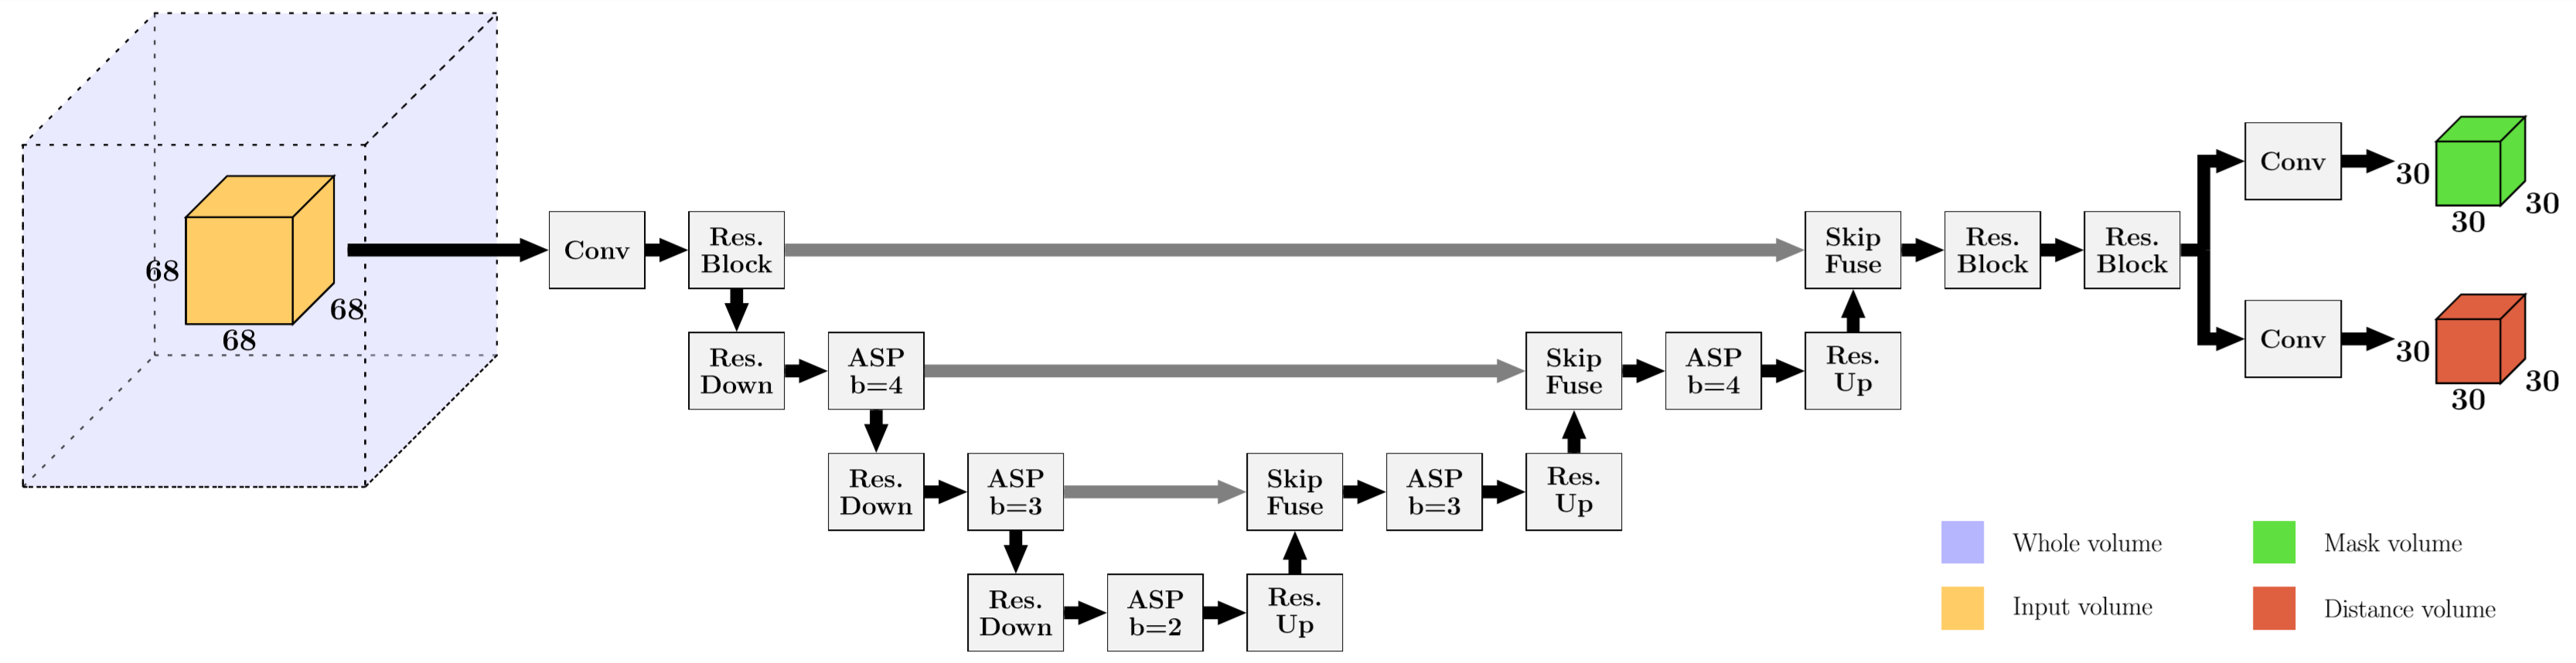
Fig. 2: Proposed NN architecture with two output volumes, providing foreground masks and offset vectors. The encoder-decoder structure incorporates Residual Blocks with and without strides for down- and upsampling (ResBlock, ResDown, ResUp), Attentive Spatial Pyramids (ASP) with b dilated branches and SkipFuse Blocks fusing the up-sampled and skipped content. The output size decreases due to valid padding. In-between convolutions Batch Normalization (BN) and Leaky ReLU are integrated. From highest to lowest resolution 32, 64, 128 and 256 channels are used.
Fig. 3: Illustration of the landmark localization process along the coronal axis of a PD-weighted MR volume. In (a) predicted foreground masks for each spherical extent around the ROI are illustrated. In (b) and (c) the magnitudes of the offset vectors and the resulting aggregated heatmap can be seen, respectively. In (c) only a limited region around each condensed heatmap is shown for better visibility.
Fig. 4: Illustrations of the region separator localization process along the coronal axis of a CT volume for every second slice. In (a) the predicted foreground masks for all three separators is color-coded. In (b) magnitudes of the offset vectors, and in (c) the resulting heatmap aggregated along the x- and y-axis are shown.
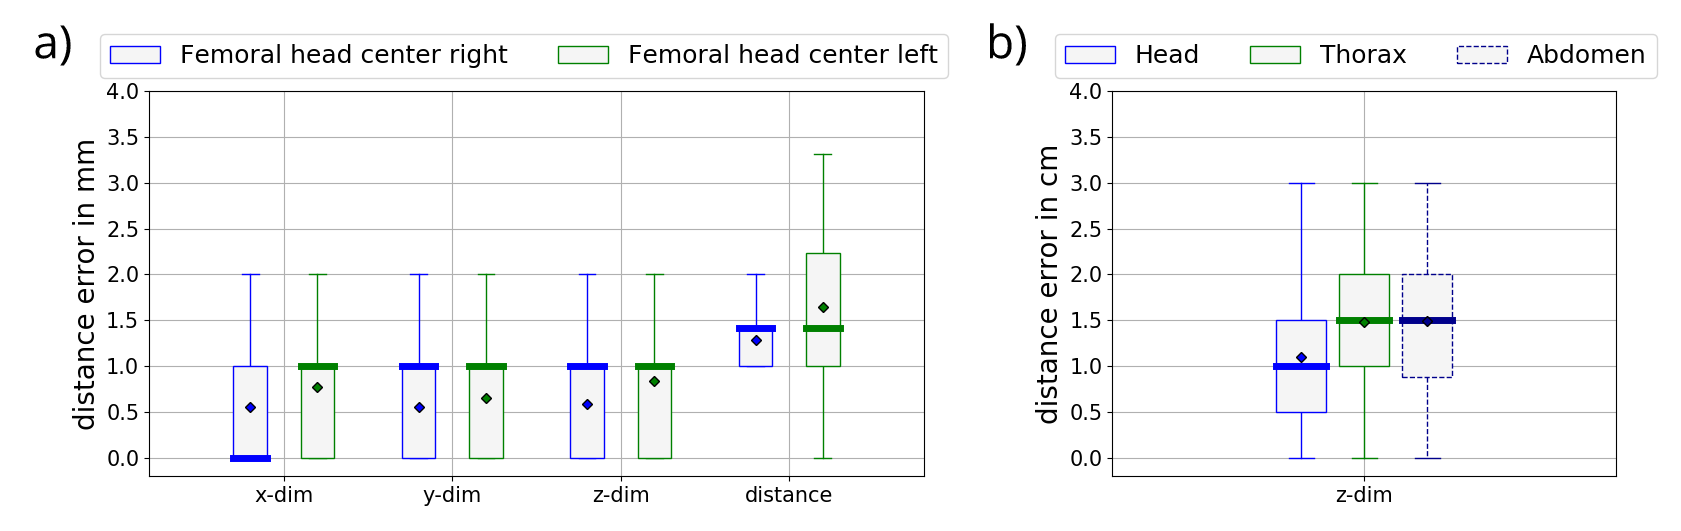
Fig. 5: Boxplots of distance to the ground truth ROI for landmark (a) and region separator (b) localization for a four-fold cross-validation with 80 subjects. Diamonds depict the mean, bars the median of the distance errors. Landmarks are localized well along each axis dimension resulting in a low distance value. Distances for separators deviate from the ground truth by 1.32 cm on average.