3516
Multi-Task Learning: Segmentation as an auxiliary task for Survival Prediction of cancer using Deep Learning1Computational Clinical Imaging Group, Champalimaud Center for the Unknown, Lisbon, Portugal, 2Instituto de Telecomunicações, Instituto Superior Técnico, Lisbon, Portugal, 3Biomedical Engineering and Imaging Sciences, King's College London, London, United Kingdom
Synopsis
This work presents a new method for multi-task learning that aims to increase the performance of the regression task, using the support of the segmentation task. While requiring further validation to guarantee the increase in performance, the preliminary data of this study suggests that using a ”helper” function might increase performance on the main task. In our study, a better performance of the survival prediction model was observed on the validation set when using the multi-task network, compared to a simpler single-task process.
Introduction
Medical imaging offers the unique possibility to augment clinical diagnosis with anatomical, functional and molecular information. This places it as an ideal tool to help target patient treatment to the ongoing phenotype of disease.1 Predicting clinical outcomes from medical images has been one of the main focus of research as the power of prognosis is of great importance, allowing clinicians to better plan treatment. In past years, Deep convolutional neural networks (DCNNs)2-4 have achieved remarkable success across several imaging analysis tasks. In fact, the use of deep learning (DL) has also been applied to survival prediction.5,6 However, one of the main drawbacks for CNNs is the limitation of access to big amounts of data. "Multitask Learning (MTL) is an approach to inductive transfer that improves learning for one task by using the information contained in the training signals of other related tasks".7 MTL has been shown to be helpful when access to data is a limitation.8 This work proposes a new method that uses automatic segmentation to increase the performance of a survival predictor using DL. It allows simultaneous segmentation and clinical outcome prediction of cancer based on MTL using DCNNs.Architecture
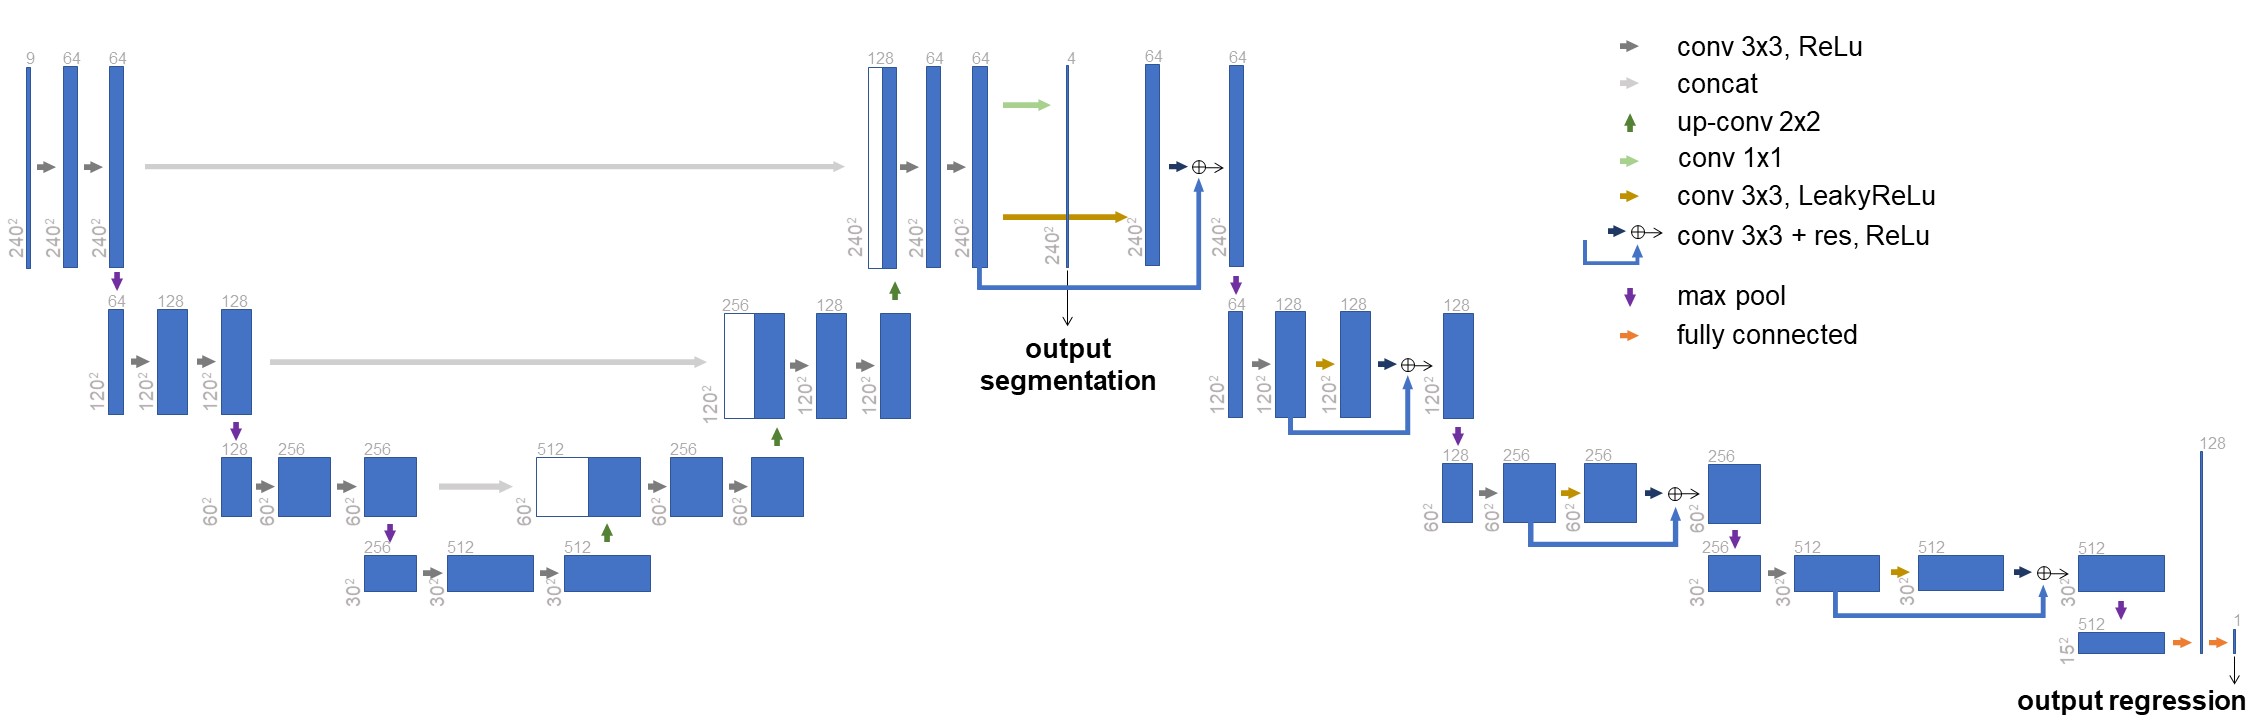
The network used in this work is depicted in Figure 1 (Regression and Segmentation network - RS-net). The first part of this network follows the same structure as the original U-net 9, with minor modifications. The following part of the network (which purpose is to regress days of survival from the input) consists of a series of convolution blocks with residual connections, max pools, terminating with two fully connected layers. The feature map produced just before the last convolution layer of modified U-net is the input to the following network.Training
The imaging data used was FLAIR, T1w, and T1w imaging with contrast agent from the BRATS 2018 challenge, with the respective segmentations for the 3 types of cancerous tissues (the necrotic and non-enhancing tumor core, the peritumoral edema, and the GD-enhancing tumor). For the regression task the survival information of the patients in days was used (163 cases had this information). This dataset was further divided into 90% training set (146 cases) and 10% validation set (17 cases). The input images were the center slice of the tumor (240x240 axial view) and the third slice above and below, for z-axis contextual information. The loss function used was a weighted sum of two different losses: for the segmentation, we used the loss function proposed by Isensee et al.10 - a combination of dice and cross entropy losses; the regression loss was the Root-Mean-Squared Error (RMSE) between the prediction and the ground-truth. To combine the two, the following formula was used:$$\mathcal{L} = 0.1 * \mathcal{L}_{seg} + 0.9 * \mathcal{L}_{regress}$$
The used learning rate was of $$$10^{-5}$$$ with Adam optimiser. Additionaly, data augmentation, L2 regularization, and drop-out (50%) before the last fully connected layer were used.
Experiments
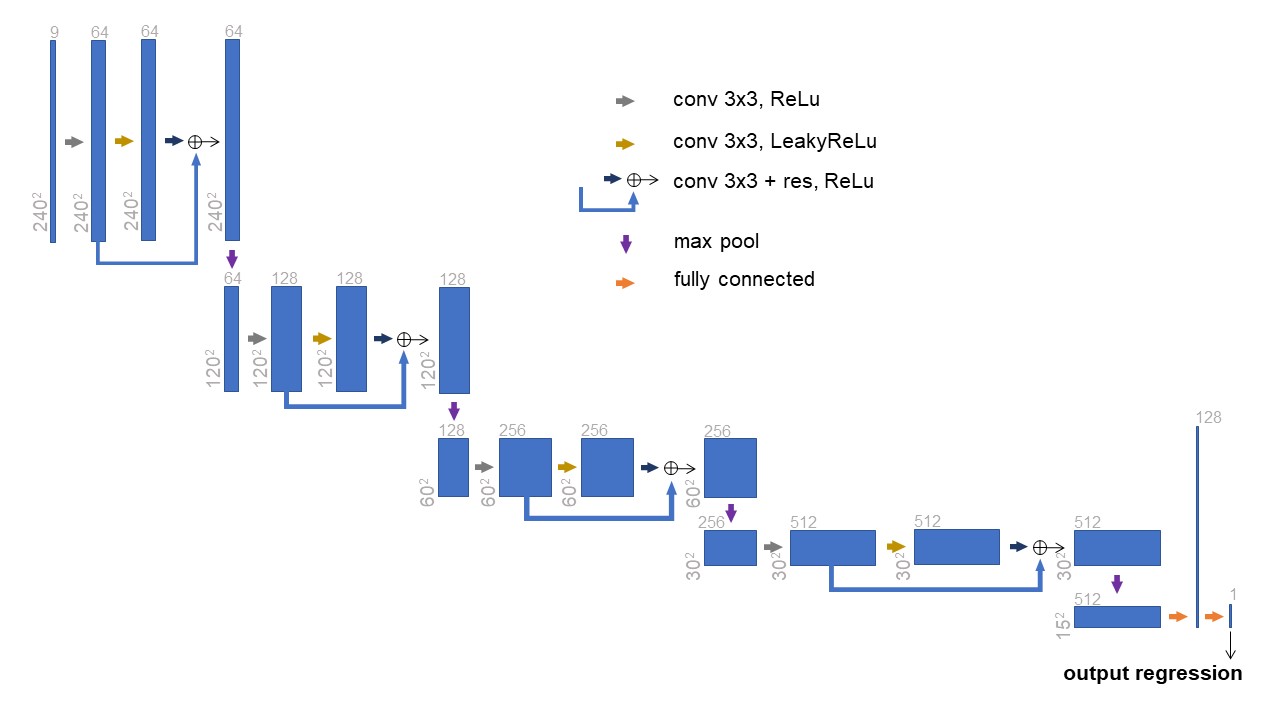
In order to compare the MTL results to a single-task baseline, we performed multiple experiments to access the performance of our method against a simpler network (Regress-net - Figure 2) that only performs the regression task. The loss function to be minimized with this simpler network would be the RMSE loss of the survival prediction against the ground truth. It is important to notice that for all training processes, the patient partitioning was the same, so the models were training in the same data. The first experiment comprised of using the same 9 channels input from the main experiment. For the second experiment we concatenated the ground-truth segmentation to the input tensor, making it a 10 channels input (3 slices in 3 modalities + segmentation). In the third and final experiment, the input tensor was just the segmentation ground-truth (1 channel).Results
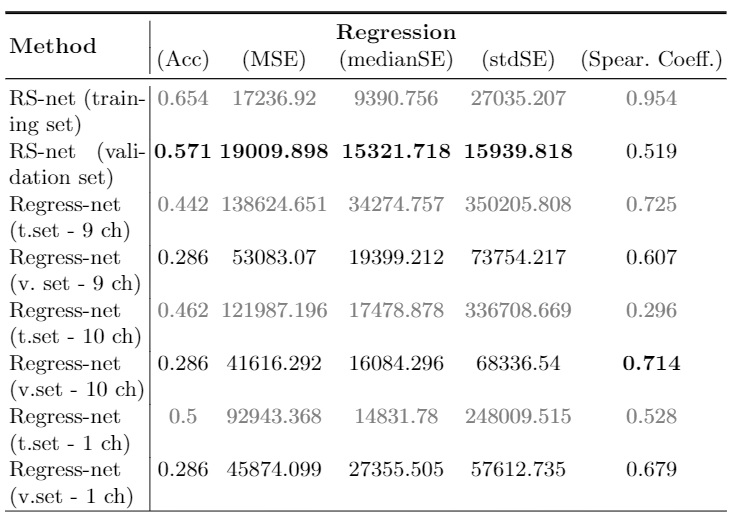
At the end of training, both losses converged and didn't present overfiting. Inference was calculated on both datasets (training and validation) and the results were uploaded to the CBICA’s Image Processing Portal for evaluation. From preliminary results, our method presented an accuracy of 0.571 on the validation set, with 19009.9 mean squarred error, 15321.718 median SE, 15939.818 std SE and Spearman's Coefficient of 0.519 (Table 1). By using Regress-net to perform regression, all the metrics were inferior in performance in the validation set when compared to the proposed MTL method, with the exception of the Spearman Coefficient.Discussion
This work presents a new method for multi-task learning that aims to increase the performance of the regression task, using the support of the segmentation task. While requiring further validation to guarantee the increase in performance, the preliminary data of this study suggests that using a "helper" task might increase performance on the main one. In our study, survival prediction had better performance on the validation set using the multi-task network when compared to simpler single-task one. The main limitation of this work is the lack of validation. Further cross-validation is needed to guarantee the findings, and the use of a completely independent dataset will be helpful to test for the generalization of the method. We intend to continue exploring this methodology, by implementing its 3D version to study how the contextual information of data might help in regression.Acknowledgements
No acknowledgement found.References
1. Lambin P, Van Stiphout RGPM, Starmans MHW, et al.: Predicting outcomes in radiation oncology-multifactorial decision support systems. Nat Rev Clin Oncol.10(1):27-40. (2013) https://doi.org/10.1038/nrclinonc.2012.196
2. LeCun Y, Bengio Y, Hinton G: Deep learning. Nature.521(7553):436-444. (2015) https://doi.org/10.1038/nature14539
3. LeCun Y, Bottou L, Bengio Y, Haffner P: Gradient-Based Learning Applied to Document Recognition. Proc IEEE. (1998) https://doi.org/10.1109/5.726791
4. Krizhevsky A, Sutskever I, Hinton GE: ImageNet Classification with Deep Convolutional Neural Networks. Proceeding NIPS12 Proc 25th Int Conf Neural Inf Process Syst - Vol 1. February:1-9. (2012)
5. Bello GA, Dawes TJW, Duan J, et al.: Deep-learning cardiac motion analysis for human survival prediction. Nature Mach Learn.1:95-104. (2019) https://doi.org/10.1038/s42256-019-0019-2
6. Han I, Kim JH, Park H, et al.: Deep learning approach for survival prediction for patients with synovial sarcoma. Tumor Bio. 95-104. (2018) https://doi.org/10.1177/1010428318799264
7. Caruana R: Multitask Learning. Machine Learning. 28:41-75. (1997)
8. Zhang Y, Yang Q: A Survey on Multi-Task Learning. preprint arXiv:1707.08114. (2018)
9. Ciresan DC, Giusti A, Gambardella LM, Schmidhuber J: Deep Neural Networks Segment Neuronal Membranes in Electron Microscopy Images. Neural Inf Process Syst. 2012:1-9. (2012) https://doi.org/10.1.1.300.2221
10. Isensee F, Petersen J, Klein A, et al.: nnU-Net: Self-adapting Framework for U-Net-Based Medical Image Segmentation. preprint arXiv:1809.10486v1. (2018)
Figures