3512
Test-retest repeatability of convolutional neural networks in detecting prostate cancer regions on diffusion weighted imaging in 112 patients1Department of Biomedical Engineering, Case Western Reserve University, Cleveland, OH, United States, 2Department of Diagnostic Radiology, University of Turku and Turku University Hospital, Turku, Finland, 3Department of Urology, University of Turku and Turku University hospital, Turku, Finland, 4Institute of Biomedicine, University of Turku and Department of Pathology, Turku University Hospital, Turku, Finland, 5Medical Imaging Centre of Southwest Finland, Turku University Hospital, Turku, Finland, 6Department of Radiology, Icahn School of Medicine at Mount Sinai, New York, NY, United States
Synopsis
We evaluated the short-term repeatability of convolutional neural networks (CNNs) in detecting prostate cancer (PCa) using DWI collected from patients who underwent same day test-retest MRI scans. DWI was post-processed using monoexponential fit (ADCm). Two models with similar architecture were trained on test-retest scans and short-term repeatability of network predictions in terms of intra-class correlation coefficient (ICC(3,1)) was evaluated. Although the observed ICC(3,1) was high for CNN when optimized for classification performance, our results suggest that network optimization with respect to classification performance might not yield the best repeatability. Higher repeatability was observed at lower learning rates.
Introduction
Recently, several convolutional neural network (CNN) based deep learning (DL) methods have been developed for cancer detection and diagnosis1–3, especially for prostate cancer (PCa) detection using MRI1,4. However, these methods need to be assessed for their test-retest repeatability to enable wide clinical use. High predictive power from single time point with low test-retest repeatability might be misleading. Recent studies have applied test-retest reliability analysis for feature selection of stable radiomic features5,6 and have also looked at different pre-preprocessing schemes that could affect repeatability of radiomic features7. Although few studies have looked at repeatability of DL predictions8,9, they have trained only a single model and evaluated repeatability on test-retest data. However, in this work, we evaluate test-retest repeatability of CNN predictions on unseen data in the context of PCa detection by training two separate models on test and retest data respectively. Additionally, hyper-parameters of the network (learning-rates, batch-sizes) were varied and analyzed for their effect on repeatability. We used AlexNet10 to evaluate repeatability of CNNs as it is a widely used architecture in the medical imaging community11–13.Methods
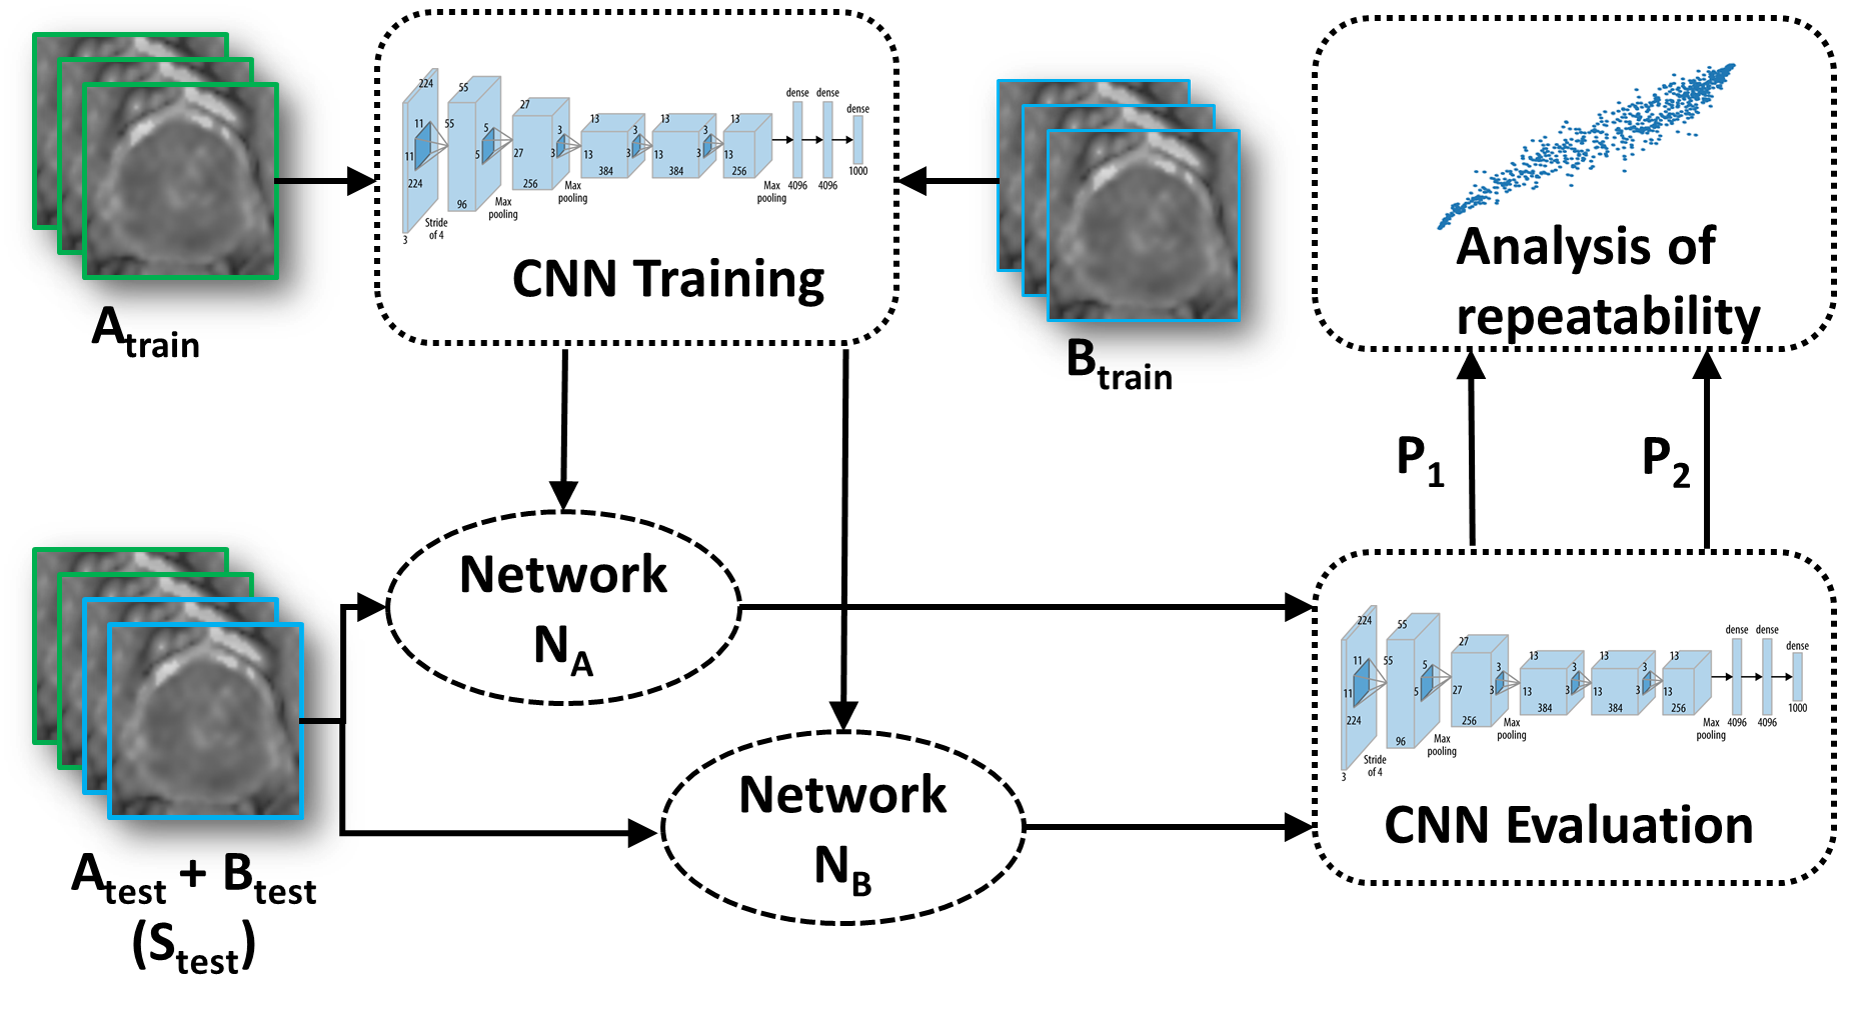
One hundred and twelve patients with PCa scheduled for prostatectomy underwent two prostate 3T MR examinations (SA and SB) performed on the same day approximately 15 minutes apart following repositioning on MR scanner table. Diffusion weighted imaging (DWI) was performed using a single shot spin-echo-based sequence, monopolar diffusion gradient, echo-planar read out with acquisition parameters: TR/TE time (3141/51msec), 12b-values (0,100,300,500,700,900,1100,1300,1500,1700,1900,2000s/mm2), acquisition voxel size (1.16×1.16×5.0mm3) and acquisition time (8.48 minutes). Monoexponential fit (ADCm) of DWI data with 2-b values (0,2000s/mm2) was performed. A radiologist working in consensus with a pathologist annotated cancer regions on MRI data with whole mounts prostatectomy sections as ground truth. The test-retest ADCm maps (SA and SB), were divided into training set (Atrain, Btrain), N=40, validation set (Aval, Bval), N=38, and test set (Atest, Btest), N=34 .ADCm image slices with lesion delineation were marked positive while others were considered as negative samples. Images were cropped to contain only the prostate region and were resized to 224x224 pixels. Augmentations such as random rotation, flipping and cropping were performed on Atrain to increase the size of the data. An AlexNet10 model NA was trained using Adam-optimizer and was optimized for highest Aval AUC across learning-rates (1e-06,5e-06,1e-05,5e-05) and batch-sizes (16,32,64,128,256). Likewise, another model NB was trained on Btrain with same hyper-parameters as NA. The models NA and NB were compared in terms AUC on Atest and Btest respectively. ICC(3,1)14 was evaluated on a combined test set (Stest: Atest+Btest). Figure 1 shows the overall experimental setup of evaluating repeatability.
Results
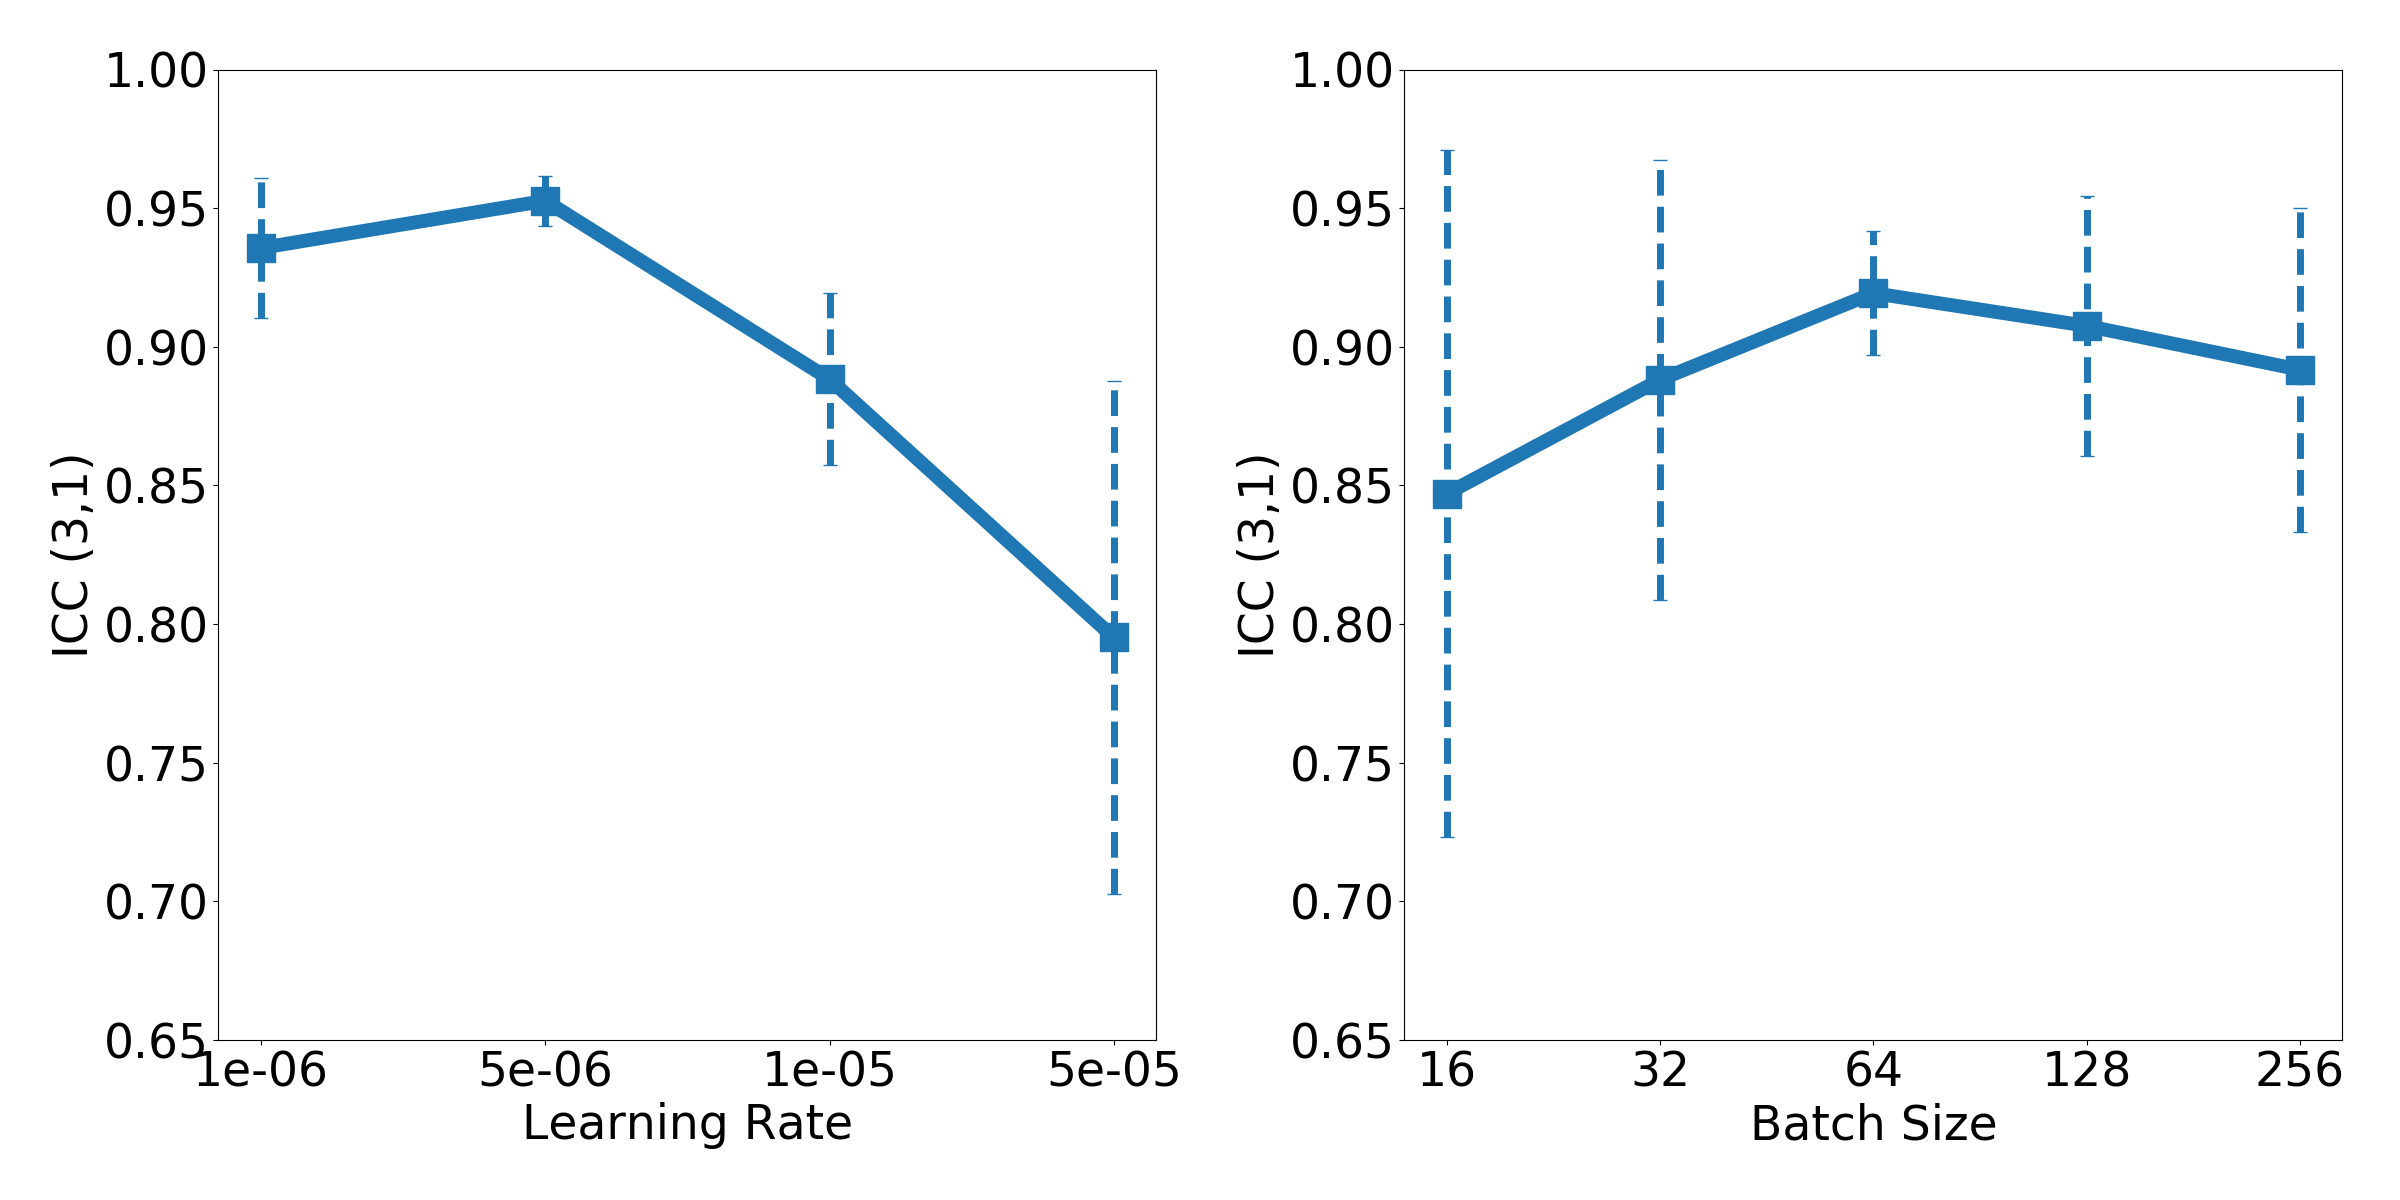
The models NA and NB yielded an AUC (PCa detection) of 0.77; 95% confidence interval (CI): (0.74–0.80) and 0.78; 95% CI: (0.75–0.81) on Atest and Btest, respectively, with optimized learning-rate and batch-size being 1e-05 and 256, respectively. The repeatability, ICC(3,1) between NA and NB model predictions on Stest was found to be 0.88; 95% CI14: (0.86-0.89). Figure 2 shows the ICC(3,1) trends of AlexNet evaluated on Stest for a range of learning-rates and batch-sizes. The ICC(3,1) trends for learning-rates on Stest clearly show that repeatability increases as learning-rate is reduced. Additionally, an intermediate batch-size of 64 yields slightly better repeatability than smaller (16) and larger batch-sizes (256). The best repeatability was obtained between NA* and NB* with learning-rate and batch-size of 5e-05 and 64, respectively, where the ICC(3,1) was found to be 0.97; 95% CI: (0.96-0.98).Discussion
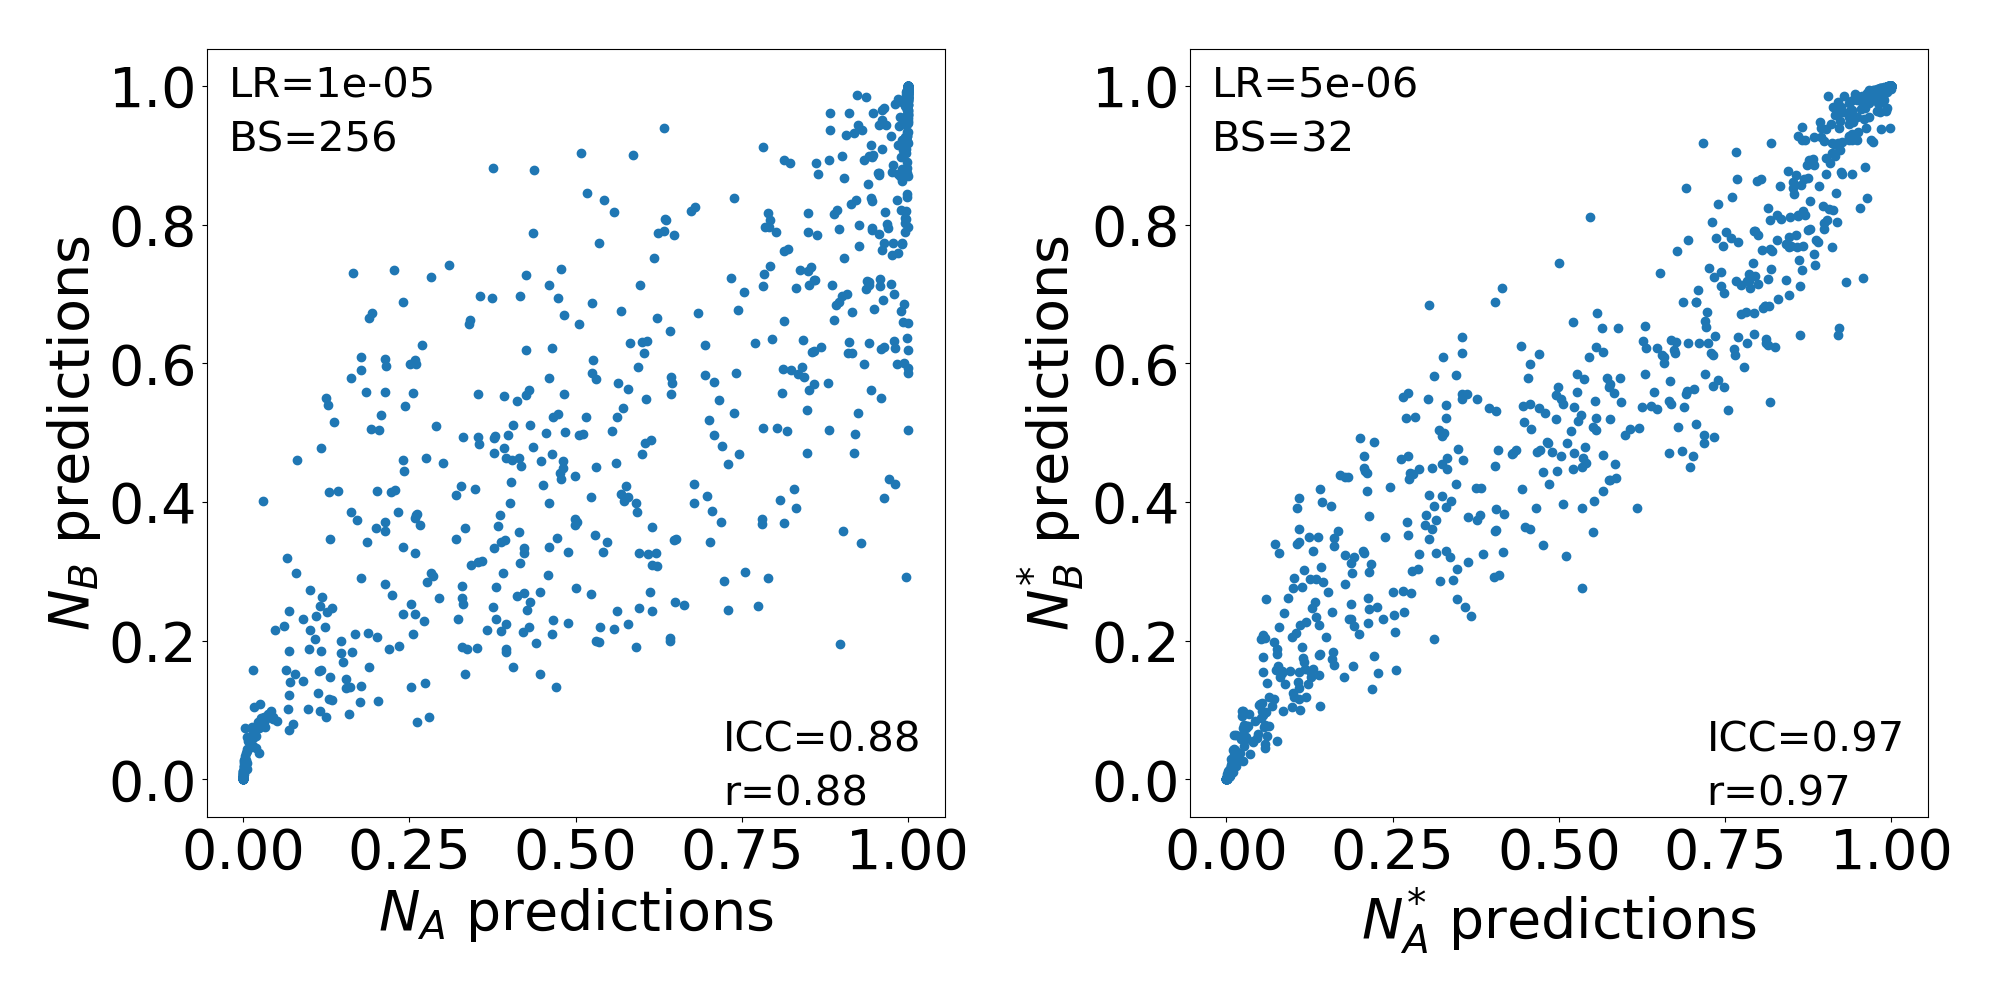
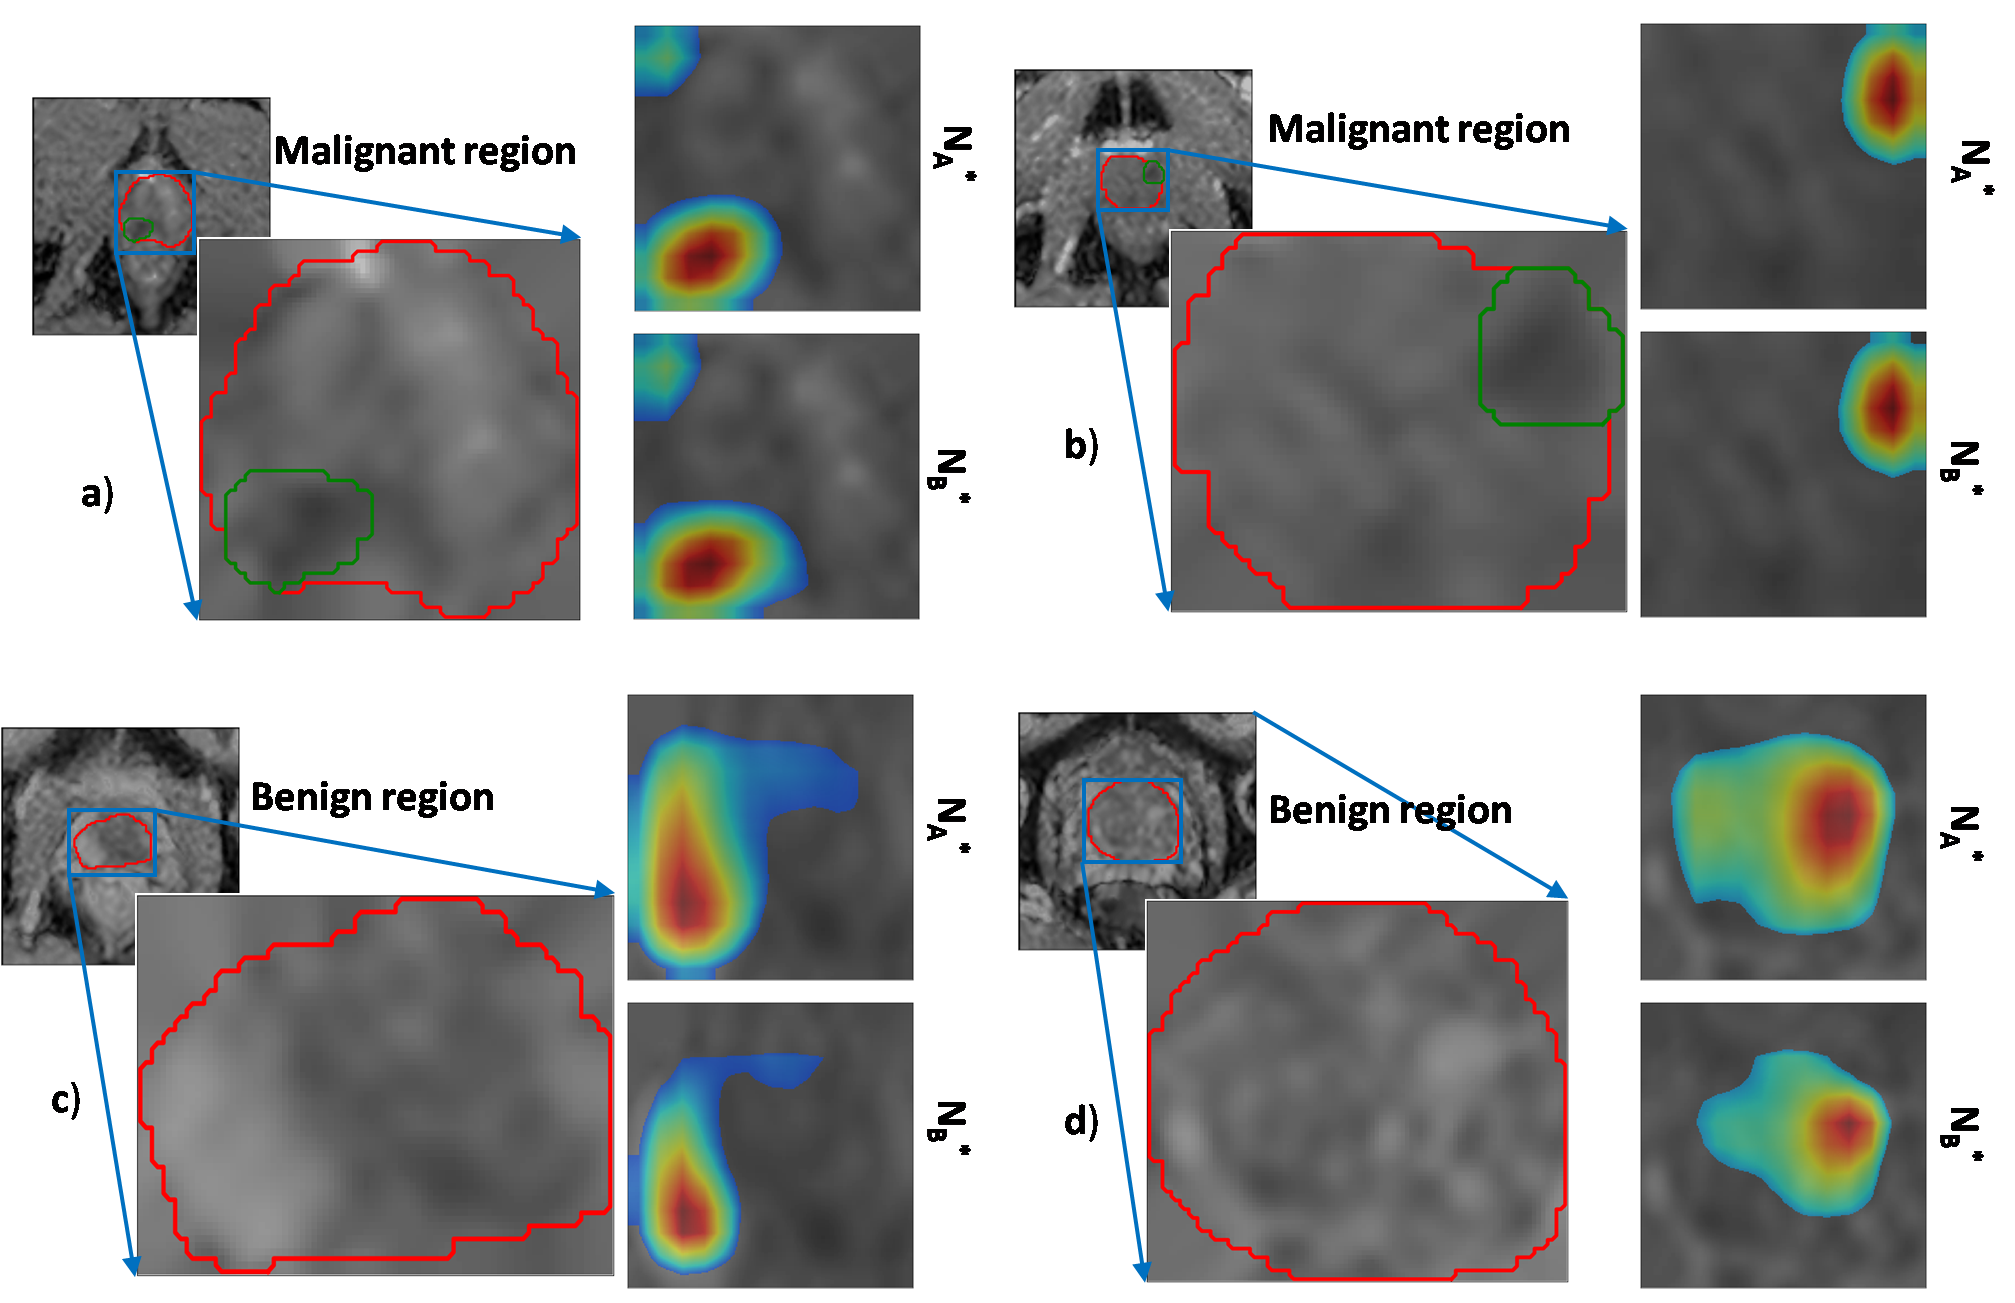
Lower learning-rates may hinder network training convergence, whereas larger learning-rates may result in a sub-optimal solution or unstable learning process. Similarly, very small batch-sizes may lead to noisy gradient updates whereas larger batch-sizes may lead to poor generalization of the network15. In our study, we observed a similar trend in terms of repeatability where larger learning rates led to lower ICC(3,1) score and intermediate batch-size of 64 yielded slightly better repeatability than smaller (16) and larger batch-sizes (256). Most of the previous studies have performed hyper-parameter tuning by optimizing their network to best classification performance8,16. However, our work suggests that optimizing the network with respect to classification performance might not yield the best repeatability. The scatter plot in Figure 3 depicts that predictions between models NA* and NB* (with highest repeatability score) have lower variance compared to predictions between NA and NB (optimized to classification performance). Additionally, the activation maps in Figure 4 show that models NA* and NB* focus on identical regions in making decisions. We acknowledge that our work has limitations. The repeatability of CNNs was analyzed only on ADCm maps, and we have reported only slice-level results and not aggregated patient-level results since all patients in the cohort had PCa with gleason score ≥3+3. The repeatability analysis of other conventionally used CNNs such as VGGNet, ResNet and GoogLeNet, and, hyper-parameters such batch-normalization, drop-outs, activation-units and optimizers are left for future research.Conclusion
Even though CNN (AlexNet) yielded a high ICC(3,1) of 0.88 when optimized for classification performance over a range of hyper-parameters, our results suggest that network optimization with respect to classification performance might not yield the best repeatability. Higher repeatability was observed at lower learning rates.Acknowledgements
Research reported in this publication was supported by the National Cancer Institute of the National Institutes of Health under award numbers 1U24CA199374-01, R01CA202752-01A1R01CA208236-01A1R01 CA216579-01A1R01 CA220581-01A11U01 CA239055-01
National Institute for Biomedical Imaging and Bioengineering 1R43EB028736-01National Center for Research Resources under award number 1 C06 RR12463-01VA Merit Review Award IBX004121A from the United States Department of Veterans Affairs Biomedical Laboratory Research and Development Service
The DOD Prostate Cancer Idea Development Award (W81XWH-15-1-0558). The DOD Peer Reviewed Cancer Research Program (W81XWH-16-1-0329)
The Ohio Third Frontier Technology Validation FundThe Wallace H. Coulter Foundation Program in the Department of Biomedical Engineering and The Clinical and Translational Science Award Program (CTSA) at Case Western Reserve University.
Funding from Instrumentarium Science Foundation, Sigrid Jusélius Foundation, Turku University Hospital, TYKS-SAPA research funds were used to cover the cost of MRI examinations.
References
1. Chen, Q. et al. A Transfer Learning Approach for Malignant Prostate Lesion Detection on Multiparametric MRI. Technol. Cancer Res. Treat. 18, 1533033819858363 (2019).
2. Sumathipala, Y. et al. Prostate cancer detection from multi-institution multiparametric MRIs using deep convolutional neural networks. J Med Imaging (Bellingham) 5, 044507 (2018).
3. Maicas, G., Bradley, A. P., Nascimento, J. C., Reid, I. & Carneiro, G. Pre and post-hoc diagnosis and interpretation of malignancy from breast DCE-MRI. Med Image Anal 58, 101562 (2019).
4. Aldoj, N., Lukas, S., Dewey, M. & Penzkofer, T. Semi-automatic classification of prostate cancer on multi-parametric MR imaging using a multi-channel 3D convolutional neural network. Eur Radiol (2019) doi:10.1007/s00330-019-06417-z.
5. van Timmeren, J. E. et al. Test–Retest Data for Radiomics Feature Stability Analysis: Generalizable or Study-Specific? Tomography 2, 361–365 (2016).
6. Gu, J. et al. Prediction of Immunohistochemistry of Suspected Thyroid Nodules by Use of Machine Learning-Based Radiomics. AJR Am J Roentgenol 1–10 (2019) doi:10.2214/AJR.19.21626.
7. Repeatability of Multiparametric Prostate MRI Radiomics Features | Scientific Reports. https://www.nature.com/articles/s41598-019-45766-z.
8. Cole, J. H. et al. Predicting brain age with deep learning from raw imaging data results in a reliable and heritable biomarker. Neuroimage 163, 115–124 (2017).
9. Hosny, A. et al. Deep learning for lung cancer prognostication: A retrospective multi-cohort radiomics study. PLoS Med 15, (2018).
10. Krizhevsky, A., Sutskever, I. & Hinton, G. E. ImageNet Classification with Deep Convolutional Neural Networks. in Proceedings of the 25th International Conference on Neural Information Processing Systems - Volume 1 1097–1105 (Curran Associates Inc., 2012).
11. Maqsood, M. et al. Transfer Learning Assisted Classification and Detection of Alzheimer’s Disease Stages Using 3D MRI Scans. Sensors (Basel) 19, (2019).
12. Zhang, C. et al. A visual encoding model based on deep neural networks and transfer learning for brain activity measured by functional magnetic resonance imaging. J. Neurosci. Methods 325, 108318 (2019).
13. Wang, S.-H. et al. Alcoholism Identification Based on an AlexNet Transfer Learning Model. Front Psychiatry 10, 205 (2019).
14. Shrout, P. E. & Fleiss, J. L. Intraclass correlations: uses in assessing rater reliability. Psychol Bull 86, 420–428 (1979).
15. LeCun, Y. A., Bottou, L., Orr, G. B. & Müller, K.-R. Efficient BackProp. in Neural Networks: Tricks of the Trade: Second Edition (eds. Montavon, G., Orr, G. B. & Müller, K.-R.) 9–48 (Springer Berlin Heidelberg, 2012). doi:10.1007/978-3-642-35289-8_3.
16. Krois, J. et al. Deep Learning for the Radiographic Detection of Periodontal Bone Loss. Sci Rep 9, (2019).
Figures