3509
Automatic segmentation of dentate nuclei for microstructure assessment: application to temporal lobe epilepsy patients1Department of Electrical, Computer and Biomedical Engineering, University of Pavia, Pavia, Italy, 2Neuroradiology Unit, Brain MRI 3T Research Center, IRCCS Mondino Foundation, Pavia, Italy, 33Queen Square MS Centre, Department of Neuroinflammation, UCL Queen Square Institute of Neurology, Faculty of Brain Sciences, University College London, London, United Kingdom, 4Department of Brain and Behavioral Sciences, University of Pavia, Pavia, Italy, 5UCSF Weill Institute for Neurosciences, Department of Neurology, University of California, San Francisco, CA, United States, 6Department of Clinical Surgical Diagnostic and Pediatric Sciences, University of Pavia, Pavia, Italy, 7Brain Connectivity Center (BCC), IRCCS Mondino Foundation, Pavia, Italy, 8Brain MRI 3T Research Center, IRCCS Mondino Foundation, Pavia, Italy
Synopsis
Dentate nuclei (DN) segmentation is necessary for assessing whether DN are affected by pathologies through quantitative analysis of parameter maps, e.g. calculated from diffusion weighted imaging (DWI). This study developed a fully automated segmentation method using non-DWI (b0) images. A Convolution Neural Network was optimised on heathy subjects’ data with high spatial resolution and was used to segment the DN of Temporal Lobe Epilepsy (TLE) patients, using standard DWI. Statistical comparison of microstructural metrics from DWI analysis, as well as volumes of each DN, revealed altered and lateralised changes in TLE patients compared to healthy controls.
Introduction
Cerebellar nuclei (CN) have a fundamental role in the central nervous system. Indeed, they are the main output channel of the cerebellum 1, but their involvement in pathologies remains unclear. It is possible to study the CN using quantitative magnetic resonance images (MRI) that reflect biophysical properties of tissues. Often it is useful to segment specific regions2 to extract, for example, microstructural parameters from diffusion weighted images (DWI)-derived maps; hence, it is desirable to have segmentations in DWI-space.Manual segmentation is the gold standard method for segmenting the dentate nuclei (DN), i.e. the CN with the largest volume, but it is time-consuming and has high rater-dependent variability. To overcome these limitations, automatic segmentation is desirable.3 In this study, therefore, a method was developed to automatically segment the DN from non-DWI (i.e. b0) images and was applied to DWI-derived maps of patients with Temporal Lobe Epilepsy (TLE).
Methods
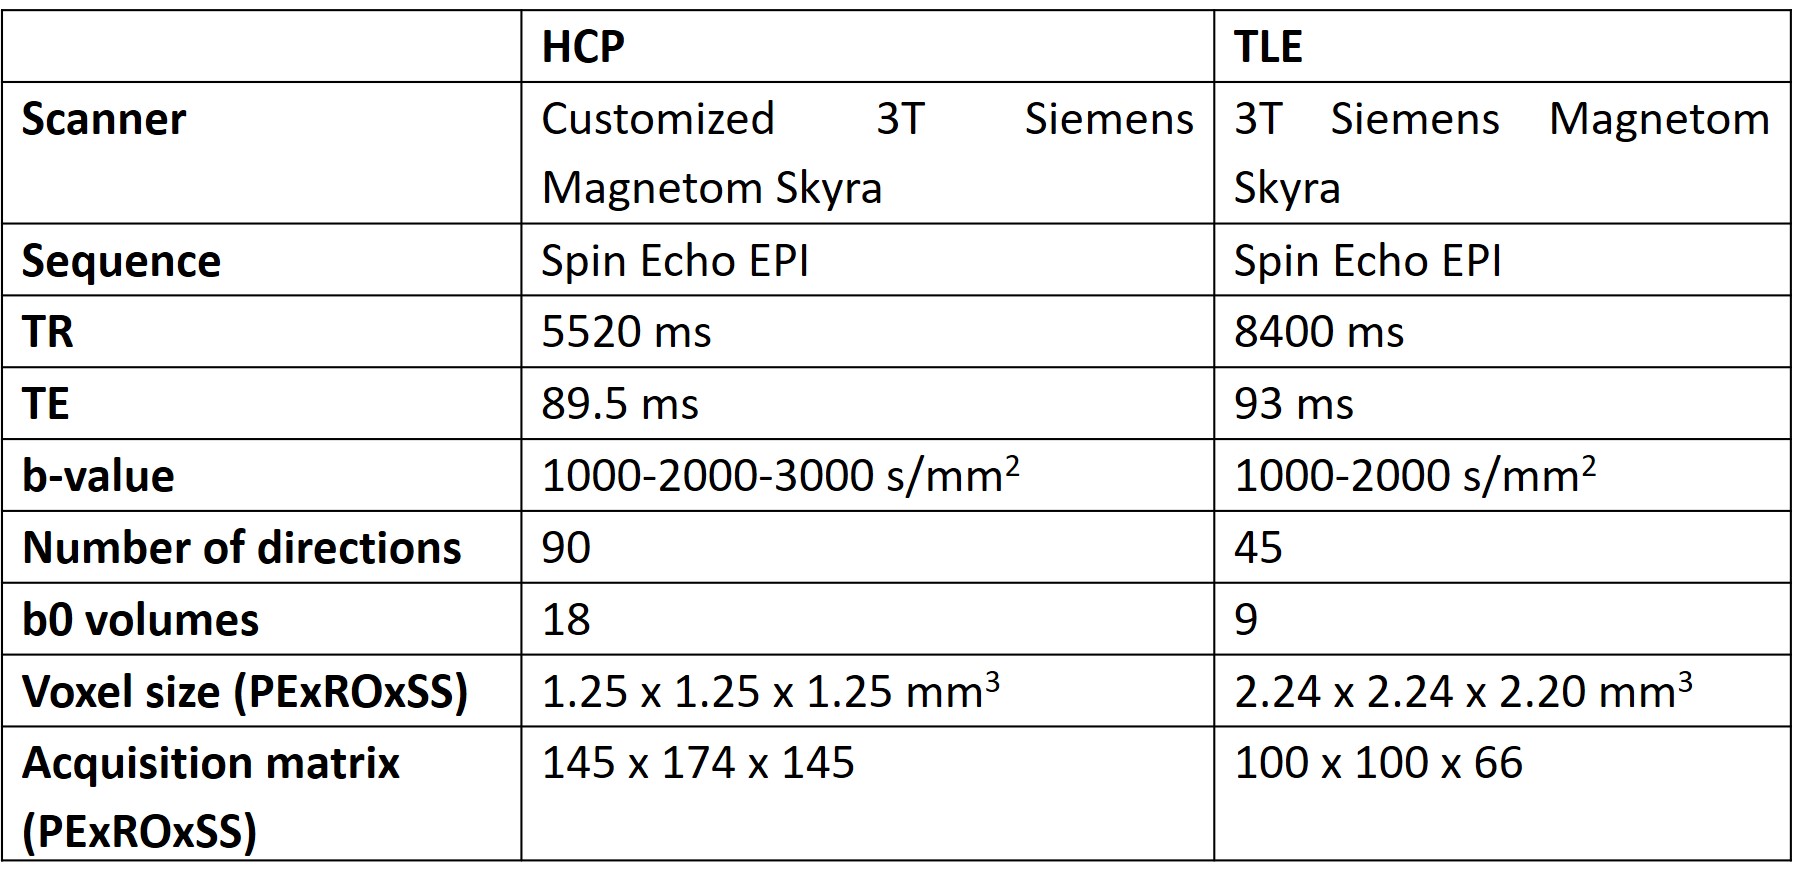
Automatic DN segmentationThe b0s of 76 heathy subjects (43 Females, age 29.41±3.62 y), from the Human Connectome Project (HCP), were manually segmented and considered as ground truth (GT). HCP data were used because of the higher spatial resolution compared to standard research protocols (acquisition parameters in Table 1).
Three automatic segmentation methods were tested: SUIT (A spatially unbiased atlas template of the cerebellum and brainstem), OPAL (Optimized Patch Match for Label fusion) and CNN (Convolution Neural Network).
Performance was tested comparing automatic DN regions against GT using the Dice Similarity Coefficient (DSC), which calculates the overlap between two binary masks.
SUIT is currently the only existing automatic method for DN segmentation and is based on registration to an atlas.4
OPAL is based on Patch Match, a multi-template method that needs a database of b0s and corresponding GTs used as reference templates.5
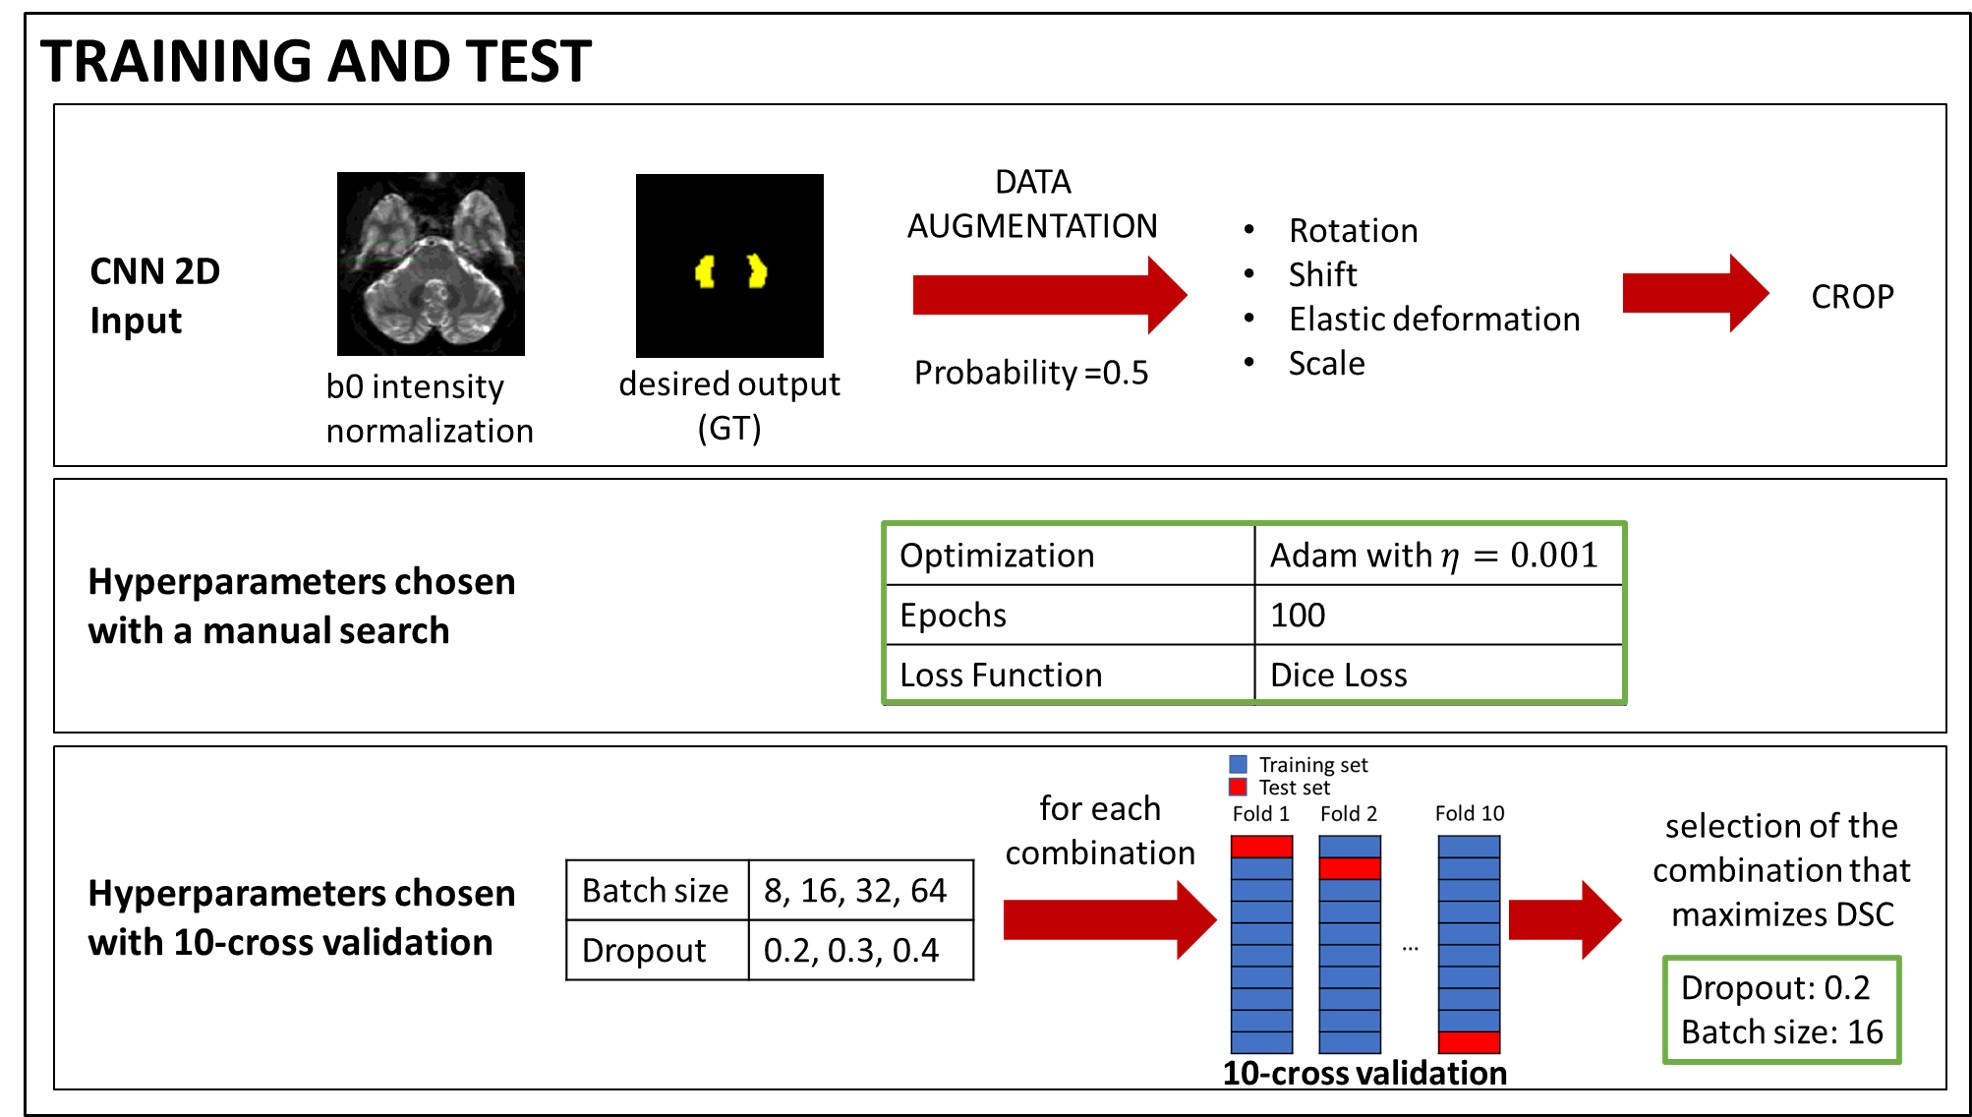
CNN is based on dilated convolutions, which expand receptive fields without increasing the number of parameters. The architecture used here was inspired to that used for spinal cord segmentation6 optimised as reported in Figure 1.
In order to remove false positives, a final step masked the outcome of OPAL and CNN with a region of interest obtained from dilating twice the SUIT segmentation of the DN.
Proof of principle of clinical translation
86 subjects were recruited for a TLE study (Table 1). Subjects were divided in three groups: 34 healthy subjects (17 Females, 32.65±8.46 y), 25 subjects with left-TLE (14 Females, 32.36±11.02 y) and 27 subjects with right-TLE (17 Females, 38.89±9.41 y). The volumes of right and left DN were extracted with the three automated methods, after resampling the TLE b0s to match the HCP-data resolution using FLIRT.7
For each DN, average values obtained from microstructure DWI-derived maps were calculated. These included diffusion tensor metrics (axial diffusivity, AD, radial diffusivity, RD, mean diffusivity, MD and fractional anisotropy, FA) and diffusion kurtosis tensor (axial kurtosis, AK, radial kurtosis, RK, mean kurtosis, MK). Lateralization of volumes and metrics between right and left values was hypothesized and tested using an Asymmetry Index (AI) 8:
$$ AI=(mean(DN right)-mean(DN left))/((mean(DN rigth)+mean(DN left))/2) $$
As the three groups of subjects have a statistically different age, the statistical comparison of the metrics used a general linear model with age as covariate. Instead, as gender and handedness are homogeneous in the three groups, these were not included in the model.
Results and Discussion
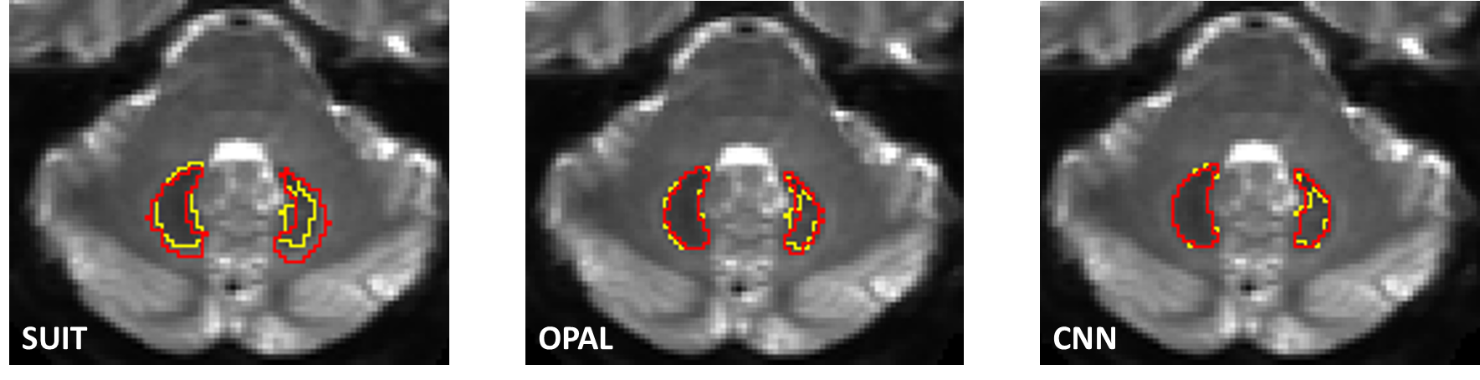
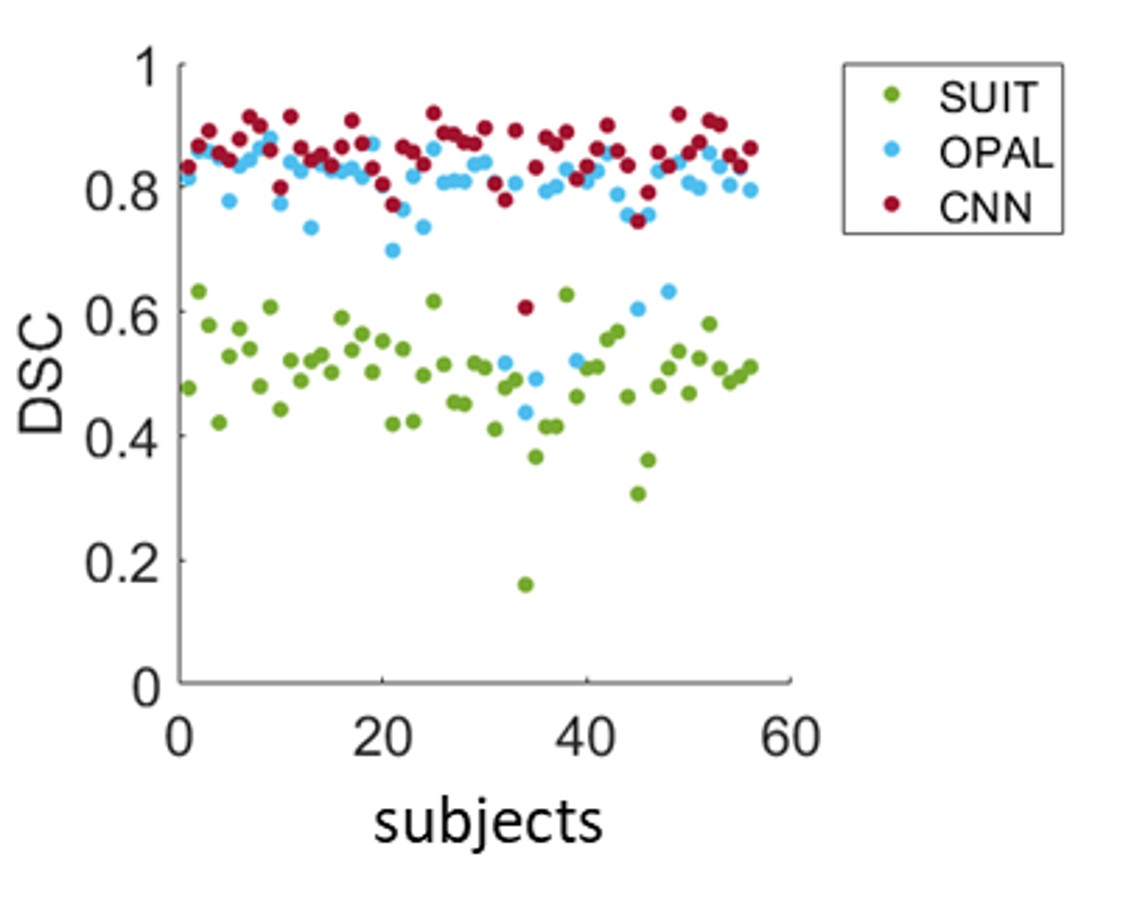
All methods extracted the DN from all b0s of HCP subjects with DSCs equal to: 0.49±0.08 for SUIT, 0.790.1 for OPAL and 0.85±0.05 for CNN. Figure 2 shows examples of segmentations from the methods compared to GT.SUIT is worse than the other methods and the comparison of segmentations obtained with OPAL and CNN revealed a greater precision of CNN (Figure 3).
CNN has a further advantage, given the greater transferability than OPAL. Indeed, OPAL requires that the database of b0s and associated GTs are available to perform the DN segmentations. Contrarily, CNN needs a database only for the training step, but then once the network has learned the association between images and segmentations, the reference images are no longer needed.
The CNN developed here can be useful in clinical studies as there is further evidence of the key role of the cerebellum and CN in supporting healthy brain functioning. Here, the DN of subjects with TLE were segmented. Some studies have shown that patients with TLE have cerebellar atrophy 9 and even that , in animal models of epilepsy, neurostimulation of the CN can block epileptic seizures. 10-11
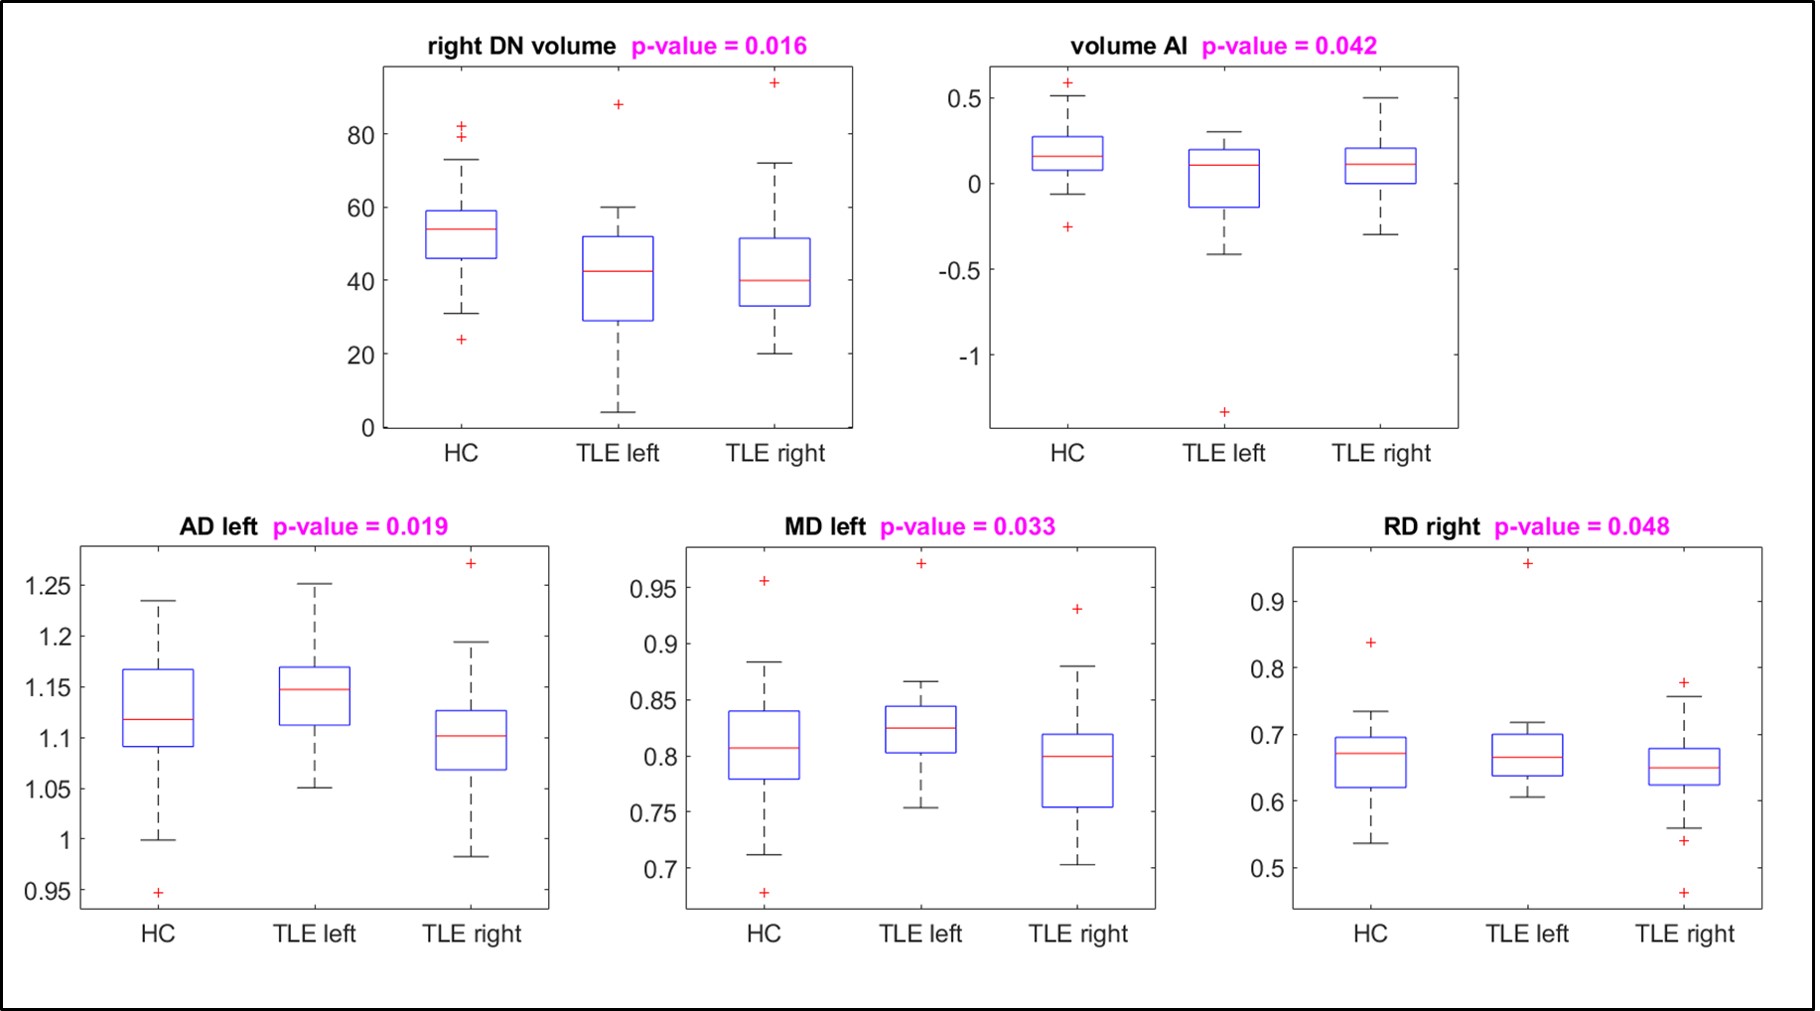
The comparison of quantitative metrics, measured in each DN separately, between patients with right or left-TLE and healthy controls showed that there are statistically significant differences as reported in Figure 4.
Conclusion
We have demonstrated the successful delineation of the DN in health and pathology using a fully automated method. The CNN implemented is able to segment images with a different spatial resolution compared to that of the training set. CNN offers a method that does not need the original training data for transferring to other studies.Acknowledgements
Data were provided by the Human Connectome Project,
WU-Minn Consortium (Principa lInvestigators: David Van Essen and KamilUgurbil;
1U54MH091657) funded by the 16 NIH Institutes and Centers that support the
NIHBlueprint for Neuroscience Research; and by the McDonnell Center for Systems
Neuroscience atWashington University.
3TLE is a multicentric research project granted by
Italian Health Ministry (NET2013-02355313): Magnetic resonance imaging in
drug-refractory temporal lobe epilepsy: standardization of advanced structural
and functional protocols at 3T, to identify hippocampal and extra-hippocampal
abnormalities.
Acknowledgments to the UCL-UCLH Biomedical Research Centre for ongoing
funding; the European Union’s Horizon 2020 research and innovation programme
under grant agreement No. 634541, Spinal Research (UK), Wings for Life
(Austria), Craig H. Neilsen Foundation (USA) (jointly funding the INSPIRED
study), Wings for Life (#169111), the UK Multiple Sclerosis Society (grants
892/08 and 77/2017).
References
1. Sure, D. R. & Culicchia, F. Duus’ Topical Diagnosis in Neurology. Otology & Neurotology 34, (Thieme, 2005).
2. Küper, M., Thürling, M., Maderwald, S., Ladd, M. E. & Timmann, D. Structural and functional magnetic resonance imaging of the human cerebellar nuclei. Cerebellum 11, 314–324 (2012).
3. Despotović, I., Goossens, B. & Philips, W. MRI Segmentation of the Human Brain: Challenges, Methods, and Applications. Comput. Math. Methods Med. 2015, 1–23 (2015).
4. Diedrichsen, J. et al. Imaging the deep cerebellar nuclei: A probabilistic atlas and normalization procedure. Neuroimage 54, 1786–1794 (2011).
5. Giraud, R. et al. An Optimized PatchMatch for multi-scale and multi-feature label fusion. Neuroimage 124, 770–782 (2016).
6. Perone, C. S., Calabrese, E. & Cohen-Adad, J. Spinal cord gray matter segmentation using deep dilated convolutions. Sci. Rep. (2018).
7. Jenkinson, M., Bannister, P., Brady, J. M. and Smith, S. M. Improved Optimisation for the Robust and Accurate Linear Registration and Motion Correction of Brain Images. Neuroimage 17(2), 825–841 (2002).
8. Bonekamp, D. et al. Diffusion tensor imaging in children and adolescents: Reproducibility, hemispheric, and age-related differences. Neuroimage 34, 733–742 (2007).
9. Hermann, B. P., Bayless, K., Hansen, R., Parrish, J. & Seidenberg, M. Cerebellar atrophy in temporal lobe epilepsy. Epilepsy Behav. 7, 279–287 (2005).
10. Krook-Magnuson, E., Szabo, G. G., Armstrong, C., Oijala, M. & Soltesz, I. Cerebellar directed optogenetic intervention inhibits spontaneous hippocampal seizures in a mouse model of temporal lobe epilepsy. eNeuro 1, (2014).
11. Kros, L. et al. Cerebellar output controls generalized spike-and-wave discharge occurrence. Ann. Neurol. 77, 1027–1049 (2015).
Figures