3507
Joint Reconstruction of Multiparameter MRI Images for Imaging Intratumoral Subpopulations1Electrical Engineering, University of South Florida, Tampa, FL, United States, 2Cancer Physiology, Moffitt Cancer Research Center, Tampa, FL, United States
Synopsis
Multispectral analysis of multiparametric MRI (mpMRI) images is being explored as an approach to objectively quantify intratumoral heterogeneity. However, acquisition of multiple co-registered parameters maps such as T1, T2, T2* and ADC for this task can be time-consuming. We propose a joint reconstruction method that exploits shared structural information between co-registered MRI parameter maps that provides high similarity between multispectral clusters defined on parameter maps from undersampled data and the ground truth fully-sampled maps of M0, T1, T2 and T2*.
Purpose
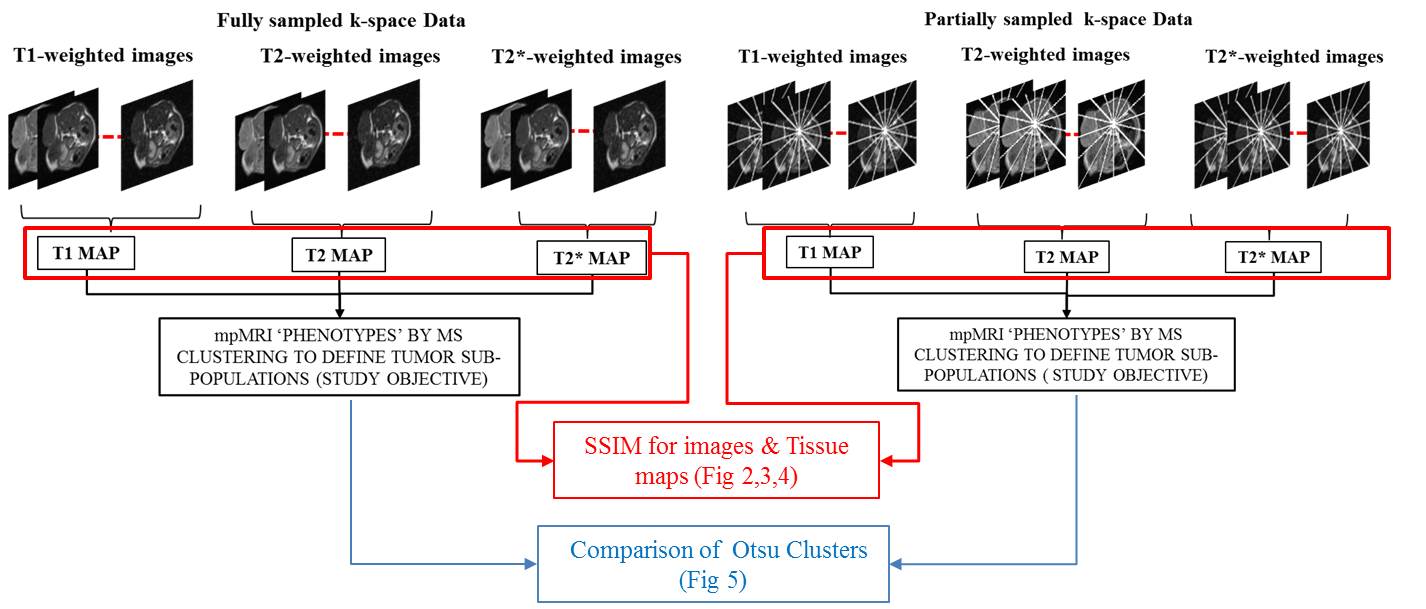
In the early years of the current era of precision medicine, the envisioned role for imaging was to provide biomarkers of the presence of specific molecular targets in the tumor to guide choice of therapies. It is now recognized that intratumoral heterogeneity of microenvironments and tumor phenotypes, and the interrelationships between the two, plays a major role in treatment failure and the development of resistant clones [1]. In this scenario, a meaningful role for biomedical imaging is to provide objective measures of tumor heterogeneity to guide adaptive therapy regimens [2]. Multispectral analysis of multiparametric MRI (mpMRI) images has been utilized to objectively segment images into tissue types [3], for differential diagnosis [4], and for segmentation of tumors on the basis of response to therapies [5] or as predictors of patient outcomes [6]. MRI offers excellent soft-tissue contrast and the option of varying the nature of observed contrast between tissues, such as on T1-weighted (T1W), T2-weighted (T2W), and T2*-weighted (T2*W) scans. Co-registered T1W, T2W and T2*W images can be thought of as constituting multiple ”color” channels between which intensity and contrast information varies but structural content is shared. Unlike in multi-color optical imaging, mpMRI “channels” are typically acquired sequentially, which increases the overall time a subject must spend in the scanner. This is especially so when quantitative maps of T1, T2 and T2*, rather than just T1W, T2W and T2*W images, are desired for quantitative comparisons between patients and scan dates. Accelerated schemes for acquiring and reconstructing MRI images in a task-specific manner are therefore highly desirable. Here we present an approach to jointly reconstruct maps of T1, T2* in-phase (T2*Win), and T2* out-of-phase (T2*Wout), by reference to a series of co-registered fully-sampled T2W images. Our study hypothesis is that structural information contained in fully-sampled T2W images can inform the reconstruction of a series of co-registered under-sampled T1W, T2*Win, and T2*Wout such that intratumoral subpopulations identified by objective multispectral clustering on fully-sampled data can be reproduced on the undersampled reconstructions using substantially less data.Methods
Six mice bearing subcutaneously implanted Lewis lung carcinoma tumors were imaged on a Bruker Biospec at 4.7 T, and the following co-registered axial sequences were acquired: T2 Map (multi-echo spin-echo), in- and out-of-phase T2* maps (multi-echo gradient-echo), T1 Map (variable TR), ADC map (b = 100, 500, 700 s/mm2), and 3D GRE T1-weighted DCE-MRI series. The task is to reconstruct the set of undersampled T1w,T2w, T2*w in-phase and out-of-phase images u from k-space samples acquired below Nyquist Rate. For this underdetermined system of equations an objective function was formulated and subjected to constraints derived from a priori information. The objective function to reconstruct the T1w images is defined in Equation 1, and for reconstructing the T2w, T2*w in-phase and out-of-phase images is given in Equation 2.minimize w║u║JTV s.t. u = M0(1- exp(-TR/T1) ), S(F(u))=f (1)
minimize w║u║JTV s.t. u = M0(exp(-TE/T2) ), S(F(u))=f (2)
Here, u is the set of L images of size M x N, f is the k-space data of size M x N x L. S is the subsampling mask used for all the L k-space; TR is the Repetition time, TE is the echo time; F is the Fourier Transform Operator, and ║u║JTV represents the Joint Total Variation of the image u, and w represents the weighing factor identified from the structures in a fully-sampled T2w image [7]. The objective function is solved iteratively using the Alternating Direction Method of Multiplier (ADMM) algorithm [8]. The parameter maps M0 and T1/T2/T2* are optimized at each iteration. The tissue parameters M0 and T1/T2/T2* thus reconstructed are subjected to Otsu clustering [9].
Results
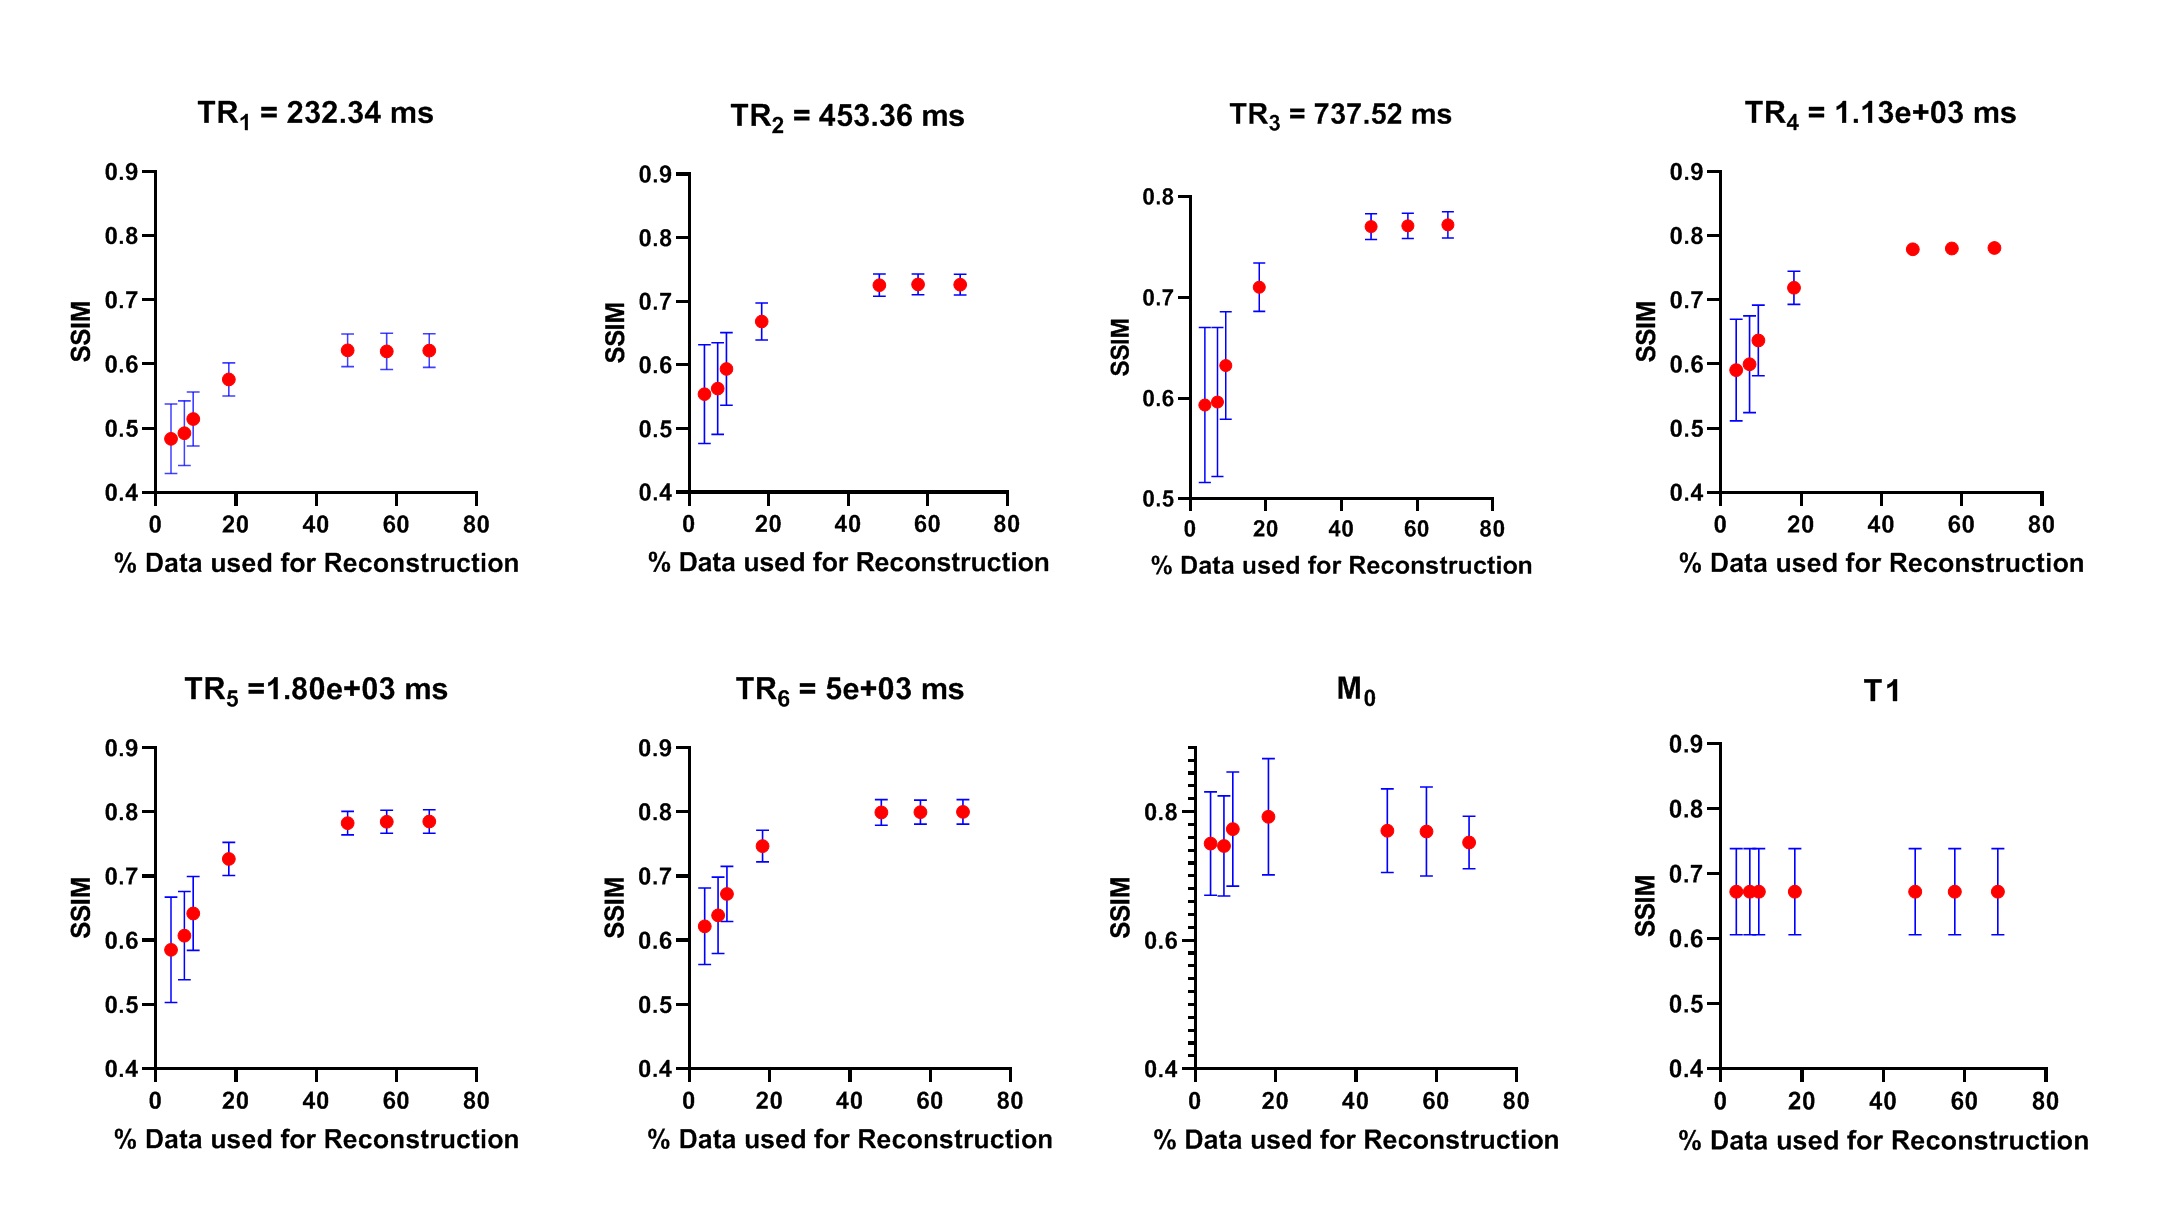
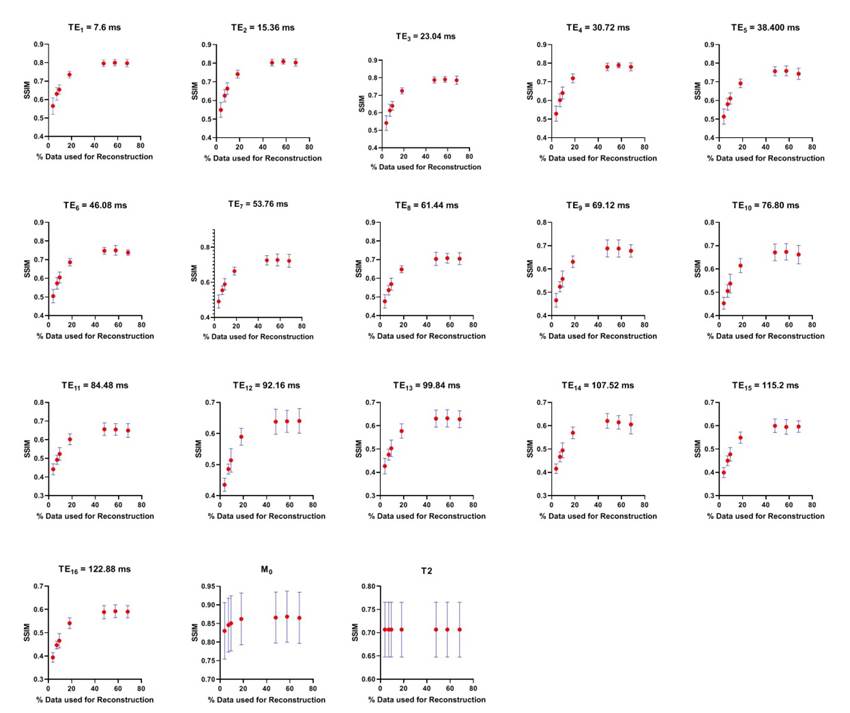
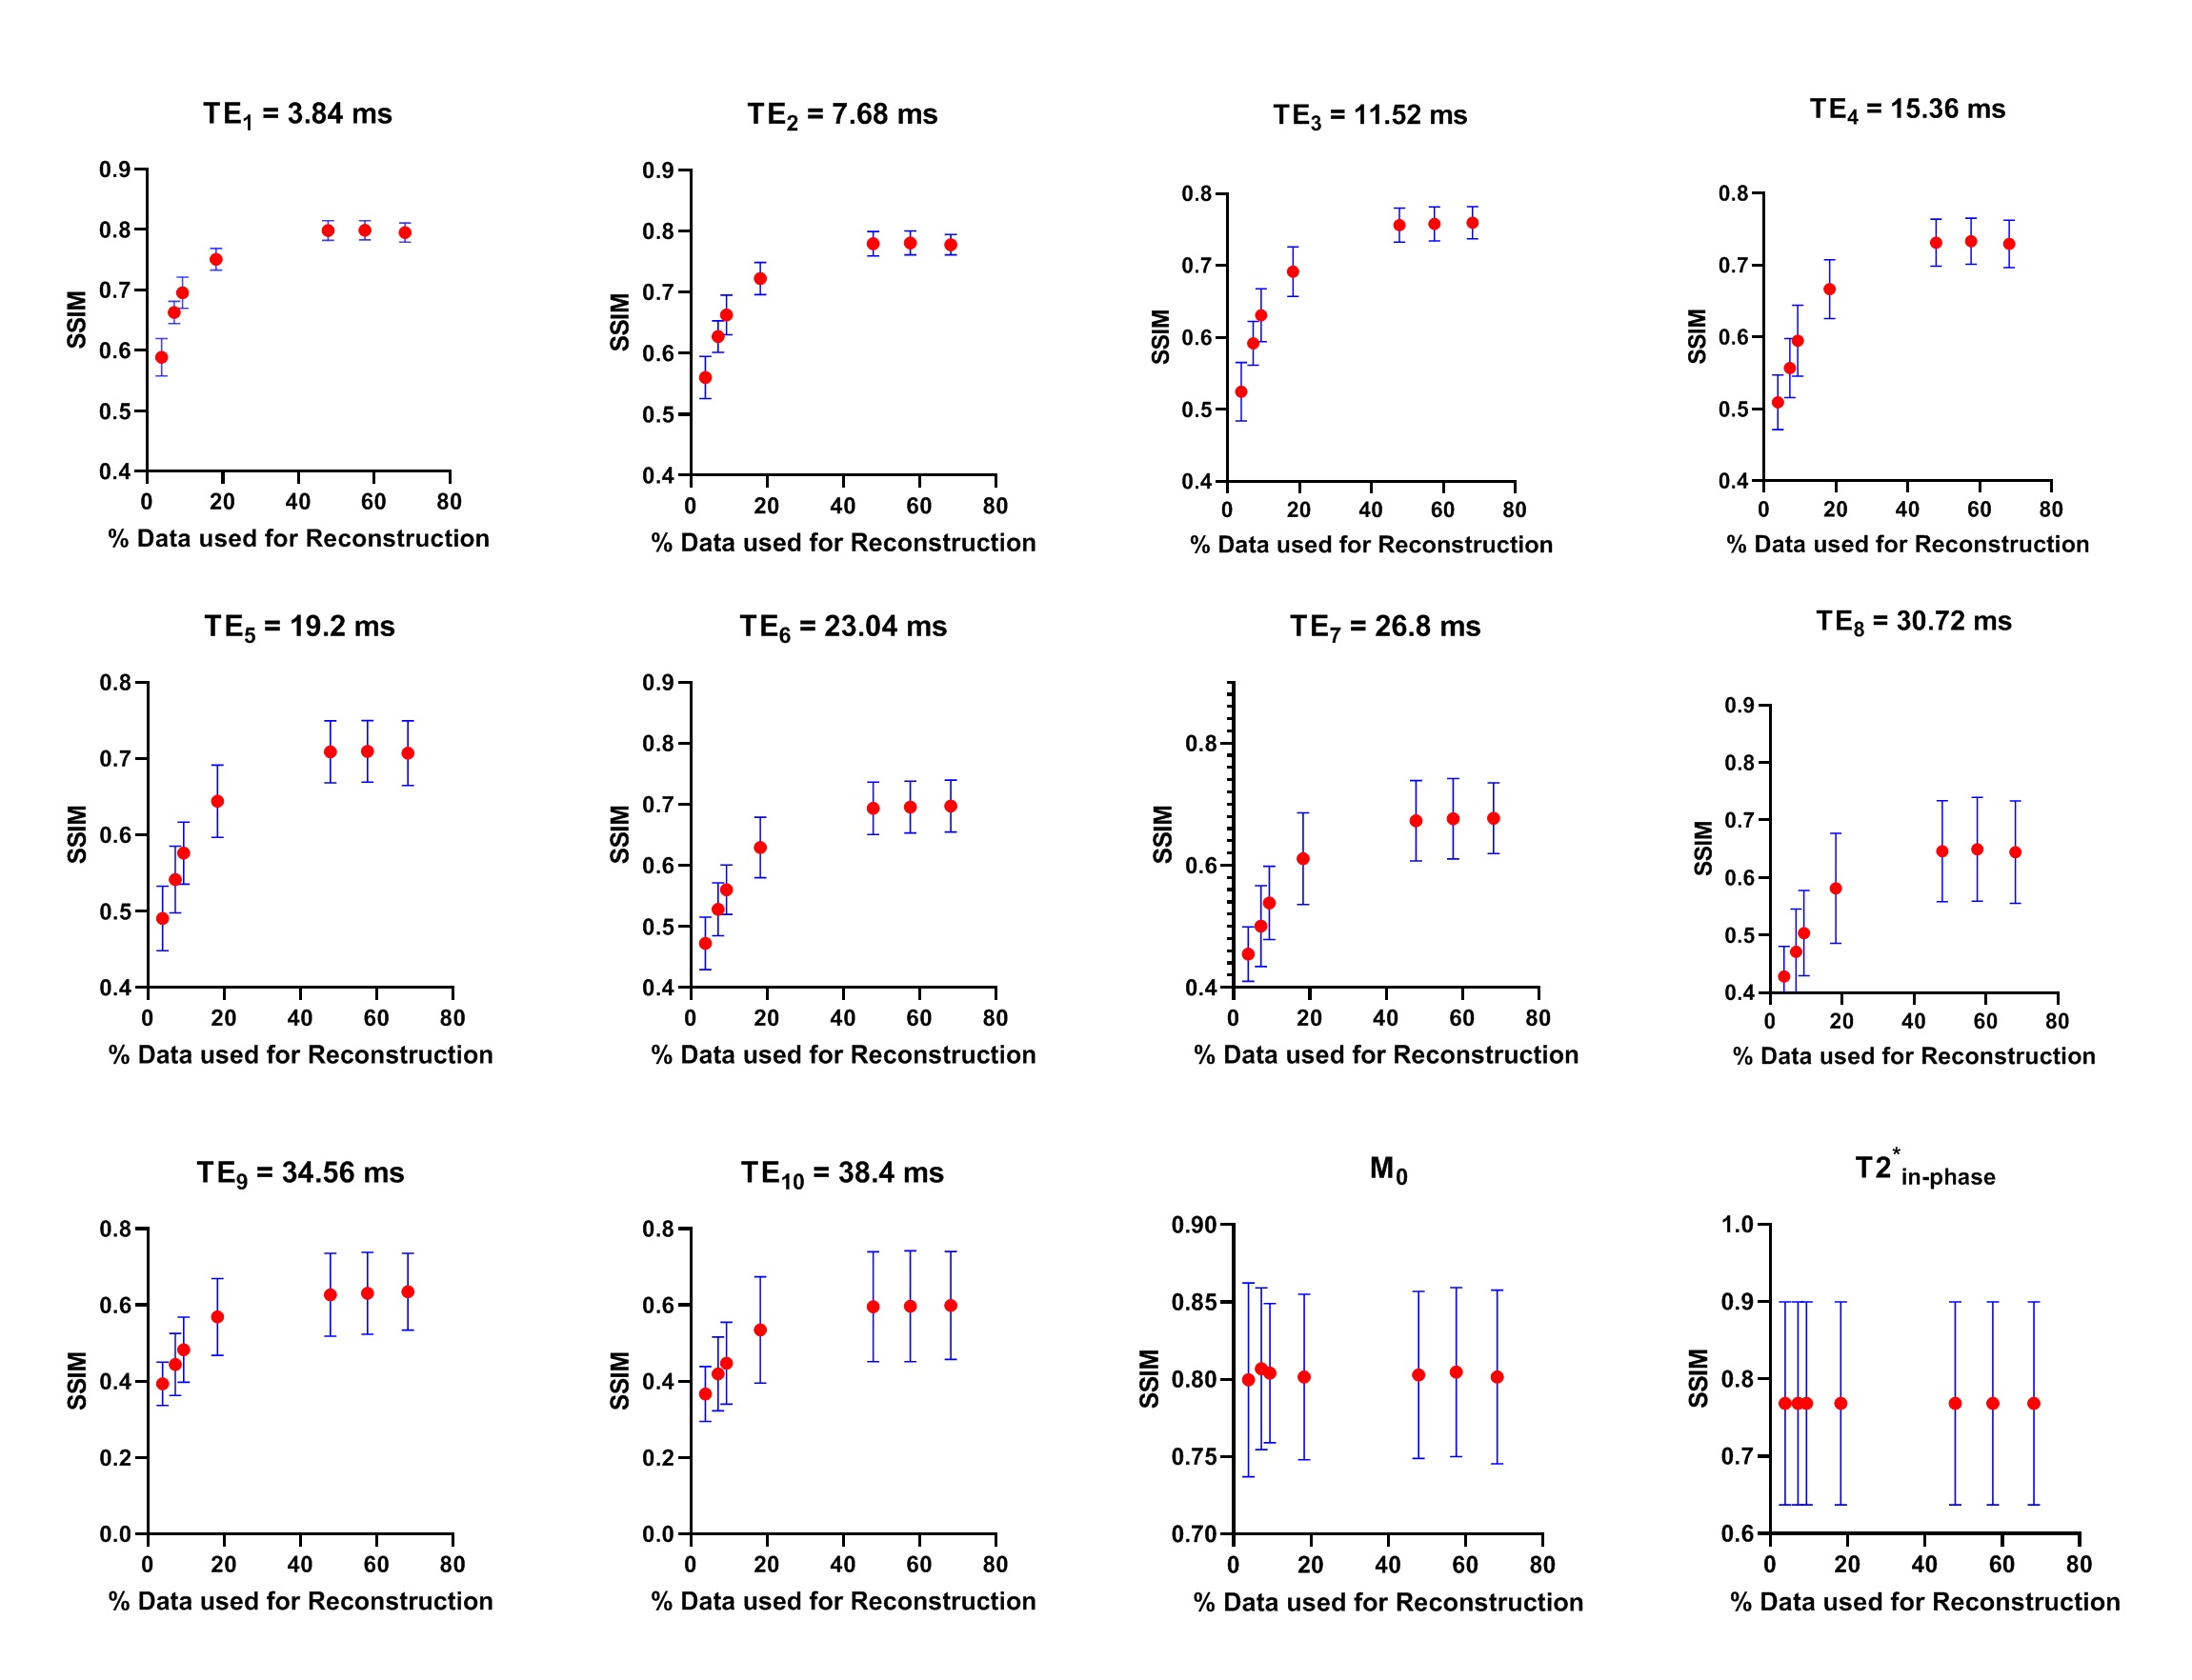
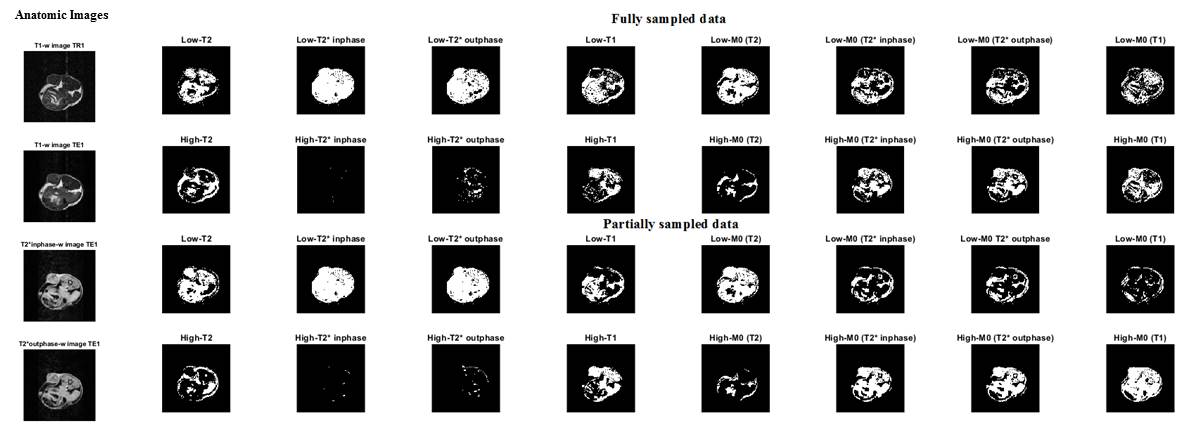
Figure 2, 3 and 4 show the Structural Similarity Index (SSIM) [10] when images and parameter maps reconstructed from undersampled data and fully-sampled data are compared. The x-axis is the % of the data used for the reconstruction and the y-axis shows the corresponding SSIM values. From figures 2, 3 and 4 it is observed that SSIM values predictably improve as the percentage of the data used for reconstruction increases. Interestingly, high SSIM values are achieved for the M0, T1, T2 and T2* maps even with 5% of the sampled k-space data. Figure 5 depicts the intratumoral clusters in M0, T1, T2 and T2* maps computed from undersampled data vs. from fully-sampled data.Discussion & Conclusions
The high similarity between parameter maps computed from just 5% of the data vs. maps from fully-sampled data (Figure 2, 3 and 4) supports our hypothesis that shared structural similarity between co-registered T1w, T2W and T2*W images can be exploited to significantly accelerate parameter mapping. Our goal is to objectively identify intratumoral multispectral clusters that may correspond to distinct tumor subpopulations, and a significant similarity was achieved between Otsu clusters identified on M0, T1, T2 and T2* maps computed using ~20% data vs. ground truth maps (Figure 5). We are working on strategies to optimize the reconstruction algorithm, and are exploring non-identical sampling patterns for the multiple echoes/repetitions to decrease the k-space data required to compute multispectral clusters reflecting tumor heterogeneity.Acknowledgements
No acknowledgement found.References
1. Gatenby RA, Zhang J, Brown JS. First Strike-Second Strike Strategies in Metastatic Cancer: Lessons from the Evolutionary Dynamics of Extinction. Cancer Res. 2019;79(13):3174-3177.
2. West JB, Dinh MN, Brown JS, Zhang J, Anderson AR, Gatenby RA. Multidrug Cancer Therapy in Metastatic Castrate-Resistant Prostate Cancer: An Evolution-Based Strategy. Clin Cancer Res. 2019;25(14):4413-4421.
3. Vannier MW, Butterfield RL, Jordan D, Murphy WA, Levitt RG, Gado M. Multispectral analysis of magnetic resonance images. Radiology 154:221-224, 1985.
4. Taxt T, Lundervold A, Fuglaas B, Lien H, Abeler V. Multispectral analysis of uterine corpus tumors in magnetic resonance imaging. Magnetic Resonance in Medicine 23:55-76, 1992.
5. Carano RA, Ross AL, Ross J, Williams SP, Koeppen H, Schwall RH, Van Bruggen N. Quantification of tumor tissue populations by multispectral analysis. Magnetic Resonance in Medicine 51:542-51, 2004.
6. Stringfield O, Arrington JA, Johnston SK, Rognin NG, Peeri NC, Balagurunathan Y, Jackson PR, Clark-Swanson KR, Swanson KR, Egan KM, Gatenby RA, Raghunand N. Multiparameter MRI Predictors of Long-Term Survival in Glioblastoma Multiforme. Tomography 5:135-144, 2019.
7. M. J. Ehrhardt and M. M. Betcke. Multicontrast MRI reconstruction with structure-guided total variation. SIAM Journal on Imaging Sciences, 9(3):1084–1106, 2016.
8. Boyd S, Parikh N, Chu E, Peleato B, Eckstein J, et al. Distributed optimization and statistical learning via the alternating direction method of multipliers. Foundations and Trends in Machine learning, 3(1):1–122, 2011.
9. Otsu N. A threshold selection method from gray-level histograms. IEEE Trans Systems Man Cybernetics. 1979;9:62-6.
10. Zhou, W., A. C. Bovik, H. R. Sheikh, and E. P. Simoncelli. "Image Quality Assessment: From Error Visibility to Structural Similarity." IEEE Transactions on Image Processing. Vol. 13, Issue 4, April 2004, pp. 600–612.
Figures