3504
Evaluation of point-spread-function and signal-to-noise ratio in highly-accelerated Compressed Sensing-SENSE (CS-SENSE) and SENSE MRI1F.M. Kirby Research Center for Functional Brain Imaging, Kennedy Krieger Institute, Baltimore, MD, United States, 2The Russell H. Morgan Department of Radiology and Radiological Sciences, Johns Hopkins University School of Medicine, Baltimore, MD, United States, 3Department of Biomedical Engineering, Johns Hopkins University School of Medicine, Baltimore, MD, United States
Synopsis
We seek to experimentally evaluate the point-spread-function (PSF) and signal-to-noise ratio (SNR) in sequences accelerated using conventional SENSE and the recently developed Compressed Sensing-SENSE (CS-SENSE) with acceleration-factors (R) ranging from 0 to 28. Both CS-SENSE and SENSE had little effect on the PSF in the tested 3D turbo-spin-echo (TSE) sequences. CS-SENSE showed preserved SNR-per-unit-time even when R=28 (compared to R=0), while SENSE reduced SNR-per-unit-time significantly when R≥4. Fold-over artifacts were seen on SENSE images with R≥8, but not on CS-SENSE images for R=0-28. Overall, CS-SENSE seems to show clear advantages compared to SENSE, especially with high acceleration-factors.
INTRODUCTION
Parallel-imaging methods can significantly speed up MRI data acquisition, which has a fundamental impact on the application of various MRI sequences. The SENSitivity Encoding (SENSE)1 technique has become one of the most commonly used parallel-imaging methods on modern clinical MRI systems. Recently, the Compressed Sensing-Sensitivity Encoding (CS-SENSE)2 technique has been developed on clinical 3T MRI scanners, which combines the original SENSE technique with the transform sparsity and compression theory from the Compressed Sensing (CS) framework3 to achieve greater acceleration with less penalties on image quality. Although many studies have demonstrated that CS-SENSE has preserved signal-to-noise ratio (SNR) with increasing acceleration4, few studies have examined the point-spread-function (PSF) in CS-SENSE, especially with high acceleration-factors (R). Here, we aim to experimentally evaluate PSF and SNR in MRI sequences accelerated using SENSE and CS-SENSE with R ranging from 0 to 28. 3D turbo-spin-echo (3D-TSE) is a commonly used T2-weighted sequence, which often requires high R to reduce power deposition from the readout train and to achieve whole-brain coverage with ideal spatial resolution. As the readout echo train length has a fundamental effect on PSF and SNR, two 3D-TSE sequences with short and long echo trains were evaluated. Experiments were performed on phantoms and human brains. The results from this study are expected to provide a guideline for the choice of imaging parameters in highly accelerated SENSE and CS-SENSE MRI sequences.METHODS
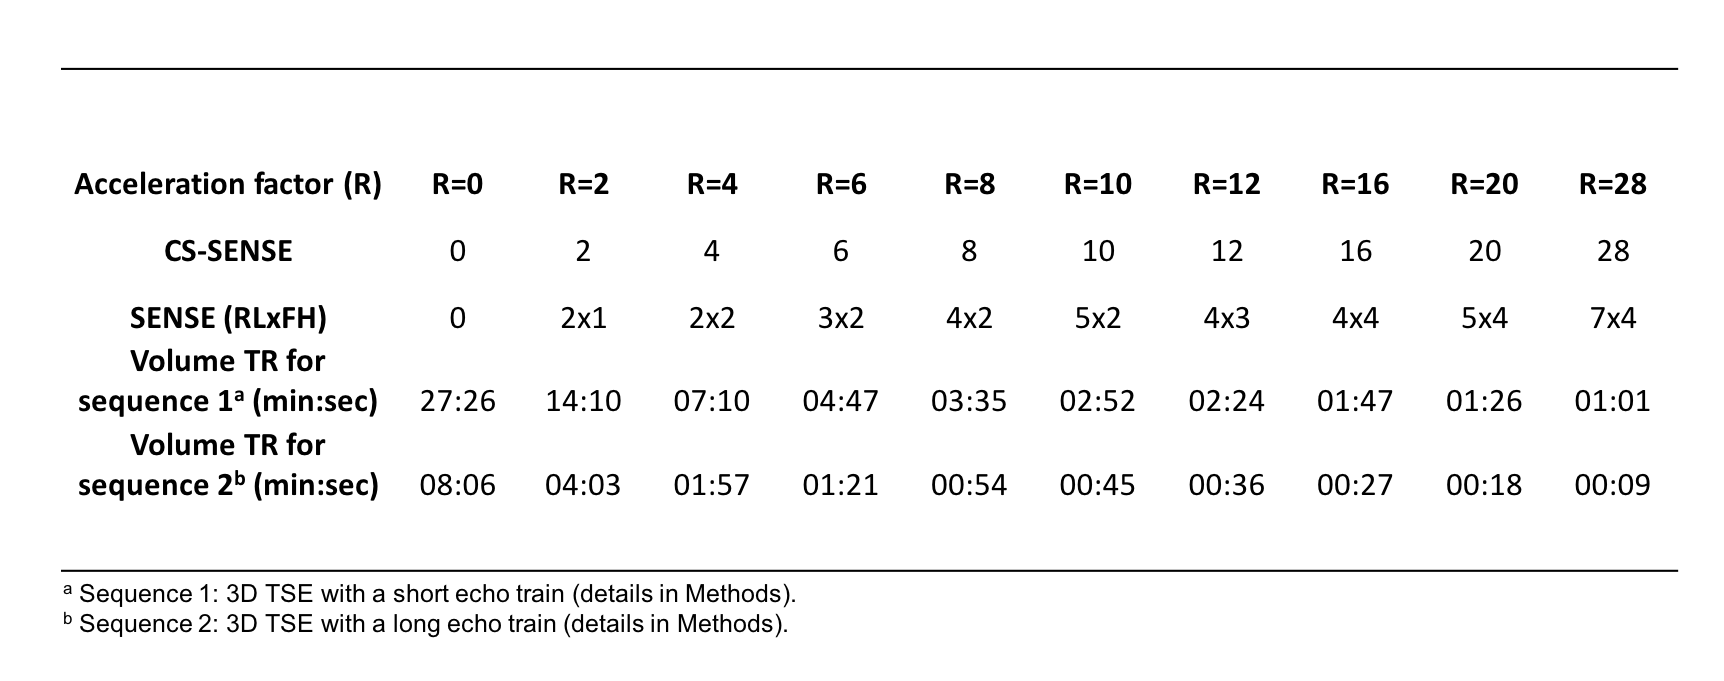
All experiments were performed on a 3T Philips scanner with a 32-channel head coil array. Two 3D-TSE sequences with identical voxel=0.75mm isotropic and FOV=210x180x130mm3 were performed: 1) 3D-TSE with a short echo train: 146ms, TR/TE=1000/73ms; and 2) 3D-TSE with a long echo train: 2800ms, TR/TE=9000/1399ms. The sequences were run using CS-SENSE and SENSE with different acceleration factors listed in Table 1. Experiments on a water phantom were performed to measure PSF and SNR for each sequence. PSFs were measured using the 1D_FT mode provided by the vendor (Philips) on the two phase-encoding directions (RL and FH) when the gradients in corresponding directions are disabled5. Full-width-at-half-maximum (FWHM) was calculated for each PSF. SNR-per-unit-time was calculated in a manually drawn region-of-interest (ROI) as the mean signal divided by the standard deviation normalized by the square root of acquisition time (in seconds) per slice to account for the different volume TRs with different R6. 3D-TSE sequences with long echo trains were performed in healthy human subjects to evaluate the image quality from various SENSE and CS-SENSE acceleration.RESULTS
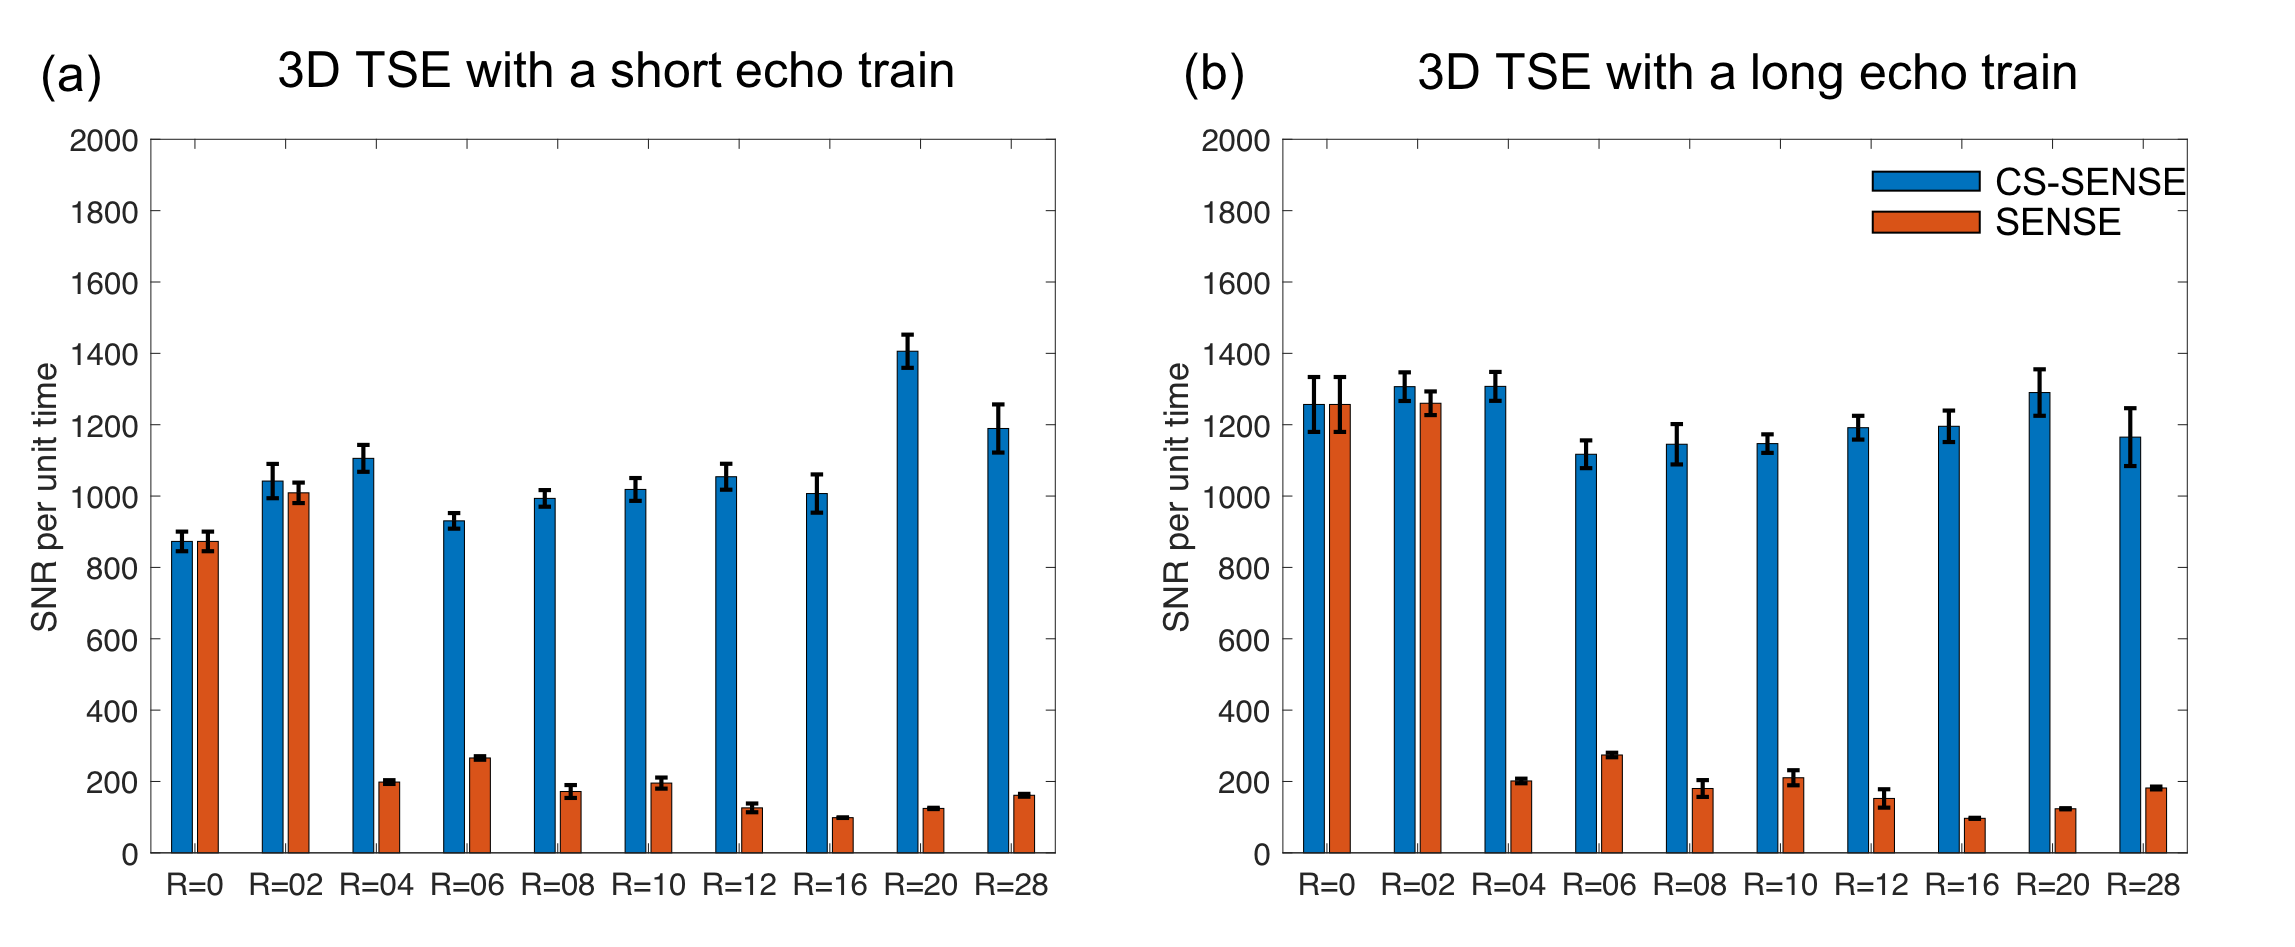
Figure 1 shows the PSF results. As expected, the peaks of PSF decreased as R increases (Fig.1a,d), since less data points in k-space are acquired with higher acceleration. In the 3D-TSE sequence with a short echo train, the FWHM (Fig.1c) remained ~1.3 voxels in both phase-encoding directions (RL and FH) as R increased from 0 to 28 in both CS-SENSE and SENSE. In the 3D-TSE sequence with a long echo train, the FWHM (Fig.1f) remained approximately constant (1.5-1.7 voxels) in both phase-encoding directions (RL and FH) as R increased from 0 to 16, but started to increase gradually for R≥20. This effect was similar in both CS-SENSE and SENSE. Note that the measured FWHMs of PSF in long echo train 3D-TSE were slightly larger than those in the corresponding short echo train 3D-TSE sequence with the same R, which can be expected as spatial blurring in 3D-TSE is mainly caused by T2 decay in the echo train. Figure 2 shows that SNR-per-unit-time was comparable for R=0-28 in CS-SENSE, whereas it decreased significantly for R≥4 in SENSE. Figure 3 shows human brain images acquired using long echo train 3D-TSE sequences with CS-SENSE and SENSE for R=0-28. With CS-SENSE, the images were of reasonable quality for R≤16, but started to show excessive noises for R≥20. Note that these images were all from a single acquisition from each sequence with shorter acquisition time (volume-TR) for larger R as listed in Table 1. No fold-over artifacts were visible in any CS-SENSE images even when R=28. With SENSE, fold-over artifacts started to show up for R=8, and worsened in both phase encoding directions with increasing R.DISCUSSION & CONCLUSION
Both CS-SENSE and SENSE had little effect on PSF (thus spatial blurring) in the tested 3D-TSE sequences. Only the 3D-TSE sequences with long echo trains and R≥20 showed increased (compared to R=0) FWHM of PSF due to T2 decay. CS-SENSE showed preserved SNR-per-unit-time even when R=28 (compared to R=0), while SENSE reduced SNR-per-unit-time significantly when R≥4. Fold-over artifacts were seen on SENSE images with R≥8, but not on CS-SENSE images for R=0-28. Overall, CS-SENSE seems to show clear advantages compared to conventional SENSE, especially with high acceleration factors.Acknowledgements
This study was supported by National Institute of Neurological Disorders and Stroke (NINDS).References
1. Pruessmann, Klaas P., et al. "SENSE: sensitivity encoding for fast MRI." Magnetic resonance in medicine 42.5 (1999): 952-962.
2. Liang, Dong, et al. "Accelerating SENSE using compressed sensing." Magnetic Resonance in Medicine: An Official Journal of the International Society for Magnetic Resonance in Medicine 62.6 (2009): 1574-1584.
3. Geethanath, Sairam, et al. "Compressed sensing MRI: a review." Critical Reviews™ in Biomedical Engineering 41.3 (2013).
4. Vranic, J. E., et al. "Compressed Sensing–Sensitivity Encoding (CS-SENSE) Accelerated Brain Imaging: Reduced Scan Time without Reduced Image Quality." American Journal of Neuroradiology 40.1 (2019): 92-98.
5. Pednekar A., ISMRM, 16, 2008:2959
6. Dietrich, Olaf, et al. "Measurement of signal‐to‐noise ratios in MR images: influence of multichannel coils, parallel imaging, and reconstruction filters." Journal of Magnetic Resonance Imaging: An Official Journal of the International Society for Magnetic Resonance in Medicine 26.2 (2007): 375-385.
Figures