3499
Free breath T2*-mapping for planning and monitoring the chelation therapy in children with secondary iron overload1Radiology, Dmitry Rogachev National Medical Research Center Of Pediatric Hematology, Oncology and Immunology, Moscow, Russian Federation, 2Philips Healthcare, Imaging Systems, Moscow, Russian Federation
Synopsis
Iron overload represents critical health problem in children with regular transfusional therapy. Breath hold T2* mapping is widely used for the iron quantification, but it is not always feasible in pre-school children without the sedation. We purpose the free breath T2* mapping for the quick monitoring of treatment response to the chelation therapy in pediatric patients.The purposed method demonstrate that free breath T2* mapping is more convenient for the iron quantification in children according to lack of limited by breath hold technique and provides much higher quality images.
Introduction
Iron overload represents a critical health problem in patients with regular transfusional therapy [1]. Iron overload is a clinical syndrome caused by abnormal accumulation of iron in parenchymal organs, leading to organ toxicity and dysfunction [2]. Disorders causing iron overload, such as beta thalassemia major [3], sickle-cell disease [4], congenital dyserythropoietic anemia [5] are characterized by ineffective erythropoiesis with increased duodenal uptake of iron [6] and considerable iron burden due to regular blood transfusions [7]. Early diagnostics of iron overload is important for planning and monitoring of chelation therapy and until recently was performed either directly by liver biopsy [9] and/or indirectly by measuring of serum ferritin level [8]. However there are certain limitations related to these methods, for example, such factors as infection, inflammation and malignancy often affect accuracy of serum ferritin level tests and liver biopsy is an invasive method that can lead to major complications such as liver damage, internal bleeding and infections [10]. Currently, MRI is the gold standard in diagnosing of excessive iron accumulation in organs and tissues. The breath hold T2* mapping is widely used for iron assessment, but this technique requires the patient to hold his breath in order to avoid artifacts from respiratory movements. Based on our experience, it is rare that patients under 7 years of age are able to methodically hold their breath for 8-12 seconds. As a result, for this group of patients the usage of the breath hold T2* mapping without anaesthetic support is impossible due to the huge amount of breathing artifacts, which make it difficult to generate the relaxometric maps and calculate the T2* values.Thus, our purpose is to introduce free breath T2* method for diagnostics of iron overload and monitoring of the chelation therapy response.
Methods
85 patients with acquired hemochromatosis (transfusion and haemolytic nature of the disease) aged from 2 to 18 years old participated in our study. The local ethics committee of the center approved the study. Informed consent was obtained from all participants. All the studies were performed using a 3T MR scanner (Philips Achieva). We have used standard breath hold T2*-mapping, and free breath T2*-mapping for liver iron overload quantification in children.To control accuracy of fast T2* decay fitting, T2* relaxometry maps were calculated automatically by different software such as Integrated Philips T2* maps, IDL 6.3 based relaxation maps tool and Segment CMR (Einar Heiberg, http://medviso.com/).
Also we compared the results obtained by free breath and breath hold techniques.
T2* values were estimated and correlated with iron concentration measured by liver biopsy, conducted immediately after MRI- scan.
Results
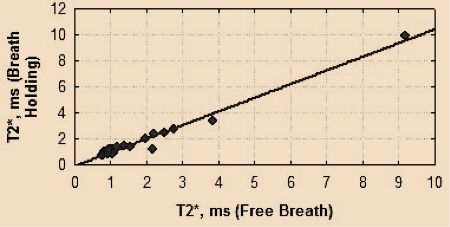
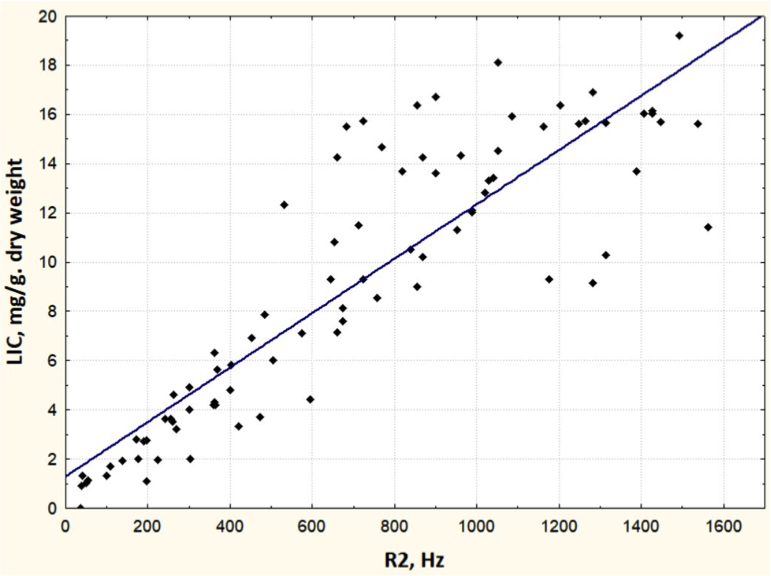
We found that both free breath and breath hold techniques are appropriate for iron assessment (fig.1).We also made the correlation curve between the biopsy data and the R2* values (fig.2) by free breath technique with correlation coefficient of 0.88 (R2=0.77; confidence interval of 49% - 56% with CC= 95%).
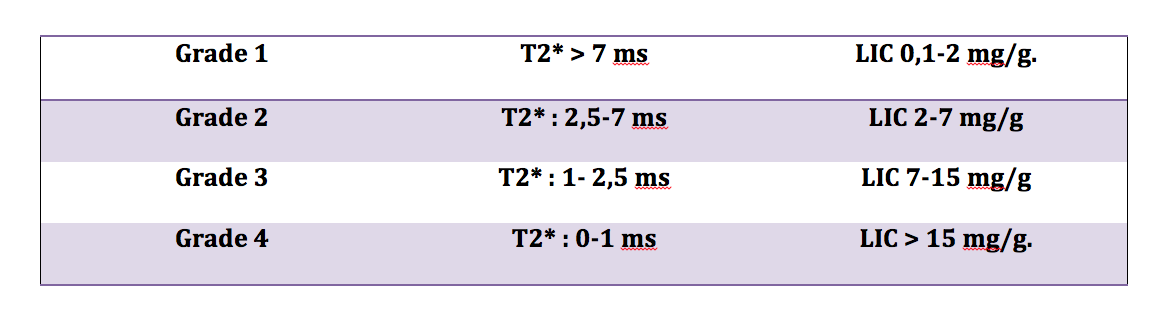
According to our results we conducted the staging of T2* values based on siderosis grades: 1 grade -T2* > 2.5 ms (LIC 0.1-2.0mgFe/g dry), 2 grade - T2* of 1.5-2.5ms (LIC 2-7mgFe/g dry), 3 grade - T2* of 1-1,5ms (LIC 7-15mg/g dry), 4 grade - T2* of 0-1 ms (LIC >15mg/g) (fig.3).
Conclusions
Our results have demonstrated that free breath T2* mapping for iron assessment enables good quantification of liver iron concentration. Free breath T2* mapping can be used in all phases of the clinical observation of a patient: the staging of iron overload, the start of chelation therapy, the evaluation of efficacy and the discontinuation of therapy. It was established that free breath T2* mapping is more convenient for iron quantification in children because there is no need for the patients to hold their breath.Acknowledgements
We thanks Philips Russia for their help with installing and optimizing the sequence on the scanner involved in the study. We also thanks all patients for their cooperation.References
1. Olivieri, N. F., & Brittenham, G. M. Iron-Chelating Therapy and the Treatment of Thalassemia. //Blood 1997, 89(3): 739-761
2. Gulati V, Harikrishnan P, Palaniswamy C, et al. Cardiac involvement in Hemochromatosis. //Cardiology in Review 2014, 22 (2): 56-68.
3. Muncie HL Jr, Campbell J. Alpha and beta thalassemia. //Am Fam Physician 2009, 80: 339–344.
4. David C Rees, Thomas N Williams, Mark T Gladwin Sickle-cell disease //The Lancet 2010, 376: 2018-2031.
5. Kamiya, T. & Manabe, A. Congenital dyserythropoietic anemia. //Int J Hematol 2010, 92: 432 - 438. 6. Gattermann N The treatment of secondary hemochromatosis. //Dtsch Arztbl Int 2009, 106: 499–504.
7. Shander A., Cappellini M. D., Goodnough L. T. Iron overload and toxicity: the hidden risk of multiple blood transfusions //Vox sanguinis 2009, 97(3): 185-197.
8. WHO Serum ferritin concentrations for the assessment of iron status and iron deficiency in populations. Vitamin and Mineral Nutrition Information System. Geneva, World Health Organization, 2011.
9. Villeneuve J-P, Bilodeau M, Lepage R, Côté J, Lefebvre M. Variability in hepatic iron concentration measurement from needle-biopsy specimens. //J Hepatol. 1996;25: 172-177.
10. St. Pierre, T. G., Clark, P. R., Chua-anusorn, W., Fleming, A. J., Jeffrey, G. P.,Olynyk, J. K., Pootrakul, P., Robins, E., & Lindeman, R. Noninvasive measurement and imaging of liver iron concentrations using proton magnetic resonance. //Blood 2005, 105(2): 855-861.
Figures