3496
Imaging biomarker to extract features from soft tissue tumors1Department of radiology, Chiba medical center, Chiba, Japan, 2RIKEN Center for Brain Science, Wako, Japan, 3Department of radiology, Chiba Central Medical Center, Chiba, Japan, 4Department of Medical Technology, Tokyo Women's Medical University Yachiyo Medical Center, Yachiyo, Japan
Synopsis
In order to evaluate the pathological alteration in soft tissue tumors, we focused on the color, distribution, and morphology of the images, based on the tumor components. We could classify soft tissue tumors by texture analysis using MRI. T2-weighted images were more useful for classifying these tumors than T1-weighted images. Texture analysis was extremely useful for diagnosis of soft tissue tumors.
INTRODUCTION
In general, we use computed tomography (CT) and MRI image for diagnosis of soft tissue tumors. Since soft tissue tumors have different constituents respectively, the image findings in these tumors are also different respectively. Furthermore, there are rare cases of atypical tumors in soft tissue tumors that are difficult to classify. In the case of atypical tumors that are difficult to classify by using image contrast, contrast tests and biopsy are additionally performed. Certainly, the components in the tumor are reflected in the resulting classification of soft tissue tumors. Thus, we consider that it is possible to classify types of soft tissue tumors with contrast obtained from MRI. In order to evaluate the pathological alteration in soft tissue tumors, we focused on the color, distribution, and morphology of the images, based on the tumor components. In clinical practice, MRI is most often used for diagnosis of soft tissue tumors because MRI has various image contrasts such as T1-weighted images and T2-weighted images compared with CT. Texture analysis that can quantitatively evaluate the features (morphology, color arrangement, distribution, etc.) obtained from image contrasts has been used in clinical practice as a biomarker showing the characteristics of tissue structure. If texture analysis using MRI can extract feature values of each tumor image extract for classification and evaluation for each tumor, we consider that this method is extremely non-invasive, and these biomarkers are extremely useful for diagnosis of soft tissue tumors.METHODS
This retrospective study was approved by the institutional review board and informed consent was waived. The subjects were 307 patients who underwent MRI imaging at our hospital for the purpose of soft tissue tumors evaluation from July 2017 to June 2019. Among them, 13 ganglion (mean age 45.6 years) and 15 atheroma (mean age 51.7 years) diagnosed by radiological interpretation or postoperative pathology were targeted. (We eliminated patients with motion artifact in their images from subject in this study.) The ROI was cut out from the T1-weighted (TR, 620ms; TE, 8ms; flip angle, 90 degrees; field of view, 150× 150 mm2; matrix, 256 × 200; slice thickness, 4.0 mm; gap, 0.4mm; and acquisition time, 2min4sec) and T2-weighted images (TR, 4500 ms; TE, 100 ms; flip angle, 90 degrees; field of view, 150× 150 mm2; matrix, 320× 256; slice thickness, 4.0 mm; gap,0.4mm; and acquisition time, 2min15sec) to include the entire tumors, the features of each image were extracted by texture analysis. Specifically, we calculated kurtosis, skewness, average, and variance from the signal histogram curve of each pixel making up the image. Furthermore, the signal sequence in the pixel was extracted as each parameter[4][5]. The statistical analysis (Wilcoxon signed rank test) was performed on the obtained data to evaluate its classification and tendency, and to examine its clinical usefulness. The research flow diagram is shown in Figure 1.The MRI machine used was PHILIPS Ingenia 3.0T (Release 5.1.7). The software used were brain Suite to make mask and FSL to extract image. In addition, all texture analysis were performed by MATLAB (Mathworks).RESULTS
Box-and-whisker plots of comparing ganglion to atheroma by each parameter is shown in Figure 2. Comparison of ganglion and atheroma in T1-weighted images showed a significant difference in entropy by histogram analysis (p = 0.0262). GLCM analysis showed a significant difference in correlation (p = 0.0111) and energy (p = 0.0262). Comparison of ganglion and atheroma in T2-weighted images showed a significant difference in entropy by histogram analysis (p = 0.001). In the GLCM analysis, three significant differences {correlation (p = 0.0199), Energy (p = 0.0149), and Homogeneity (p = 0.0015)} were obtained. In Run Length Matrix analysis, six significant differences {SRE (p = 0.001, LRE (p = 0.0149), GLN (p = 0.0111), RP (p = 0.001), LGRE (p = 0.0081), HGRE (p = 0.001)) were obtained. A table of p-values derived from statistics is shown in Figure 3. Figure 4 shows the texture analysis parameters and their abbreviations.CONCLUSION
We could classify soft tissue tumors by texture analysis using MRI. Texture analysis was extremely useful for diagnosis of soft tissue tumors. This method is a highly original attempt because it can quantitatively acquire the characteristic image information of each tumor.Acknowledgements
No acknowledgement found.References
1. Doyla LA .,.Semin Diagn Pathol., vol32, no.5 ,pp. 370-80, Sep 2015
2. Buch K, et al., J Appl Clin Med Phy., vol.19, no. 6, pp. 253-264, Nov 2018
3. Kassner A, et al., AJNR Am J Neuroradiol., vol.31, no. 5, pp. 809-16, May 2010
4. Ramkumar S, et al., AJNR Am J Neuroradiol., vol. 38, no. 5, pp. 1019-1025, May 2017
5. Wibmer A, et al., Eur Radiol., vol. 25, no. 10, pp. 2840-50, Oct 2015
Figures
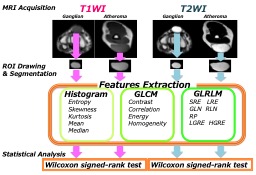
Figure 1
This is an image analysis flowchart for this study. We extracted tumors from both T1-weighted images and T2-weighted images, and then texture analysis was performed.
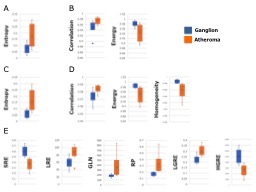
Figure 2
Box-and-whisker plots of comparing ganglion to atheroma by each parameter
A) Comparing ganglion to atheroma using Histogram analysis in T1WI
B) Comparing ganglion to atheroma using GLCM analysis in T1WI
C) Comparing ganglion to atheroma using Histogram analysis in T2WI
D) Comparing ganglion to atheroma using GLCM analysis in T2WI
E) Comparing ganglion to atheroma using Run-length analysis in T2WI
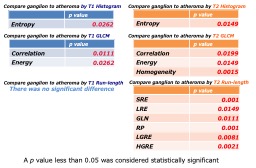
Figure 3
For each feature value obtained by texture analysis, we showed the parameters with statistically significant difference.
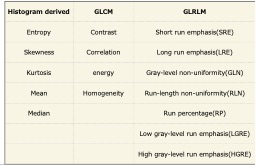
Figure 4
The parameters of the texture analysis used in this study and their abbreviations.
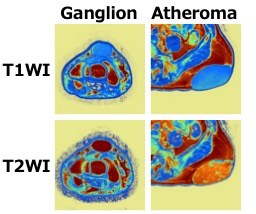
Figure 5
Representative color map of each soft tissue image. The lower row of images present T2-weighted images. The upper row of images present T1-weighted images.