3493
Use of Compressed Sensing to Reduce Scan Time and Breath-holding for cine bSSFP MRI in Children and Young Adults
Nivedita Naresh1, Ladonna Malone1, Takashi Fujiwara1, Emma Hulseberg-Dwyer1, Janet McGee1, Quin Lu2, Mark Twite3, Michael Dimaria4, Brian Fonseca4, Lorna P Browne1, and Alex J Barker1,5
1Radiology, Children's Hospital Colorado, Aurora, CO, United States, 2Philips Healthcare North America, San Francisco, CA, United States, 3Anesthesiology, Children's Hospital Colorado, Aurora, CO, United States, 4Pediatrics, Children's Hospital Colorado, Aurora, CO, United States, 5Bioengineering, University of Colorado Anschutz Medical Campus, Aurora, CO, United States
1Radiology, Children's Hospital Colorado, Aurora, CO, United States, 2Philips Healthcare North America, San Francisco, CA, United States, 3Anesthesiology, Children's Hospital Colorado, Aurora, CO, United States, 4Pediatrics, Children's Hospital Colorado, Aurora, CO, United States, 5Bioengineering, University of Colorado Anschutz Medical Campus, Aurora, CO, United States
Synopsis
In this study, we have a compared a vendor-optimized compressed sensing (CS) accelerated cine MRI technique with the conventional cine MRI technique. There were no significant differences in image quality and cardiac volumes between the two techniques, except left ventricular end-diastolic volume which was significantly lower with the CS technique. The accelerated technique on average reduced scan time by 50%.
Introduction:
Conventional pediatric MRI acquisitions of a short axis (SA) stack for
ventricular volumes typically require one breath-hold per slice, resulting in multiple
coordinated breath-holds under anesthesia to acquire the entire stack. Here, we
aim to validate a vendor-optimized compressed sensing approach to reduce breath-holding
during SA balanced steady state free precession (bSSFP) cine imaging. Qualitative
image scores and left ventricular and right ventricular global volumes were
compared between the conventional bSSFP technique and the compressed sensing
technique.
Methods: 22 patients undergoing clinically indicated cardiac MRI were enrolled in this IRB-approved study (age: 16±9y [range: 3-36]; 12 females; HR: 71±15bpm [range: 50-117]). Patient demographics are summarized in Table 1. All imaging was performed on a commercial 3T scanner (Ingenia, Philips Healthcare) using retrospective ECG-gated cine bSSFP. Cine SA images covering both ventricles were acquired with conventional parallel imaging (SENSE = 1.5-2) and a vendor-optimized parallel imaging/compressed sensing approach (compressed SENSE [CS] factor = 2.5 for patients weighing less than 40 kg and CS factor = 3.5 for patients weighing more than 40 kg). When possible, identical image acquisition parameters were used (Table 2). Image quality was scored for blood-myocardial contrast (BMC), edge definition (ED), and presence of artifact (PA) by an experienced radiologist. The clinical scoring was as follows: BMC: 1 – excellent, 2 – good, 3 – adequate; ED: 1 – excellent, 2 – good, 3 – blurry; PA: 0 – no, 1 – yes (1). Quantitative comparisons included left ventricle (LV) and right ventricle (RV) end systolic volume (ESV), end diastolic volume (EDV), ejection fraction (EF). The quantitative measurements were performed using the short axis plugin on CIRCLE (Circle CVI42, Calgary). A paired t-test was used to detect significant differences. P < 0.05 was considered statistically significant.
Results: Figure 1 shows example images acquired with both the conventional and CS sequences in a 21 year old female patient with coarctation. The qualitative and quantitative results are summarized in Table 3. No significant differences were found with image scores for BMC, ED, and PA (p = 0.67, 0.27, 0.14). Only LV EDV was significantly lower with the CS sequence as compared to the conventional sequence (p < 0.05 vs. conventional). No differences were found between LV ESV, and EF for the two sequences (p = 0.24, 0.76) or RV EDV, ESV, and EF (p = 0.59, 0.23, 0.36). Regression plots showing correlations for LVEDV, LVESV, LVEF, RVEDV, RVESV and RVEF between the two sequences are shown in Figure 2. All parameters were significantly correlated between the two sequences (p<0.05 vs. conventional sequence) with a slope approaching unity (LVEF was the lowest with a slope=0.73). Also shown in Figure 2 are Bland-Altman plots for the various functional parameters. The bias was 2.0±1.4% and limit of agreement was 17±8% for all the functional parameters. Scan duration (not including rest between breath-holds) was 8±2 s/slice for conventional imaging (96 ± 24s total; median: 92s) vs. 4±2 s/slice for CS (54 ± 18s total; median: 52s). With CS, 2-4 slices were acquired per breath-hold, further speeding up acquisition 2-4 times (including rest between breath-holds).
Conclusion: There were no significant differences in image quality and cardiac volumes between the two approaches (all were similar except LVEDV). Additional analysis is required to understand the role of observer variability when determining differences between the two techniques. The time savings per slice acquisition with CS allowed for a 75% reduction in the number of breath-holds (12 vs. 3) without differences in the qualitative or quantitative measurements as compared to the conventional technique. These time savings can reduce the number of breath holds, result in shorter examinations, decrease duration of anesthesia and result in simpler anesthesia protocols.
Acknowledgements
No acknowledgement found.References
1. Krishnamurthy R, Pednekar A, Atweh LA, Vogelius E, Chu ZD, Zhang W, Maskatia S, Masand P, Morris SA, Krishnamurthy R, Muthupillai R. Clinical validation of free breathing respiratory triggered retrospectively cardiac gated cine balanced steady-state free precession cardiovascular magnetic resonance in sedated children. Journal of Cardiovascular Magnetic Resonance. 2015;17(1):1. doi: 10.1186/s12968-014-0101-1.Figures
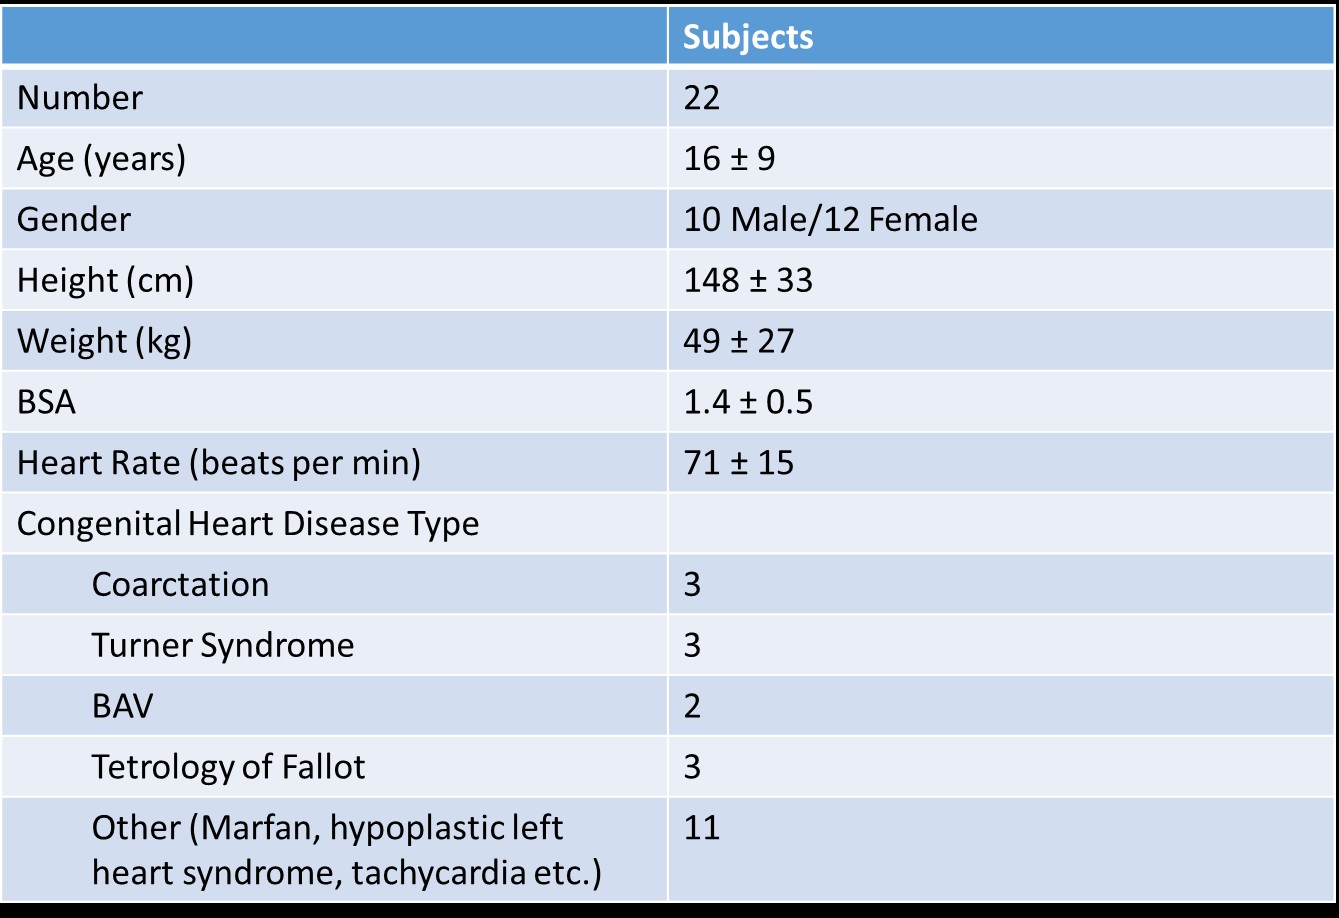
Table 1: Patient Demographics for
the subjects enrolled in this study.
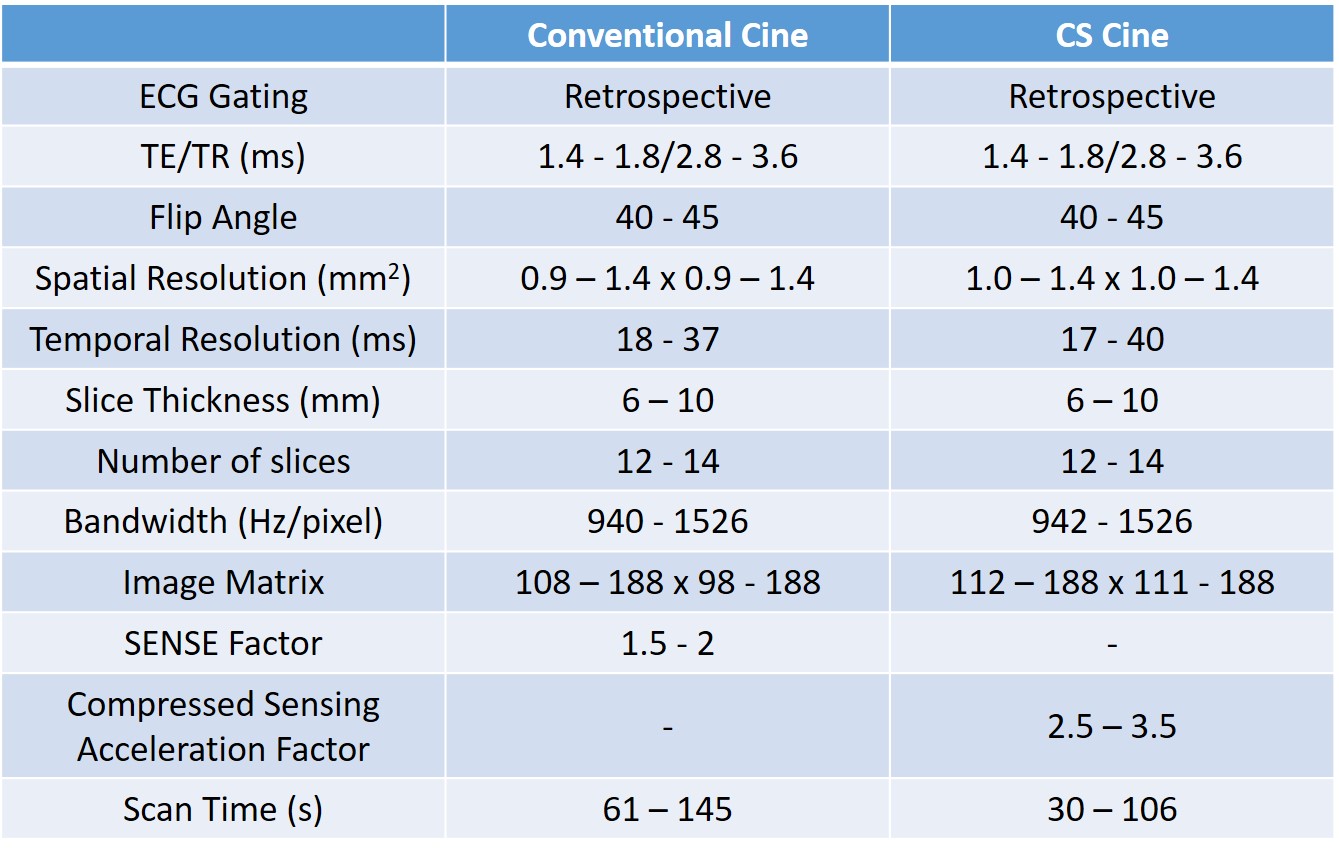
Table 2: Typical imaging parameters
used for both the conventional and accelerated cine sequences.
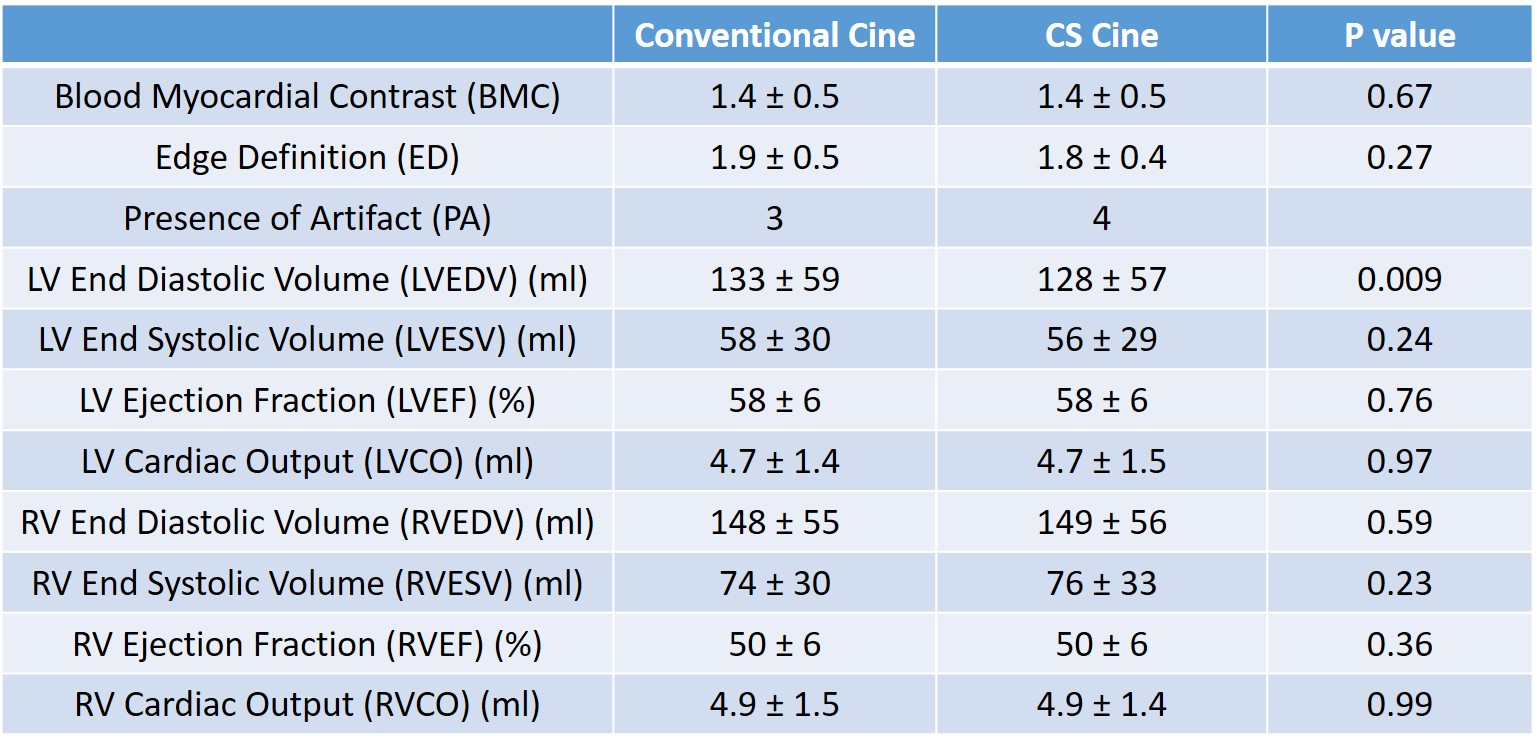
Table 3: Qualitative and
Quantitative results obtained for both the conventional and accelerated
sequences. The results are shown as mean ± standard deviation and the p value
is indicated for each parameter.
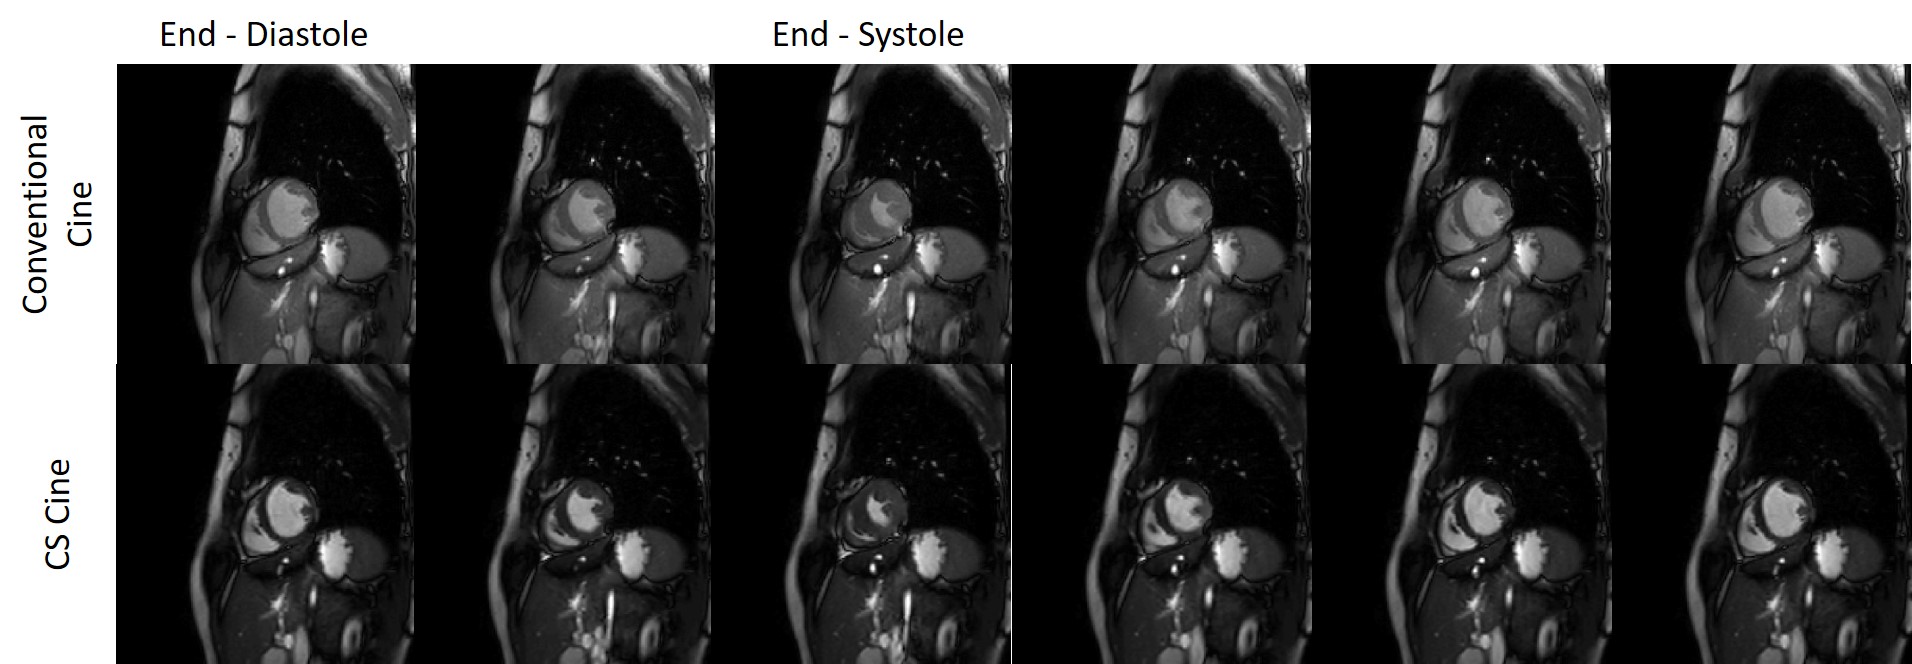
Figure 1: Example images obtained
at different cardiac phases using both the conventional and accelerated
sequences in a 21 year old female patient with coarctation.
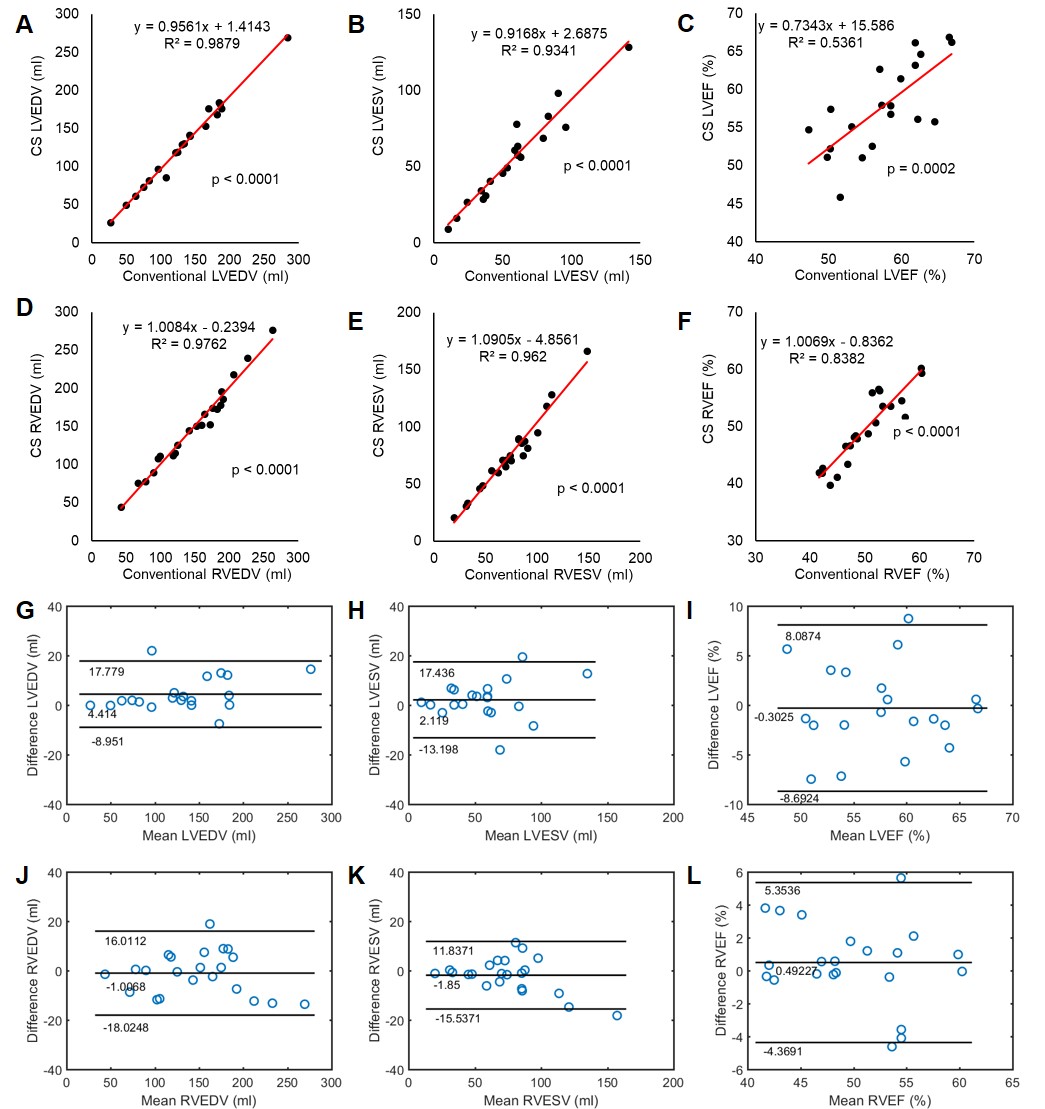
Figure 2: Regression plots (A-F)
and Bland-Altman plots (G-L) showing the correlations between the conventional
and accelerated sequences for LVEDV, LVESV, LVEF, RVEDV, RVESV and RVEF. The
Bland-Altman plots also show the biases (central solid lines) and the 95% confidence
limits of agreement (outer solid lines) for the LV and RV functional
parameters.