3488
Predicting the efficacy of neoadjuvant chemo-radiotherapy for advanced rectal cancer using random forest model and a paired-difference up-sampling strategy under small sample size
Jie Kuang1, QingLei Shi2, Gaofeng Shi1, Xu Yan3, and LI Yang1
1The Fourth Hospital of Hebei Medical University, Shijiazhuang, China, 2Siemens Healthcare, MR Scientific Marketing, Beijing, China, 3Siemens Healthcare, MR Scientific Marketing, Shanghai, China
1The Fourth Hospital of Hebei Medical University, Shijiazhuang, China, 2Siemens Healthcare, MR Scientific Marketing, Beijing, China, 3Siemens Healthcare, MR Scientific Marketing, Shanghai, China
Synopsis
In this study, we adopted a paired-difference strategy, which can improve training efficiency of random forest (RF) model with a small sample size. Through optimizing in normalization, dimensional reduction, and features selection steps, a higher accuracy was achieved in predicting the efficacy of chemo-radiotherapy for advanced rectal cancer.
Purpose
Radiomics method is widely used in cancer diagnosis and treatment response prediction, while it normally needs a big number of training data to achieve robust model. In this study, radiomics method based on an optimized random forest (RF) model was applied in predicting the response neoadjuvant chemotherapy-radiation therapy (CRT) for non-metastatic locally advanced rectal cancer (LARC). To achieve robust model training with a relative smaller data size, a paired-difference analysis (PDA) method is proposed to up-sample the training data. The apparent diffusion coefficient (ADC) map is used to create radiomics features.Materials and Methods
This retrospective study included 55 patients (male 32; female11; age range: 28 to 77 years; mean age: 56.77±12.66) with non-metastatic LARC (adenocarcinoma 38, including 6 cases of poorly differentiation, 30 cases of moderately differentiation, 2 cases of highly differentiation, 4 cases of adenocarcinoma with a small amount of mucinous adenocarcinoma, and 1 case of mucinous adenocarcinoma; pathological stage: low grade 30 cases, high grade 13 cases) scanned from March 2017 to May 2018. All patients were received concurrent chemo-radiotherapy and surgical treatment, with an interval range of 49 to 54 days (mean: 51 days), and all underwent MR examinations at a 3T scanner (MAGNETOM Skyra, Siemens Healthcare, Erlangen, Germany) before and after chemo-radiotherapy treatment within one month. According to curative effect, patients were divided into treatment effective group (TRG0 6 cases; TRG1 8 cases; TRG2 19 cases) and treatment ineffective group (TRG3 10 cases). The inclusion criteria of the study cohort were as follows: (a) MRI scan was performed within 1 week before CRT and within 1-2 weeks after CRT, and the scanned sequence included high-resolution T2WI and DWI (b-values 50 and 800 s/mm2) sequence; (b) postoperative pathological data and tumor regression level (TRG) record were complete.Radiomics signatures were extracted using an open source tool named Pyradiomics (https://pyradiomics.readthedocs.io/en/latest/index.html). The PDA method was applied to increase sample size for model training and testing. We gained 264 paired-case differences as the training data set (153/111= positive/negative) and 114 paired-case differences as the independent testing data set (66/48= positive/negative). A normal-0-center unit method, a pearson correlation coefficients (PCC) method, and an recursive feature elimination (RFE) were chosen in training steps for normalization, dimensional reduction and features selection respectively, by comparing with different methods. According to literature’s report and characteristics of different classifiers, a random forest is used as the classifier in this study. To prove the performance of the model, we applied cross validation with 5-folder on the data set. The performance of the model was evaluated using receiver operating characteristic (ROC) curve analysis. The area under the ROC curve (AUC) was calculated for quantification. The accuracy, sensitivity, specificity, positive predictive value (PPV), and negative predictive value (NPV) were also calculated. All above processes were implemented with FeAture Explorer (FAE, v0.2.5, https://github.com/salan668/FAE) on Python (3.6.8, https://www.python.org/).
Results
We found that the model based on 15 features can achieve the highest AUC (0.985) and accuracy (0.939) on the validation data set. In this point, the AUC and the accuracy of the model achieve 0.998 and 0.984 on testing data set, respectively. The sensitivity and specificity were 1.000 and 0.9828 on the testing data, with 1.000 and 0.8323 for the NPV and PPV, respectively. The selected features were shown in Table 1, and the ROC curve was shown in Figure 1.Discussions
In order to guarantee the accuracy of the experimental results, we set up strict inclusion criteria. In this study, in order to eliminate the sampling bias due to different MRI scanners, 12 patients were excluded.In clinical situations, considering the difficulties of case collection, we employed a paired-difference analysis (PDA) method in up-sampling cases. Using this method, high performance prediction model was achieved using only 55 patient data, which is comparable to that using 378 patient data. Meanwhile, through the subtraction with typical patient data, the variations of radiomics signature may potentially be avoided, which can also improve the accuracy of the model.
Random forest (RF) is an ensemble learning method which combining multiple decision trees at different subset of the training data set. It is also an effective method to avoid over-fitting.During training, we also gave an optimization in data normalization, dimensions reduction and features selection in training through comparing the effects to AUC values.
Conclusions
With a small sample size, adopting PDA strategy with RF model could achieve high performance model in prediction treatment effect for locally LARC treated with neoadjuvant chemotherapy-radiation therapy.Acknowledgements
References
Figures
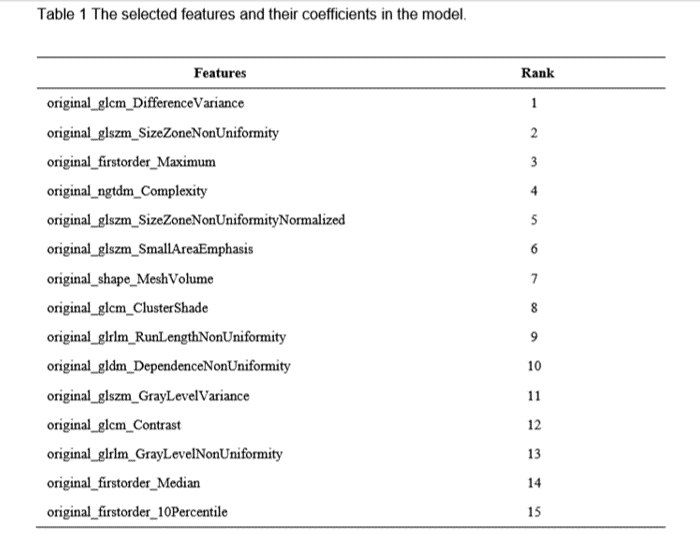
Table 1 The selected features and their coefficients
in the model.
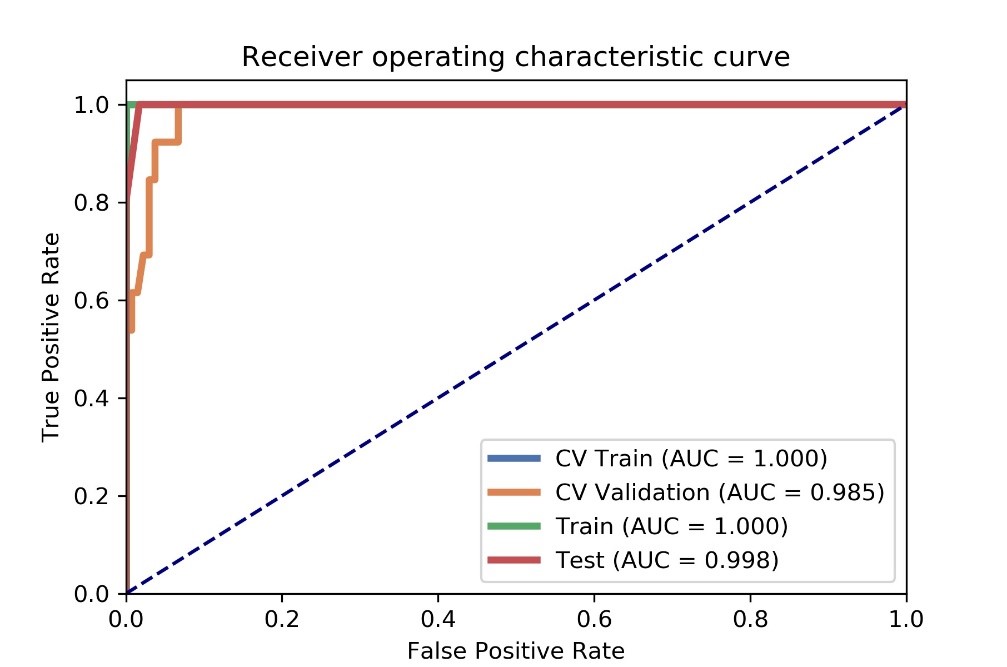
Figure
1 AUC values of ROC on CV training, CV validation, all training and testing
data. CV train: the average of k-1 folder of training data set in k-folder
cross validation; CV validation: the average of k-1 folder of validation data
set in k-folder cross validation.
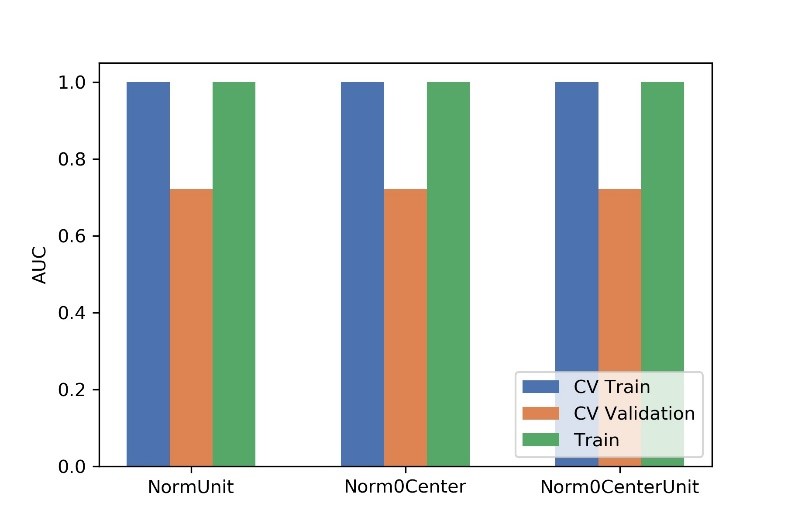
Figure
2 Effects of three normalization method on CV training and CV validation data,
and the corresponding AUCs. CV train: the average of k-1 folder of training
data set in k-folder cross validation; CV validation: the average of k-1 folder
of validation data set in k-folder cross validation.
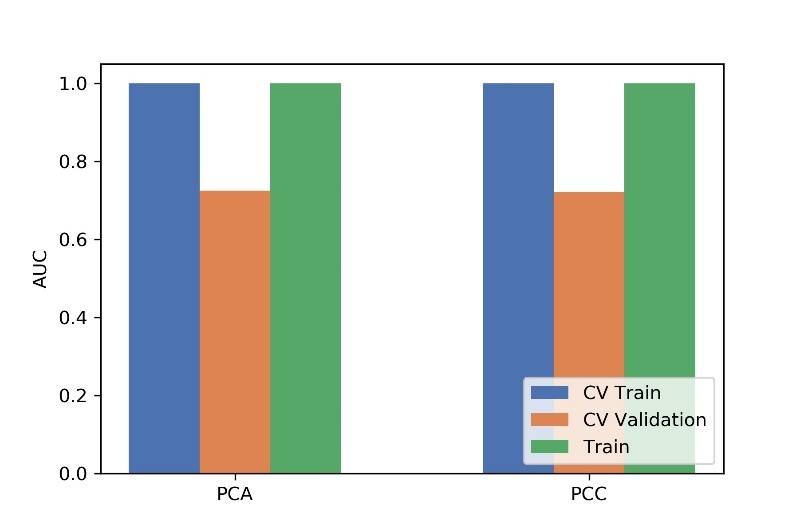
Figure
3 Effects of two dimensional methods on CV training and CV validation data, and
the corresponding AUCs. CV train: the average of k-1 folder of training data
set in k-folder cross validation; CV validation: the average of k-1 folder of
validation data set in k-folder cross validation.
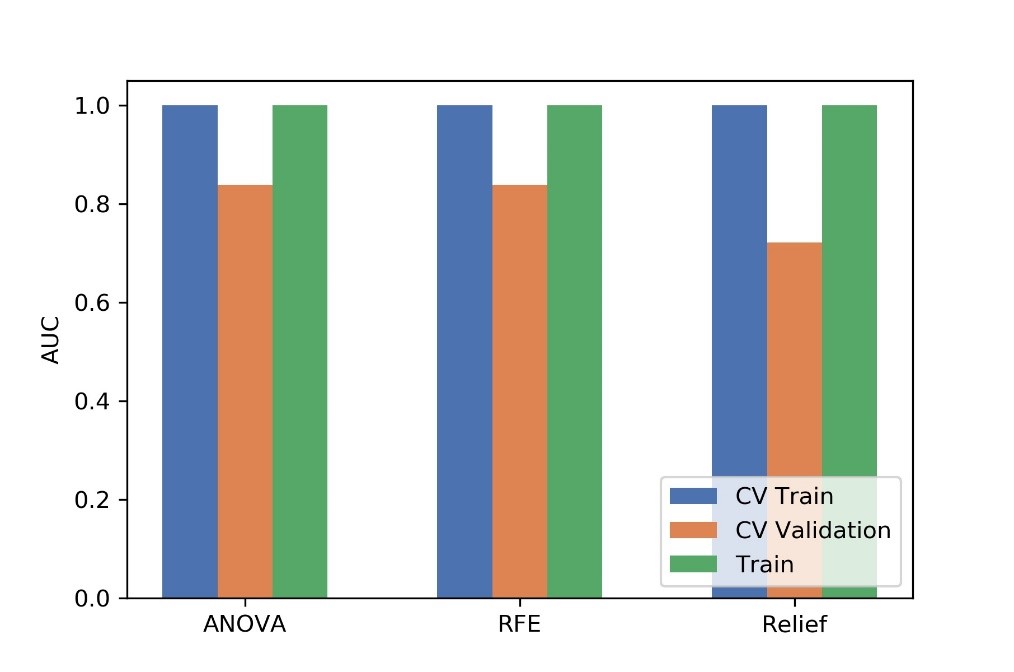
Figure
4 Effects of three feature selective methods on CV training and CV validation
data, and the corresponding AUCs. CV train: the average of k-1 folder of
training data set in k-folder cross validation; CV validation: the average of
k-1 folder of validation data set in k-folder cross validation.
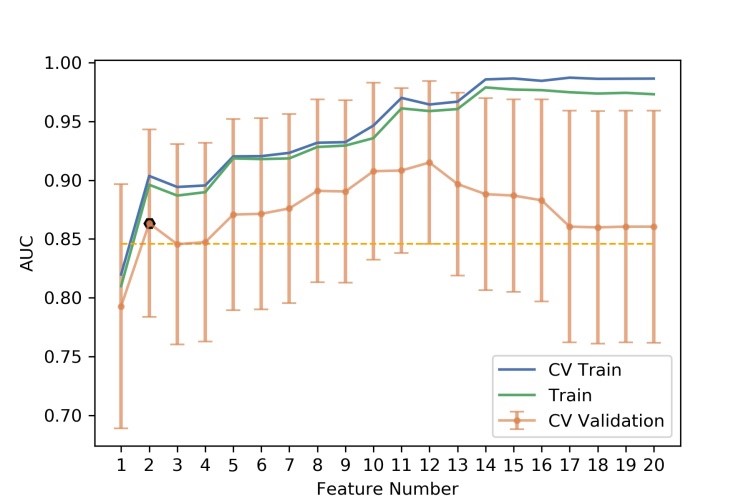
Figure
5 The number of selected features and the corresponding AUCs on CV training and
CV validation, and all training data. CV train: the average of k-1 folder of
training data set in k-folder cross validation; CV validation: the average of
k-1 folder of validation data set in k-folder cross validation.
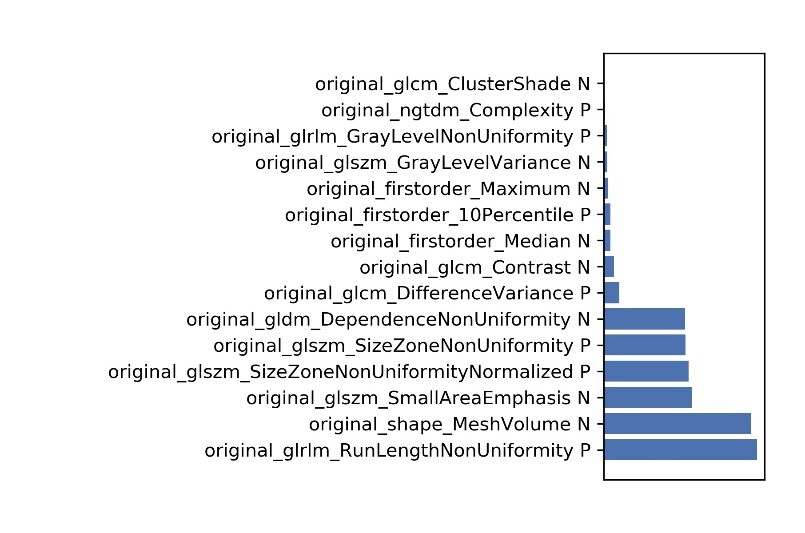
Figure
6 The selected features and their contributions on the model.