3486
Myelin Damage in Chronic Multiple sclerosis lesions: QSM versus Phase imaging1Radiology, Weill Cornell Medicine, New York, NY, United States, 2Radiology, Hainan General Hospital, Haikou, China, 3Healthcare Policy and Research, Weill Cornell Medicine, New York, NY, United States, 4Meinig School of Biomedical Engineering, Cornell University, Ithaca, NY, United States, 5Neurology, Weill Cornell Medicine, New York, NY, United States
Synopsis
The aim of this study was to compare differences in myelin damage among chronic MS lesions identified on QSM as compared to phase imaging. A total of 307 lesions were classified into five categories based upon QSM and Phase features, which included the presence of a hyperintense rim on QSM or hypointense rim on phase. MWF was used to assess myelin damage. Of those lesions identified to have a rim on phase, only those with a rim on QSM demonstrated the lowest MWF. QSM imaging may be more sensitive than phase imaging in detecting myelin damage in MS lesions.
Introduction/Purpose
Quantitative susceptibility mapping (QSM) and phase imaging are both generated from gradient echo (GRE) MR imaging data that sensitive to magnetic susceptibility1, 2. QSM is used to detect different clinical stages of multiple sclerosis(MS) lesions as the QSM does not have blooming artifacts and provides more accurate quantification and localization of the magnetic sources than phase imaging1. Chronic active MS lesions are pathologically characterized by a hypocellular demyelinated core and a hypercellular edge of activated microglia/macrophages related to smoldering inflammation and axonal degeneration3. On QSM, these lesions have a characteristic paramagnetic rim. The paramagnetic shift is due to the stable presence of iron-laden activated microglia/macrophages4. The “ring-like” lesions on QSM can help identify iron accumulation and the associated myelin damage in chronic lesion. In comparison, MRI physics and experiment demonstrate that phase imaging shows only “ring-like” lesions if a lesion is phase-detectable1. Fundamentally, phase imaging reflects a nonlocal signal, which is affected by magnetic sources located in the surrounding voxels due to dipole field effect. Our purpose was to compare the ability to show differences in myelin damage in chronic MS lesions between QSM and phase imaging.Methods
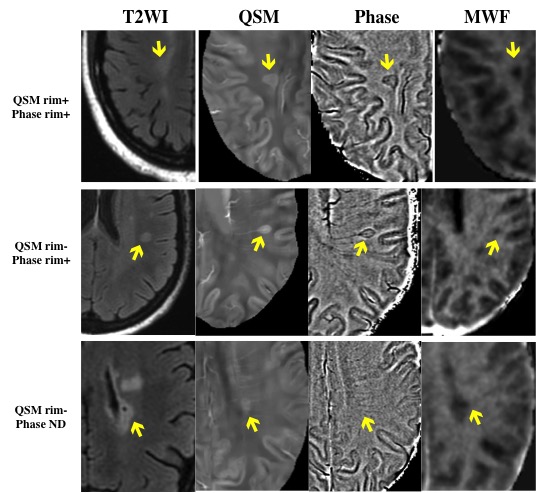
This was a retrospective study of a cohort of 41 MS patients who had undergone MR imaging at baseline that included a multiecho gradient echo (GRE) imaging, T2w, and FLAIR, and a follow up MR imaging that included a FAST-T2-weighted sequence. All images were obtained by a 3-T scanner (Signa HDxt; GE Healthcare, Milwaukee, Wisconsin) with an 8-channel head coil. QSM and phase imaging were reconstructed from multiecho GRE data. Myelin water fraction (MWF) values of MS lesions were measured on a follow up MRI using a FAST-T2-weighted sequence. Two neuroradiologists (WY.H, XF.L) independently reviewed all images blinded to the clinical information. MS lesions were identified and manually traced on FLAIR images with additional manual adjustments on QSM and phase imaging if needed using ITK-SNAP software (version 3.8). Lesions were identified as hyperintense rim on QSM (QSM rim+), hypointense rim on phase (phase rim+), lesion hyperintense on QSM but lack a rim (QSM rim-), Not detected on QSM (QSM-), and Not detected on Phase (phase-). In the case of a disagreement, a third neuroradiologist (S.G.) with 20 years of experience was called on to determine the lesion subtype. A linear mixed effects model with MWF as an outcome was used to analyze the different groups in identifying myelin damage of chronic MS lesions. The model included a random intercept for patient to account for correlation across lesions and fixed effects for the lesion category and lesion volume. The reference group for the model is lesions that are phase negative and not present on the QSM.Results
41 MS patients had 307 lesions. Figure 1 showed the number of lesions occurring in each group. Phase imaging had a lower lesion detection percentage than QSM (QSM=60.91%, Phase=50.16%). For MWF, the groups QSM rim+/phase rim+ (5.68±5.13,P<0.001),QSM rim+/phase- (7.18±1.65, P<0.001),QSM rim-/phase rim+ (8.76±1.88,P<0.001),QSM rim-/phase- (9.14±2.03, P=0.0451), and QSM-/phase rim+ (9.73±2.01, P=0.0481) had significantly lower MWF than that of the reference group (10.85±1.46) (FIG.2), and there was a significant lower MWF in the QSM rim+/phase rim+ than that in the QSM rim-/phase rim+ lesions. There was no significant different MWF between QSM rim-/phase rim+ and QSM rim-/phase- (P=0.270), which indicating that phase imaging was not able to discern a difference in myelin damage in MS lesions that were QSM rim negative. Boxplots of the MWF values for the different groups of lesions are shown in Figure 3.Discussion
MS is an inflammatory demyelinating and neurodegenerative disease of the central nervous system. Remyelination is an important indicator of prognostic improvement. Our study demonstrated QSMcan differentiate myelin damage lesions based on MWF values better than phase imaging. The QSM rim provides more information of myelin damage in MS lesions, indicating that it may be more a more useful marker in MS. It is also more difficult to identify the signal in phase imaging because it is more sensitive to nonlocal magnetic susceptibility shift and dipole field effect5. Absinta et al6 detected different degrees of phase contrast within acute MS lesions, ranging from isointense to mildly hypointense relative to surrounding white matter. They hypothesized that the morphological features of the phase rim in acute lesions would differ from those in chronic lesions. We find most chronic MS lesions hard to be detected in phase imaging and the phase rim also showed limited ability to differentiate the degree of myelin damage in chronic lesions on MWF imaging.Conclusion
QSM can differentiate more severe myelin damage lesions compared to phase imaging.Acknowledgements
NoneReferences
1.Eskreis-Winkler S, Deh K, Gupta A, et al. Multiple sclerosis lesion geometry in quantitative susceptibility mapping (QSM) and phase imaging. J Magn Reson Imaging 2015;42:224-229.
2.Ciraci S, Gumus K, Doganay S, et al. Diagnosis of intracranial calcification and hemorrhage in pediatric patients: Comparison of quantitative susceptibility mapping and phase images of susceptibility-weighted imaging. Diagnostic and Interventional Imaging 2017;98:707-714.
3.Absinta M, Sati P, Fechner A, Schindler MK, Nair G, Reich DS. Identification of Chronic Active Multiple Sclerosis Lesions on 3T MRI. AJNR Am J Neuroradiol 2018;39:1233-1238.
4.Hametner S, Dal Bianco A, Trattnig S, Lassmann H. Iron related changes in MS lesions and their validity to characterize MS lesion types and dynamics with Ultra-high field magnetic resonance imaging. Brain Pathology 2018;28:743-749.
5.Schweser F, Sommer K, Deistung A, Reichenbach JR. Quantitative susceptibility mapping for investigating subtle susceptibility variations in the human brain. Neuroimage 2012;62:2083-2100.
6.Absinta M, Sati P, Gaitán MI, et al. Seven-tesla phase imaging of acute multiple sclerosis lesions: a new window into the inflammatory process. Ann Neurol 2013;74:669-678.
Figures

Figure 1. The sample size for each group.
*ND= not detectable.