3483
Quantitative 3-D SWIFT with compressed sensing1Department of Applied Physics, University of Eastern Finland, Kuopio, Finland, 2Research Unit of Medical Imaging, University of Oulu, Oulu, Finland
Synopsis
Despite the extra information offered by the quantitative magnetic resonance imaging (qMRI), these methods are not widely used due to their long acquisition times. Our approach for fast qMRI was built on minimized data acquisition with ultra-short echo time imaging, and compressed sensing image reconstruction. To validate the approach, a set of variable flip angle images of equine osteochondral specimens were acquired with the Multi-Band-SWIFT sequence. The 4-D image stack was reconstructed with CS-framework utilizing spatial and contrast regularizations. Results with 81% reduced data showed comparable image quality while maintaining correct contrast modulation for quantitative parameter (T1 relaxation time) estimation.
Introduction
Quantitative MRI (qMRI) offers a wealth of information beyond plain anatomical imaging. However, qMRI necessitates the acquisition of multiple images or volumes of data making it slow, which limits its potential. MRI scanners of today are already operating at the safety limits and so far, only one solution appears to provide means for significantly faster scanning – acquisition of less data to begin with. With conventional MRI acquisition and reconstruction methods, image quality is significantly deteriorated when the amount of data decreases. Compressed sensing (CS) image reconstruction methods1 offer a way around this problem.Besides quantitative imaging, sequences capable of capturing the signal from the fastest relaxing spins, such as UTE2 , ZTE3 or SWIFT4-8 offer the possibility of imaging also the tissues that tend to provide no signal with conventional methods. The purpose of this study was to combine quantitative SWIFT MRI with CS framework to allow rapid quantitative imaging of the fastest relaxing spins.
Methods
Our 4-D image reconstruction scheme for faster qMRI is a CS-based sparsity promoting inversion framework, where the image reconstruction amounts to a non-smooth optimization problem of the form$$u = \arg\min_{u_1,...,u_N}\left\{\sum_{n=1}^{N}||g_n-A_nu_n||^2_2 + \alpha|\nabla_su_n|_1 + \beta|\nabla_cu|_{Huber}\right\} (1)$$
where $$$g_n$$$ is the data (k-space) for a single signal weighting, $$$A_n$$$ is the non-uniform Fourier Transform operator (NUFFT), $$$u_n$$$ is the 3-D image for the particular signal weighting, u is the 4-D image stack containing all N of 3-D images with different contrasts, and $$$\nabla_s$$$ and $$$\nabla_c$$$ are total variation-based sparsity promoting difference operators in the spatial and contrast (4th) dimension, respectively. Contrast dimension regularization utilizes Huber-norm9,10 for faster convergence. Regularization parameters α and β determine the weighting of the isotropic spatial total variation and total variation in the contrast dimension.
To determine the accuracy of our CS based reconstruction, series of variable flip angle acquisition of equine osteochondral specimens was conducted using the MB-SWIFT (Multi-Band Sweep Imaging with Fourier Transform) sequence11. Data was acquired with a small-bore 9.4T Varian MRI scanner and a 19-mm diameter quadrature radiofrequency volume transceiver. MB-SWIFT parameters were: bandwidth of 385 kHz, up to 16384 radial spokes per contrast, field of view of 3 cm, yielding nominal resolution of 256^3 and 11 flip angles spanning 1-20 degrees. Complementary radial vieworders (512 spokes with 128 datapoints each per vieworder) were used in the acquisition, fulfilling, to a degree, the CS requirements of sparse image representation and incoherent sampling. From the full SWIFT data of 32 mutually complementary vieworders per contrast, 6 of the last (i.e. 3072 spokes) from each of the 11 further mutually complementary acquisitions were used as the input for equation (1) (81% data reduction). The NUFFT operator of choice in equation (1) was Fessler’s NUFFT-operator from the MIRT toolbox12. Regularization parameters were evaluated and chosen as a compromise between sufficient regularization and minimal over-smoothing of the images.
Results
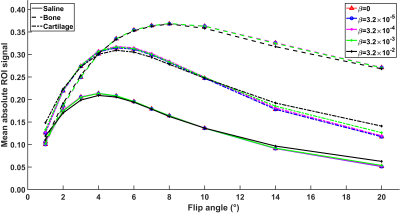
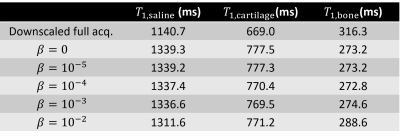
Separately reconstructed full data images (32 vieworders) downscaled in image domain to a resolution matching the CS-reconstructions show fine detail, with few reconstruction artifacts (Fig. 1A). Drastically reducing the data to 6 vieworders and utilizing no regularization in the CS-reconstruction yielded smooth and noisy image lacking details (Fig. 1B). At the same time, artifacts were apparent, though different from those seen in the separately reconstructed images (Fig. 1B). Imposing spatial regularization improved the sharpness of the edges and reduced noise (Fig. 1C). Utilizing the full CS-framework with spatial and contrast regularization further enhanced the image quality without sacrificing the crucial contrast modulation (Figs. 1D and 2). The regularization parameter values used in the reconstructions in Fig. 1, where applicable, were α=3.2*10-6 and β=3.2*10-3.The effect of the regularization parameter β in the contrast dimension was further evaluated due to its significance on the estimation of the quantitative parameter of interest (T1 relaxation time constant in this case, Fig. 2). Image in Fig. 1D was reconstructed with variable values of β and mean absolute signals for defined regions of interest (ROIs) in phosphate buffered saline, cartilage and bone were calculated for each reconstruction (Fig. 2). Increasing the contrast regularization forced the signal variation to decrease (Fig. 2) and affected the estimated T1 relaxation time parameters for each ROI (Table 1).
Discussion & Conclusions
With the CS-approach, it is possible to impose too heavy regularization, yielding both qualitatively inferior images, but more importantly also incorrect estimates of the quantitative parameters. With careful tuning of the parameters, image quality can be retained when comparing to conventional reconstruction methods while gaining a significant reduction in acquisition time by decreasing the amount of data acquisition. Here, the 81% reduction in data acquisition is drastic, and already resulted in noticeable smoothing. In our approach, the regularization parameter β along the contrast dimension is of essence for truthful estimation of the parameters. In the contrast dimension as well, tuning of the regularization allows improving the image quality by utilizing the mutual information contained within the different contrasts, yet maintaining the appropriate contrast, as was indicated by the results. While the calculation was limited to a resolution of 128^3 due to computational costs, the results already show promise for faster quantitative ultra-short echo time MR imaging.Acknowledgements
Support from the Academy of Finland (grants #285909, #319440 and #325146), Instrumentarium Science Foundation (grant #12-4972-46) and Finnish Cultural foundation (grant #00180787) is gratefully acknowledged. Dr. Nikae te Moller is gratefully acknowledged for providing the equine specimens.References
1. Lustig M, Donoho D, Pauly J. Sparse MRI: The application of compressed sensing for rapid MR imaging. Magn Reson Med. 2007;58(6):1182-1195.
2. Robson M, Gatehouse P, Bydder M, et al. Magnetic Resonance: An Introduction to Ultrashort TE (UTE) Imaging. J Comput Assist Tomogr. 2003;27(6):825-846.
3. Weiger M, Pruessmann K, Hennel F. MRI with zero echo time: Hard versus sweep pulse excitation. Magn Reson Med. 2011;66(2):379-389.
4. Idiyatullin D, Corum C, Park J, et al. Fast and quiet MRI using a swept radiofrequency. J Magn Reson. 2006;181(2):342-349.
5. Nissi M, Lehto L, Corum C, et al. Measurement of T1 relaxation time of osteochondral specimens using VFA-SWIFT. Magn Reson Med. 2015;74(1):175-184.
6. Rautiainen J, Lehto L, Tiitu V, et al. Osteochondral repair: Evaluation with sweep imaging with fourier transform in an equine model. Radiology. 2013;269(1):113-121.
7. Zhang J, Chamberlain R, Etheridge M, et al. Quantifying iron-oxide nanoparticles at high concentration based on longitudinal relaxation using a three-dimensional SWIFT look-locker sequence. Magn Reson Med. 2014;71(6):1982-1988.
8. Garwood M, Idiyatullin D, Corum C, et al. Capturing Signals from Fast-relaxing Spins with Frequency-Swept MRI: SWIFT. Encyclopedia of Magnetic Resonance. 2012.
9. Huber P. Robust Estimation of a Location Parameter. Ann Math Stat. 1964.
10. Huber P. Robust Regression: Asymptotics, Conjectures and Monte Carlo. Ann Stat. 1973.
11. Idiyatullin D, Corum C, Garwood M. Multi-Band-SWIFT. J Magn Reson. 2015;251:19-25
12. Fessler J. Michigan Image Reconstruction Toolbox. url:https://web.eecs.umich.edu/~fessler/code/
Figures


