3478
Automatic segmentation for liver fat quantification1Institute of Biomedical Engineering, Oxford University, Oxford, United Kingdom, 2Perspectum Diagnostics, Oxford, United Kingdom, 3Department of Oncology, Oxford University, Oxford, United Kingdom
Synopsis
By segmenting the liver on an MRI Proton Density Fat Fraction (PDFF) map a median PDFF value is obtained, indicating the amount of fat in the liver. Automatic segmentation is desirable, as manual segmentation is time consuming. We investigated a direct PDFF automatic segmentation method using a U-Net model and compared it to a T1-based PDFF segmentation. We show that the median values obtained are comparable, and the Dice scores are relatively good, although not as high as desired. Visually the direct PDFF segmentation is not always optimal. We suggest that improvement of the model is desirable.
Introduction
Proton density fat fraction (PDFF) is a quantitative MRI measure which can be used to assess the amount of fat in an individual’s liver. It has been shown to be an accurate, sensitive and reproducible measure.1 A PDFF value for the liver can be obtained by segmenting the liver (with major vessels excluded) on a PDFF image and calculating a median PDFF for the segmented region. The liver can be segmented manually, however this is time consuming, so it is desirable for semi-automated/automated methods to be used. One automatic segmentation method that has performed well in numerous biomedical image segmentation applications is the U-Net2. In this work we investigated two methods of liver segmentation using U-Net: 1) applying a U-Net model directly to the PDFF image and 2) applying a U-Net model to segment a quantitative T1 MR image and then mapping this segmentation to the PDFF image (with a few modifications). The work also highlighted some of the pitfalls that may occur when evaluating the performance of a segmentation method.Method
The IDEAL sequence3, comprised of 6 (1.5T) or 12 echoes (3T) was used to generate PDFF images. We investigated application of a U-Net PDFF segmentation method using the PDFF image along with the first two echo images. The echo images were included because of the relatively low contrast between liver and vessels or surrounding tissue on the PDFF images, particularly in low-fat cases (the echo images generally show higher contrast between these structures). The network was trained and tested on 352 and 195 sets of images respectively. Hereafter we refer to this method as direct PDFF segmentation.All cases in the test data set had a corresponding T1 image (generated using the shMOLLI sequence4) acquired at the same location as the PDFF image. The T1 images were automatically segmented using U-Net and then this segmentation was mapped to the PDFF image. We have called this segmentation T1-based PDFF segmentation. The T1 segmentation method has been shown to be highly accurate in segmenting the liver whilst avoiding vessels5.
We compared the direct PDFF segmentation to the T1-based PDFF segmentation, both statistically and visually. An expert analyst who has been trained to analyse PDFF images reported on all images. They had access to the echo images to aid their evaluation.
Results
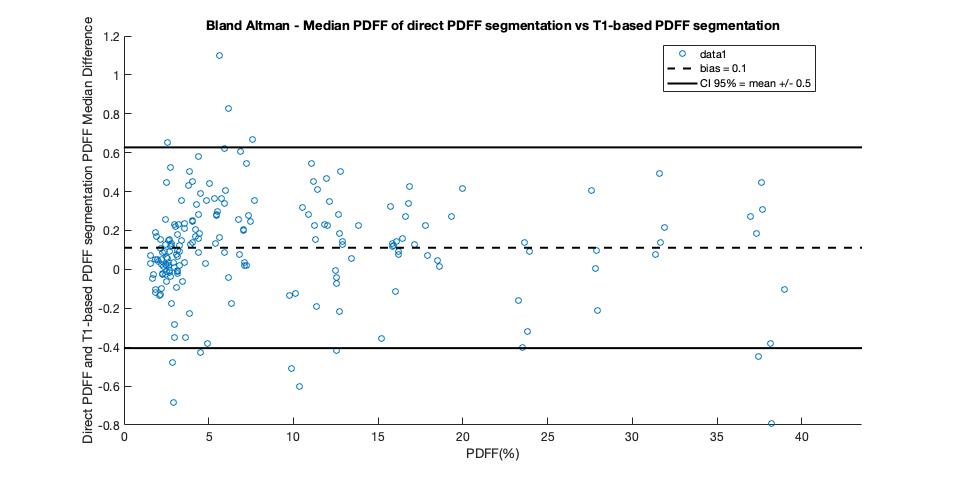
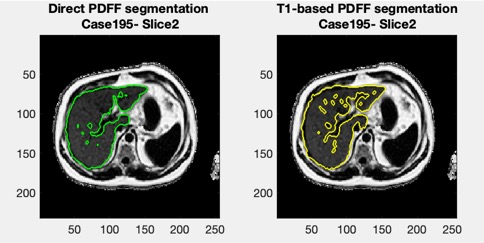
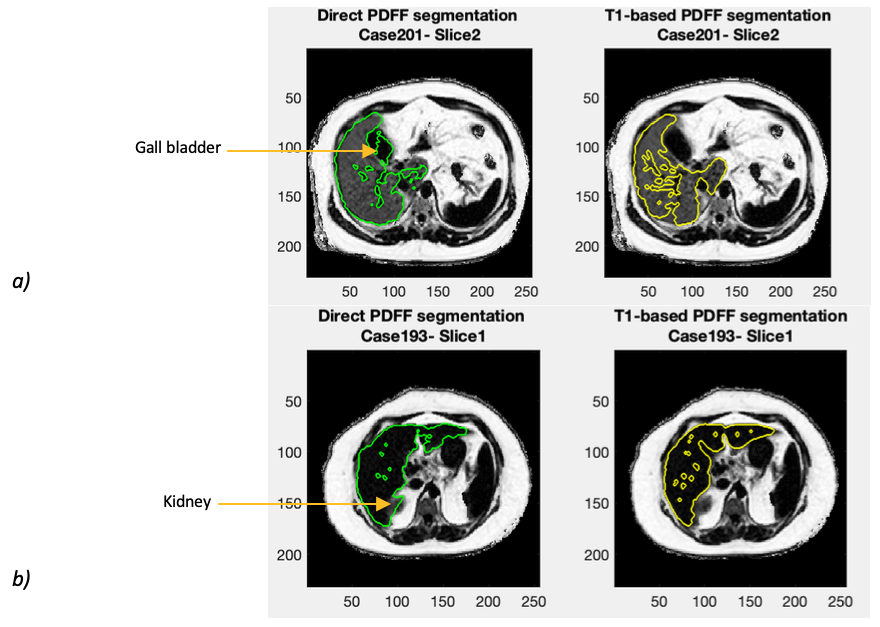
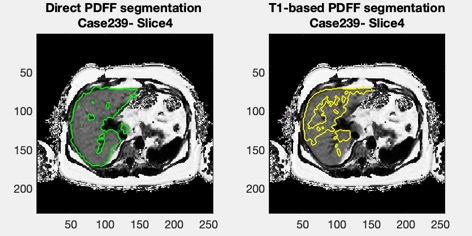
Figure 1 shows a Bland-Altman plot of the differences between the median PDFF from the direct PDFF and T1-based PDFF segmentation is shown in Figure 1. The agreement had a bias = 0.1% and CI 95% = ±0.5%. Figure 2 shows the distribution of Dice scores for the direct PDFF and T1-based PDFF segmentation. The mean Dice score was 0.8524. The lowest Dice score was 0.6030.Figures 3-5 shows examples of the direct PDFF and T1-based PDFF segmentation. The analyst generally considered the results acceptable for both methods, but there were several cases where the direct PDFF segmentation was sub-optimal, as shown in Figure 4. Often vessel-exclusion was less successful and on occasion the segmentation included neighbouring organs such as a kidney. The analyst also noted that although the T1-based PDFF segmentation generally performed better for exclusion of vessels and neighbouring organs, it also was sometimes sub-optimal, potentially due to artefacts in the original T1 image.
Discussion
The Bland Altman plot shows a very good agreement between the direct PDFF and T1-based PDFF segmentation method. The mean Dice score is encouraging, but lower than the Dice score for the comparison of the T1-based segmentation itself to manual segmentation (0.94/0.95 on two separate test sets)5, suggesting that further improvements might be possible. Also, there were a number of cases where dice scores were below 0.7, which is much lower than desired.The visual assessment was generally favourable for both methods, however there were several examples of poor segmentation where extensive manual editing of the mask would be required, particularly for the direct PDFF segmentation. A limitation of the visual assessment was that feedback was not given in a way that could be assessed quantitatively.
Another limitation of this study is that there was no ground truth segmentation to compare both segmentation methods to.
Conclusion
The direct PDFF and T1-based PDFF segmentation methods are comparable and could both be used as an aid for segmenting PDFF, with an expert analyst reviewing and modifying the output, although the T1-based method might be the better starting point. To reduce the need for manual editing of the direct PDFF segmentation it would be useful to improve the model to better exclude vessels and to avoid including neighbouring organs/tissue. The work highlighted that in future assessments it would be desirable to compare to an expert analyst’s segmentation as the ground truth. Also, it would be useful to develop a method to allow for the results of the visual assessment to be analysed quantitively.Acknowledgements
This project was supported by Perspectum Diagnostics and an Industrial Fellowship from the Royal Commission for the Exhibition of 1851.
References
1. Noureddin M, Lam J, Peterson M R, Middleton M, Hamilton G, Le T-A, Bettencourt R, Changchien C, Brenner D A, Sirlin C, Loomba R. "Utility of Magnetic Resonance Imaging versus Histology for Quantifying Changes in Liver Fat in Nonalcoholic Fatty Liver Disease Trials." Hepatology 58.6 (2013): 1930-940
2. Ronneberger O, Fischer P, Brox T. “U-Net: Convolutional Networks for Biomedical Image Segmentation.” Miccai 2015;234–41.
3. Hutton C, Gyngell M L, Milanesi M, Bagur A, Brady M. "Validation of a Standardized MRI Method for Liver Fat and T2 Quantification." PLoS ONE 13.9 (2018): E0204175.
4. Piechnik SK, Ferreira VM, Dall'Armellina E, Cochlin L, Greiser A, Neubauer S, Robson M. "Shortened Modified Look-Locker Inversion Recovery (ShMOLLI) for Clinical Myocardial T1-mapping at 1.5 and 3 T within a 9 Heartbeat Breathhold." Journal of Cardiovascular Magnetic Resonance : Official Journal of the Society for Cardiovascular Magnetic Resonance 12 (2010): 69.
5. Irving, B, Hutton C, Dennis A, Vikal S, Mavar M, Kelly M, Brady M. “Deep Quantitative Liver Segmentation and Vessel Exclusion to Assist in Liver Assessment.” MIUA (2017).
Figures