3476
Optimal data sampling and image reconstruction for Cartesian bSSFP ASL-CMR1University of Southern California (USC), Los Angeles, CA, United States
Synopsis
Arterial spin labeled cardiovascular magnetic resonance (ASL-CMR) is a non-contrast myocardial perfusion imaging technique, which can detect angiographically significant coronary artery disease. Sensitivity of ASL-CMR can be improved by shortening the imaging window with parallel imaging which reduces physiological noise from cardiac motion. In this work, we explore the optimal Cartesian sampling pattern and parallel imaging reconstruction strategy for bSSFP ASL-CMR. We consider different under-sampling masks, acceleration factors, and reconstruction techniques to minimize the imaging window. The optimal setting is selected based on the bias in MP measurements.
INTRODUCTION:
Arterial spin labeled cardiovascular magnetic resonance (ASL-CMR) is a contrast-free technique for myocardial perfusion (MP) imaging which can detect angiographically significant coronary artery disease (CAD) [1]. Clinical utility of existing ASL-CMR methods is limited by low sensitivity, primarily due to high physiological noise (PN) [2]. Do et al. and Jao et al. have shown that PN can be significantly reduced by shortening the acquisition window using parallel imaging (PI) which improves the sensitivity of ASL-CMR [2]. Jao et al. also showed that PN can be further reduced using generalized autocalibrating partial parallel acquisition (GRAPPA) which allowed higher resolution imaging with slightly longer acquisition window [3]. In this study, we retrospectively explore the optimal Cartesian sampling pattern, acceleration factor, and reconstruction technique for ASL-CMR.METHODS:
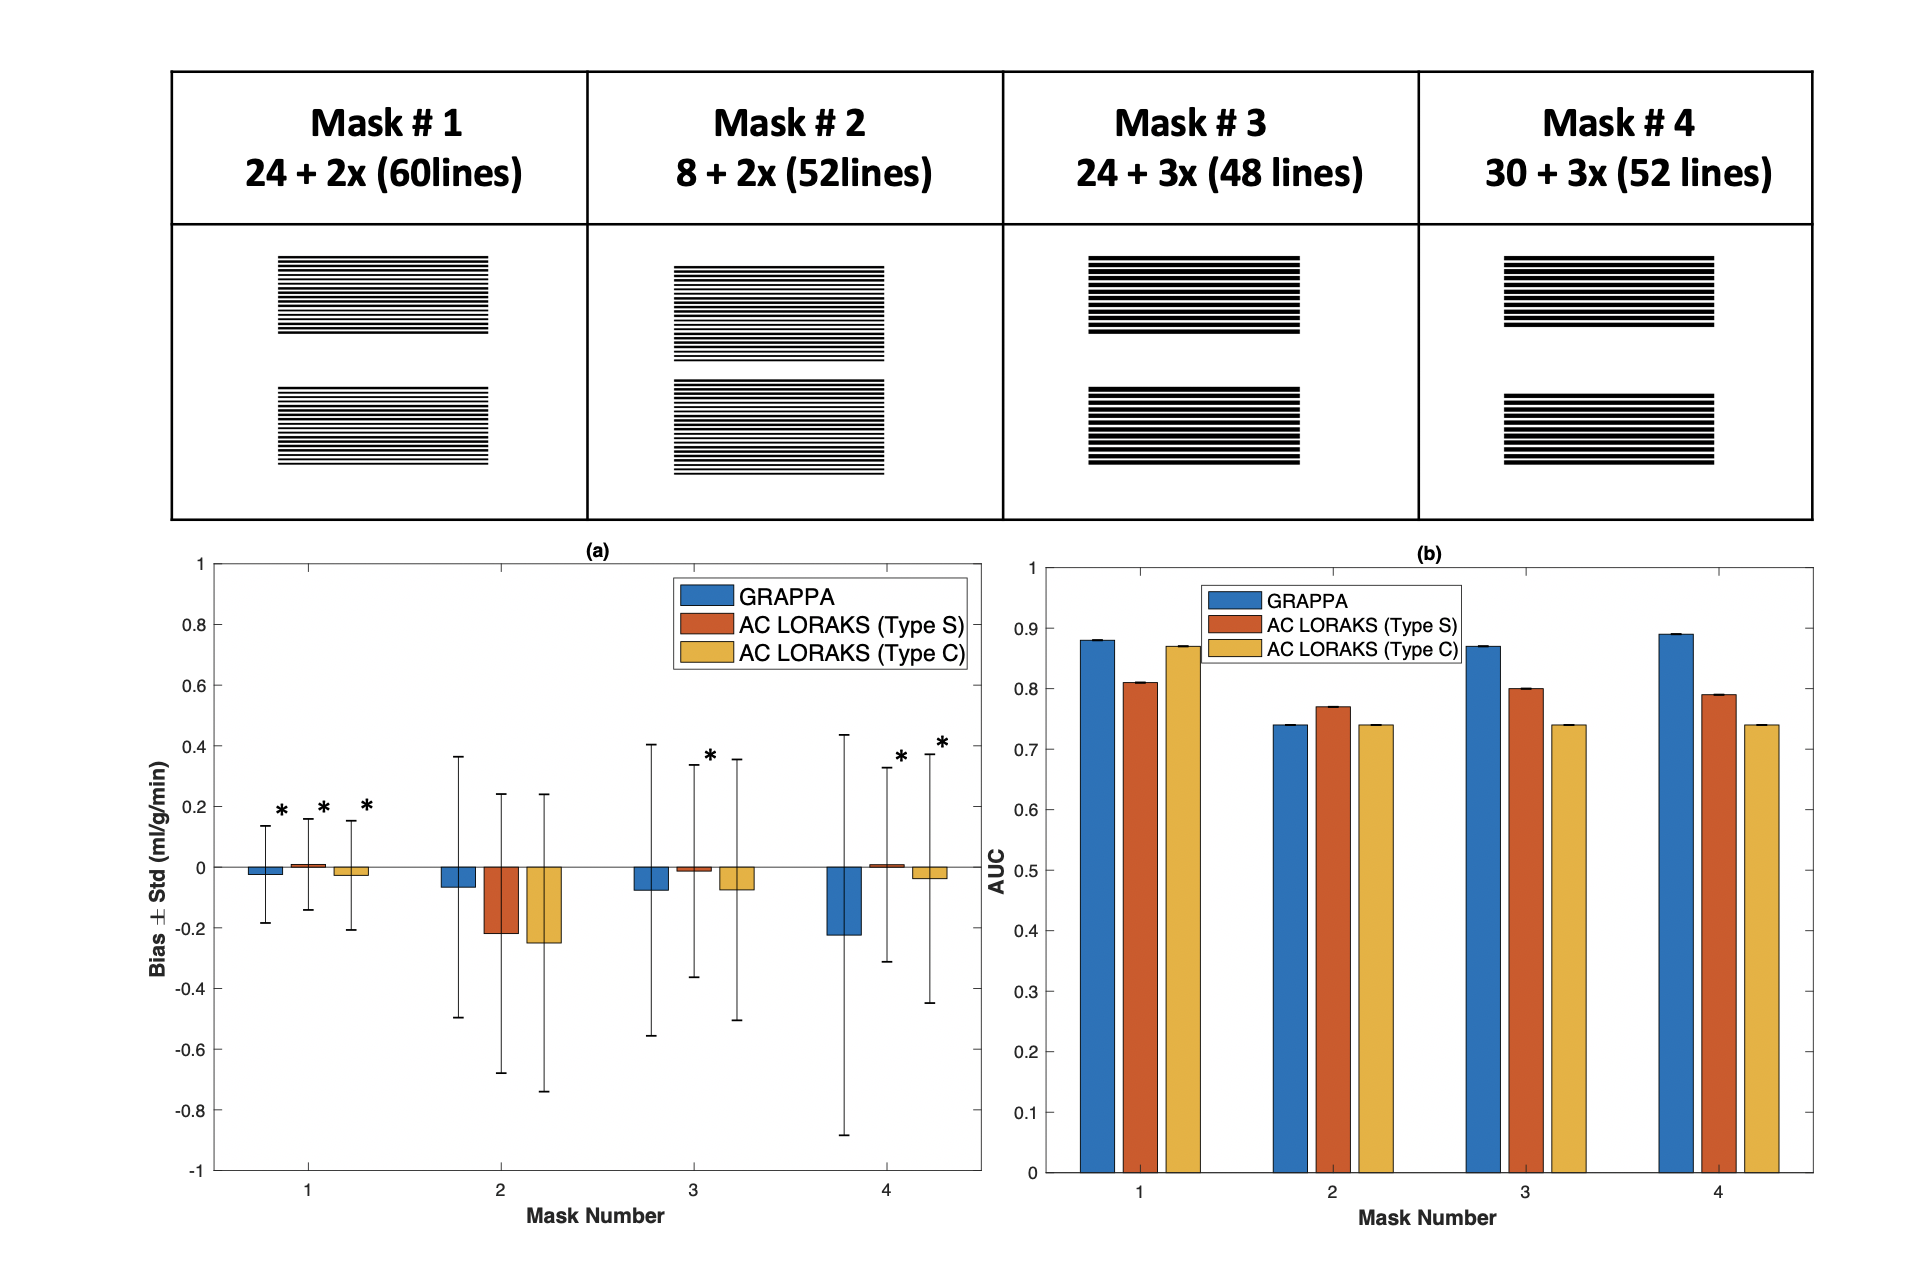
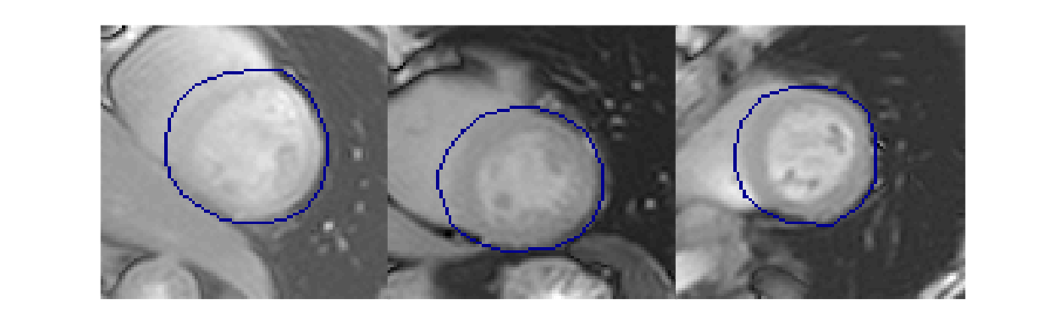
Experiment Design: We used fully-sampled Cartesian bSSFP ASL-CMR data from a previously published study [4]. Both rest and stress data from all twenty-nine patients, with suspected CAD was used in our study. We retrospectively compared different sampling patterns and reconstruction approaches as shown in Figure 1. We performed a parameter optimization for each reconstruction technique at each setting. Parameters were selected to minimize normalized root mean square error (NRMSE) over the left ventricular region of interest (illustrated in Figure 2) across all subjects. The accuracy of regional MP measurements was evaluated for reconstructions performed with the optimal parameters. Fully-sampled reconstructions were used as the reference.Analysis: Retrospectively under-sampled data was reconstructed using a custom implementation of GRAPPA [5] and a previously published implementation of AC-LORAKS [6]. All images were cropped to the same dimensions and manually segmented masks from the published study were used to segment LV myocardium. Myocardium was divided into six segments for regional analysis. Regional signal intensities were calculated using spatio-temporal filtering as proposed by Jao et al. [7]. MP, and PN were calculated as described by Zun et al [8]. Temporal signal to noise ratio (TSNR) was calculated as MP/PN.
For each setting bias $$$MP_{reference} - MP_{estimated}$$$ in MP was calculated for all segments. Region operator characteristic curves were used to evaluate the effect of under-sampling and reconstructions on diagnostic accuracy. All segments with resting TSNR <2 in the reference data were excluded like the original study. Statistical equivalence with the reference measurements (fully-sampled bSSFP) was used as the accuracy criteria and standard deviation (stdev) of bias was used as the precision criteria.
RESULTS:
A total of 76 out of 174 segments were rejected due to low TSNR. Figure 1 show bias ± stdev of bias and diagnostic accuracy for all mask and reconstruction techniques. Only mask 1 provides stdev of bias <0.2ml/g/min. For the rest of the masks, stdev of bias is greater than 0.2 ml/g/min for both reconstruction techniques GRAPPA and AC LORAKS. Estimated MP values for mask 1 were statistically equivalent to reference MP values, using two one sided test (TOST) with p-values < 0.01 for all three reconstruction techniques. Figure 3 illustrates the reconstruction parameter optimization sweep for sampling pattern number 1. GRAPPA provides the lowest NRMSE in ROI with kernels size 7x7, as shown in Figure 3 (a). C-type AC-LORAKS resulted inthe lowest NRMSE for rank 50 with k-space radius 2, whereas S type yielded lowest NRMSE for rank 210 with k-space radius 3 as shown in Figure 3 (b) and (c).DISCUSSION:
We compare established auto-calibrating parallel imaging reconstruction techniques, GRAPPA and AC-LORAKS, for ASL-CMR. As per our accuracy criteria, sampling mask 1 meet accuracy and precision requirements; it provides statistical equivalent MP values and low standard deviation of bias. Although this mask has been used in previous studies for this application [3] but optimal rate for this application remained unexplored/undetermined. Even though mask number 4 also yield MP values that were statistical equivalent to reference methods, the estimated MP had 2x higher stdev of bias compared to mask 1. It is rather surprising that diagnostic accuracy (AUC) did not decrease with increase in standard deviation of bias even in cases where MP measurements were not statistically equivalent to the reference method. This requires further exploration. A key limitation of this study was the lack of a prospective comparison of accelerated and fully-sampled approaches and their comparison against reference gold standard methods such as micro-spheres in large animals. This is necessary for a rigorous study and will be explored in future work.CONCLUSION:
We demonstrate in a retrospective study that rate 1.6 acceleration with mask 1, which was already being used is actually the best setting for ASL-CMR that gives most accurate and precise MP measurements when compared to fully sampled reference data.Acknowledgements
We acknowledge NIH Grant # HL-130494, and Fulbright Exchange program. We also acknowledge Tae Hyung Kim for his valuable insights regarding AC LORAKS.References
[1] M. D. Cerqueira et al., “Recommendations for reducing radiation exposure in myocardial perfusion imaging,” Journal of Nuclear Cardiology. 2010.
[2] H. P. Do, T. R. Jao, and K. S. Nayak, “Myocardial arterial spin labeling perfusion imaging with improved sensitivity,” J. Cardiovasc. Magn. Reson., 2014.
[3] T. R. Jao, H. P. Do, and K. S. Nayak, “Myocardial ASL-CMR perfusion imaging with improved sensitivity using GRAPPA,” J. Cardiovasc. Magn. Reson., 2016.
[4] Z. Zun, P. Varadarajan, R. G. Pai, E. C. Wong, and K. S. Nayak, “Arterial spin labeled CMR detects clinically relevant increase in myocardial blood flow with vasodilation,” JACC Cardiovasc. Imaging, 2011.
[5] M. Uecker et al., “ESPIRiT - An eigenvalue approach to autocalibrating parallel MRI: Where SENSE meets GRAPPA,” Magn. Reson. Med., 2014.
[6] J. P. Haldar, “Low-Rank Modeling of Local k-Space Neighborhoods (LORAKS) for Constrained MRI,” IEEE Trans. Med. Imaging, 2014.
[7] T. Jao, Z. Zun, P. Varadarajan, R. G. Pai, and K. S. Nayak, “Spatiotemporal Filtering of Myocardial ASL Data: Implications in Detection and Diagnosis of Coronary Artery Disease,” in ISMRM, 2012, vol. 20, p. 3892.
[8] G. Zun, E. C. Wong, and K. S. Nayak, “Assessment of myocardial blood flow (MBF) in humans using arterial spin labeling (ASL): Feasibility and noise analysis,” Magn. Reson. Med., 2009.
Figures