3468
Direct Estimation of pre-contrast T1 for DCE-MRI1Electrical and Computer Engineering, University of Southern California, Los Angeles, CA, United States, 2Global MR Applications & Workflow, GE Healthcare, Calgary, AB, Canada, 3Radiology, University of Calgary, Calgary, AB, Canada
Synopsis
Quantitative DCE-MRI requires pre-contrast T1 mapping with matching resolution and coverage. Recent studies have shown that sparse sampling and constrained reconstruction can be applied to both DCE-MRI and pre-contrast T1 mapping with the variable flip angle (VFA) approach. Here, we demonstrate and evaluate direct estimation of T1 from sparsely sampled VFA raw data. In healthy subjects, we demonstrate superior T1 estimation compared with prior methods at subsampling factors >10.
Purpose
To develop and evaluate efficient pre-contrast T1 mapping compatible with the workflow requirements of high-resolution whole-brain DCE-MRI.Introduction
Dynamic contrast enhancement (DCE)-MRI is a powerful tool that can reveal the spatial distribution of vascular parameters, including permeability and plasma volume. Recent studies have overcome traditional limitations such as poor spatial resolution and poor spatial coverage, using compressed sensing and constrained reconstruction 1-4. Quantitative DCE-MRI requires pre-contrast T1 and M0 maps with matching spatial resolution and coverage 5,6, which would require prohibitively long scan time. However, recently demonstrated sparse sampling with model-based T1 estimation could make this possible 7,8. Sparse variable flip angle (VFA) T1 mapping has even been efficiently integrated into the pre-contrast phase of a DCE-MRI scan 3. The conventional reconstruction that combines parallel imaging and DESPOT1 modeling has thus far been unsuccessful at high undersampling factors (>10). Here, we demonstrate a framework for direct estimation of pre-contrast T1 and M0 that is inspired by recent direct estimation of tracer-kinetic parameter maps 9,10.Methods
VFA T1/M0 mapping is performed by solving the following model constrained inverse problem:$$p=\min_p \| U F S D (p) - k \|^2_{\ell_2}$$
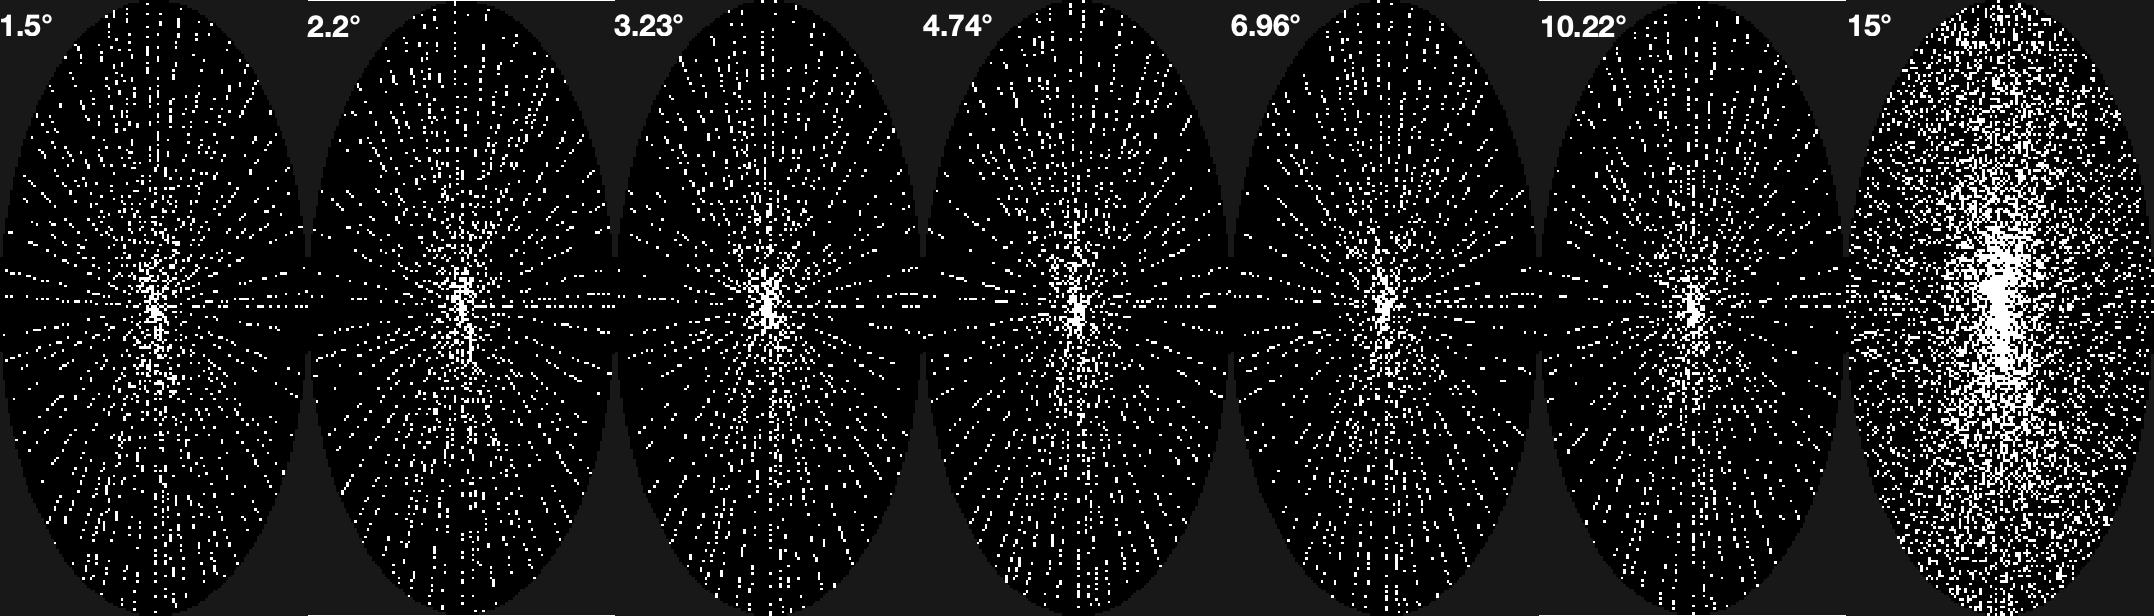
where $$$p$$$ concatenates T1 and M0 into a vector, $$$U$$$ is the subsampling operator, $$$F$$$ is the Fourier transform, $$$S$$$ is the coil sensitivity, $$$D$$$ is the SPGR signal operator, and $$$k$$$ is measured $$$k$$$-space data. This problem is solved using nonlinear conjugate gradient (NLCG). Fully sampled VFA data were acquired on one healthy male volunteer, using a GE MR750 scanner with a 12-channel head coil. The flip angles were logarithmically spaced from 1.5° to 15° 3. Parameters: 5 ms TR, 1.9 ms TE, 240×240×240 mm3 FOV, 2 mm slice thickness, and 256×240×120 matrix size. This data was subsampled to evaluate T1 and M0 mapping accuracy as a function of subsampling factor . Subsampling followed the randomized Golden-Angle (RGA) pattern 11 shown in Figure 1. Due to the elliptical footprint, we used a weighted sampling operator $$$U$$$ with small assigned weight (0.1) to $$$k$$$-space corners and set $$$k$$$ values in those locations to be zero. We report error and convergence speed within tissue regions of interest (ROI) for gray matter, white matter, and cerebrospinal fluid.
Results
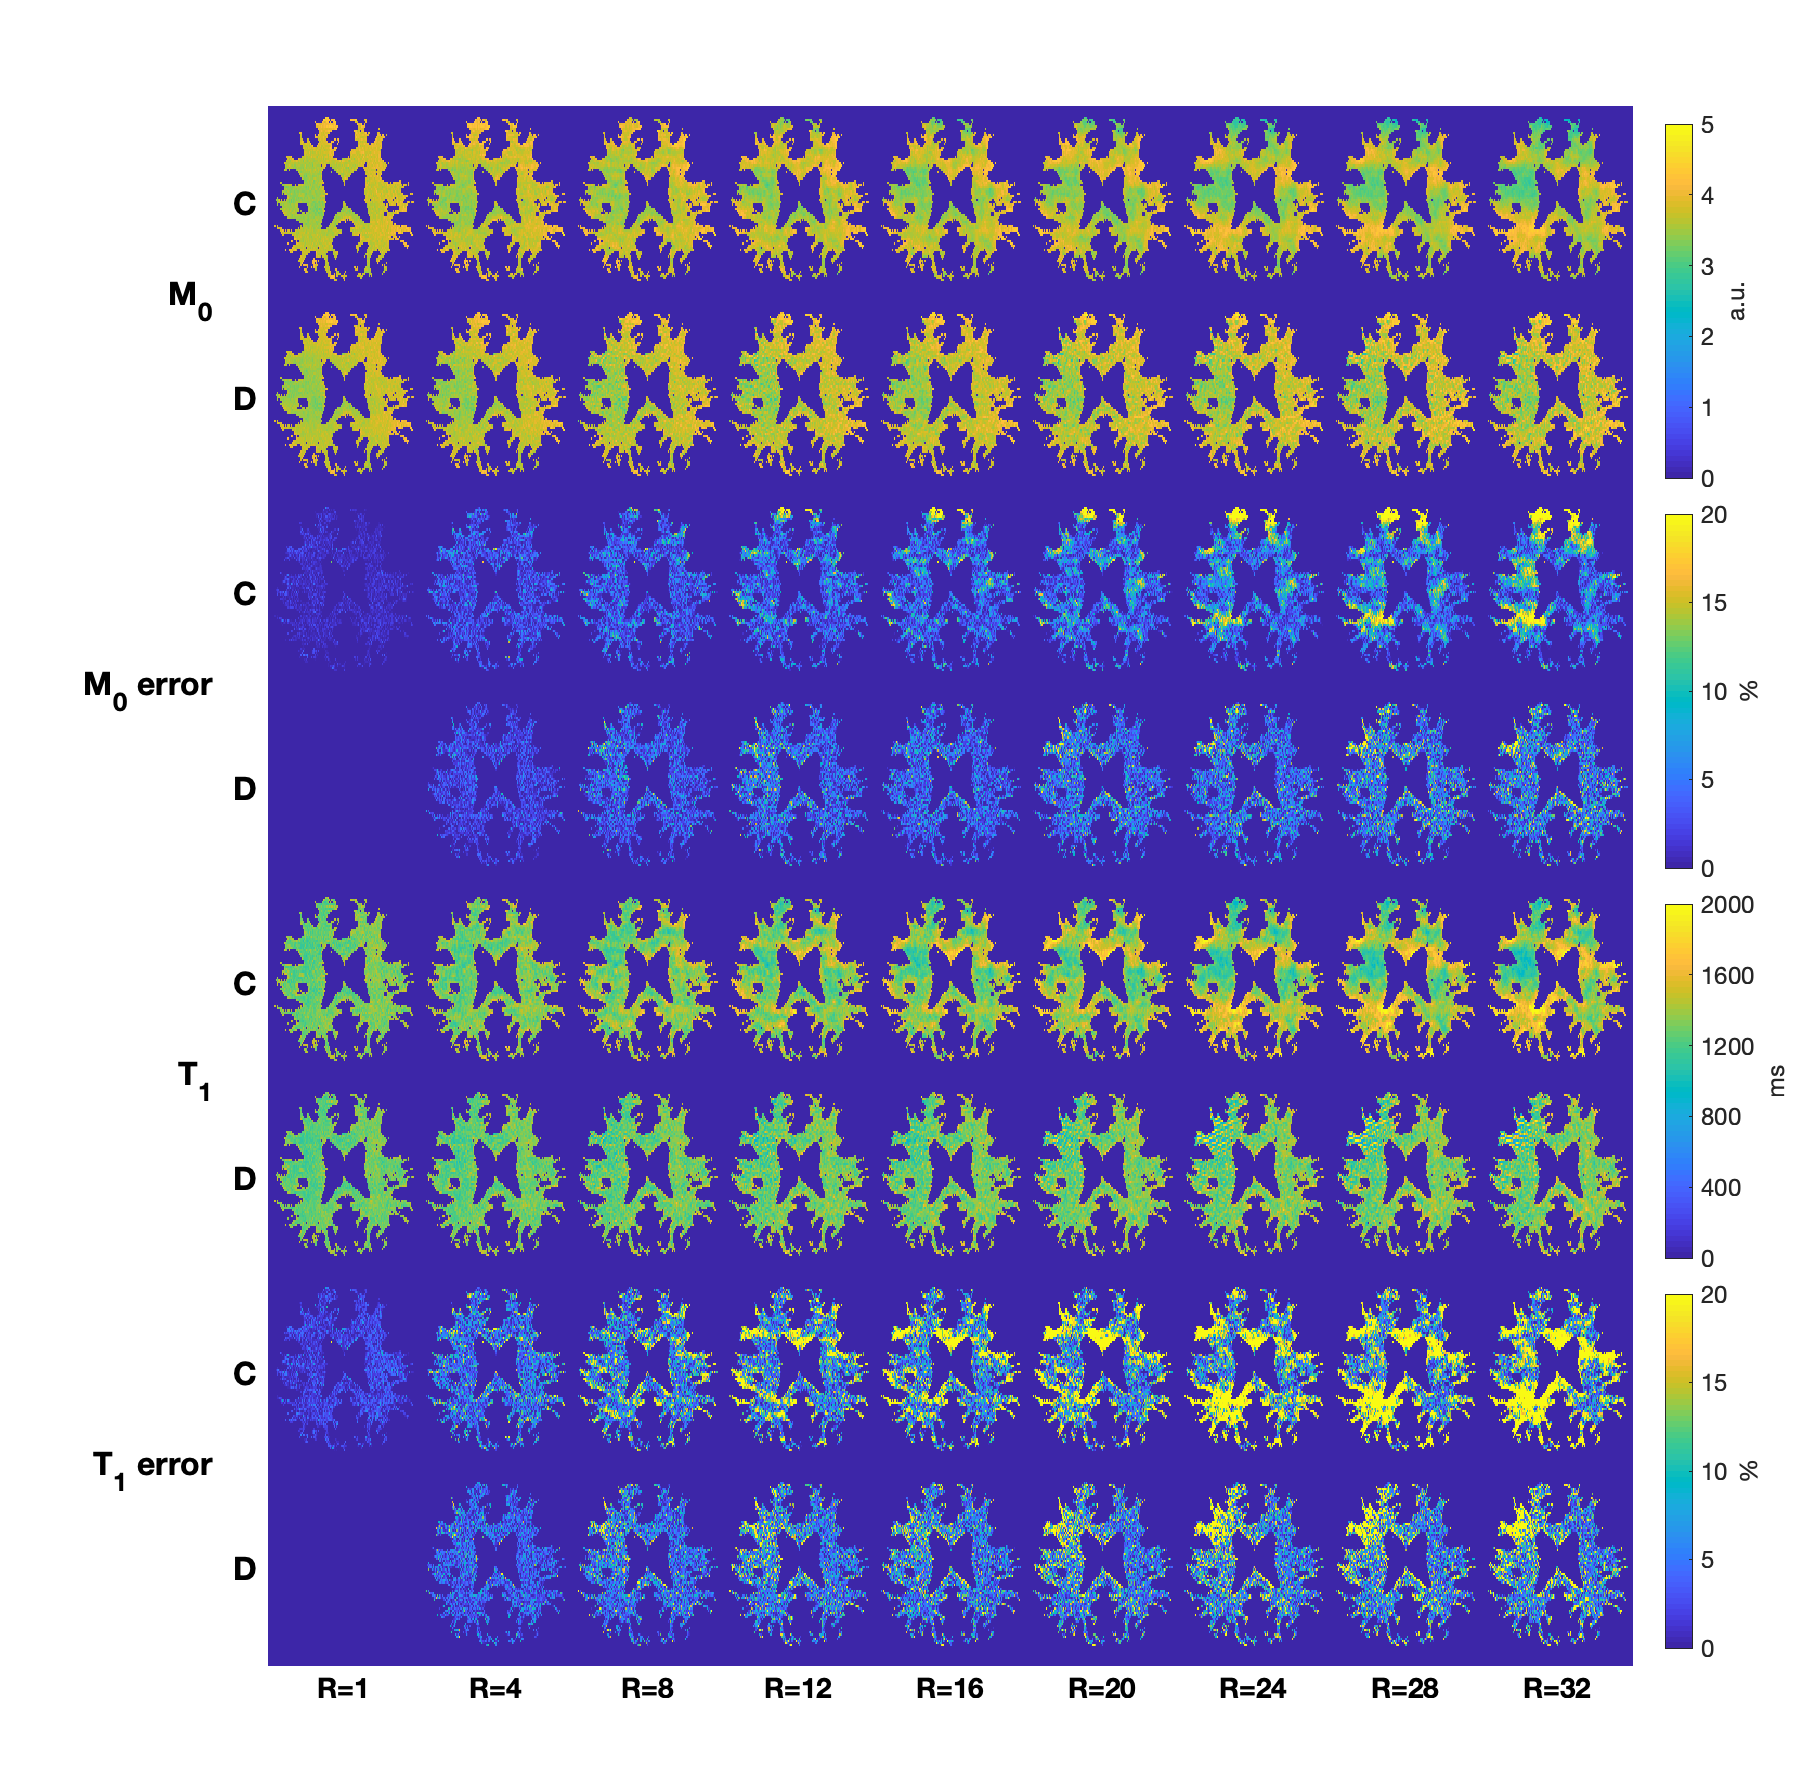
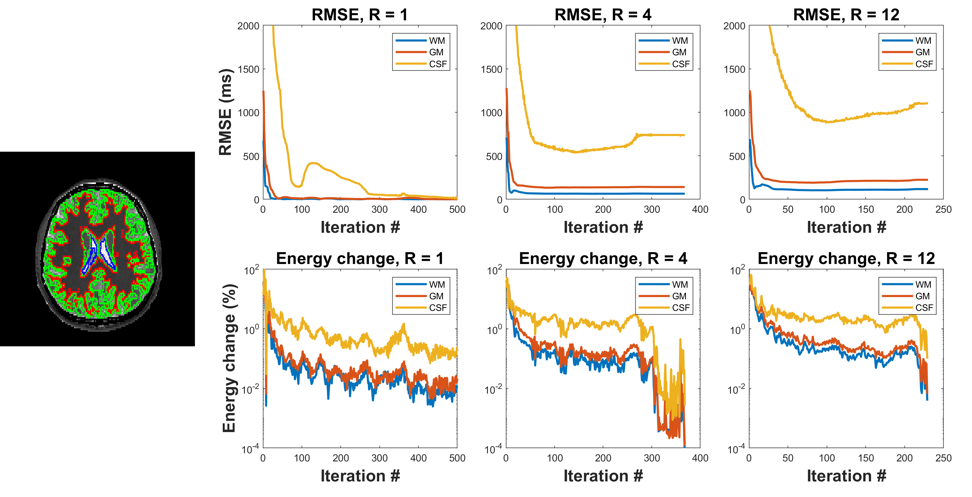
Figure 2 contains direct estimation results as a function of subsampling factor. Error was computed as percent difference with respect to the reference (fully sampled direct reconstruction). Error smoothly increases with subsampling factor, and direct estimation provides better performance than the conventional approach at all subsampling factors. This is especially true for R>10, where direct estimation has far fewer regions with errors larger than 20%.Figure 3 illustrates the algorithm convergence for WM, GM and CSF ROI’s for three subsampling factors. As expected, we observe that CSF, which has the longest T1 values, takes longest to converge and had the largest residual errors. RMSE in CSF decreased non-monotonically during the iterations of the optimizer.
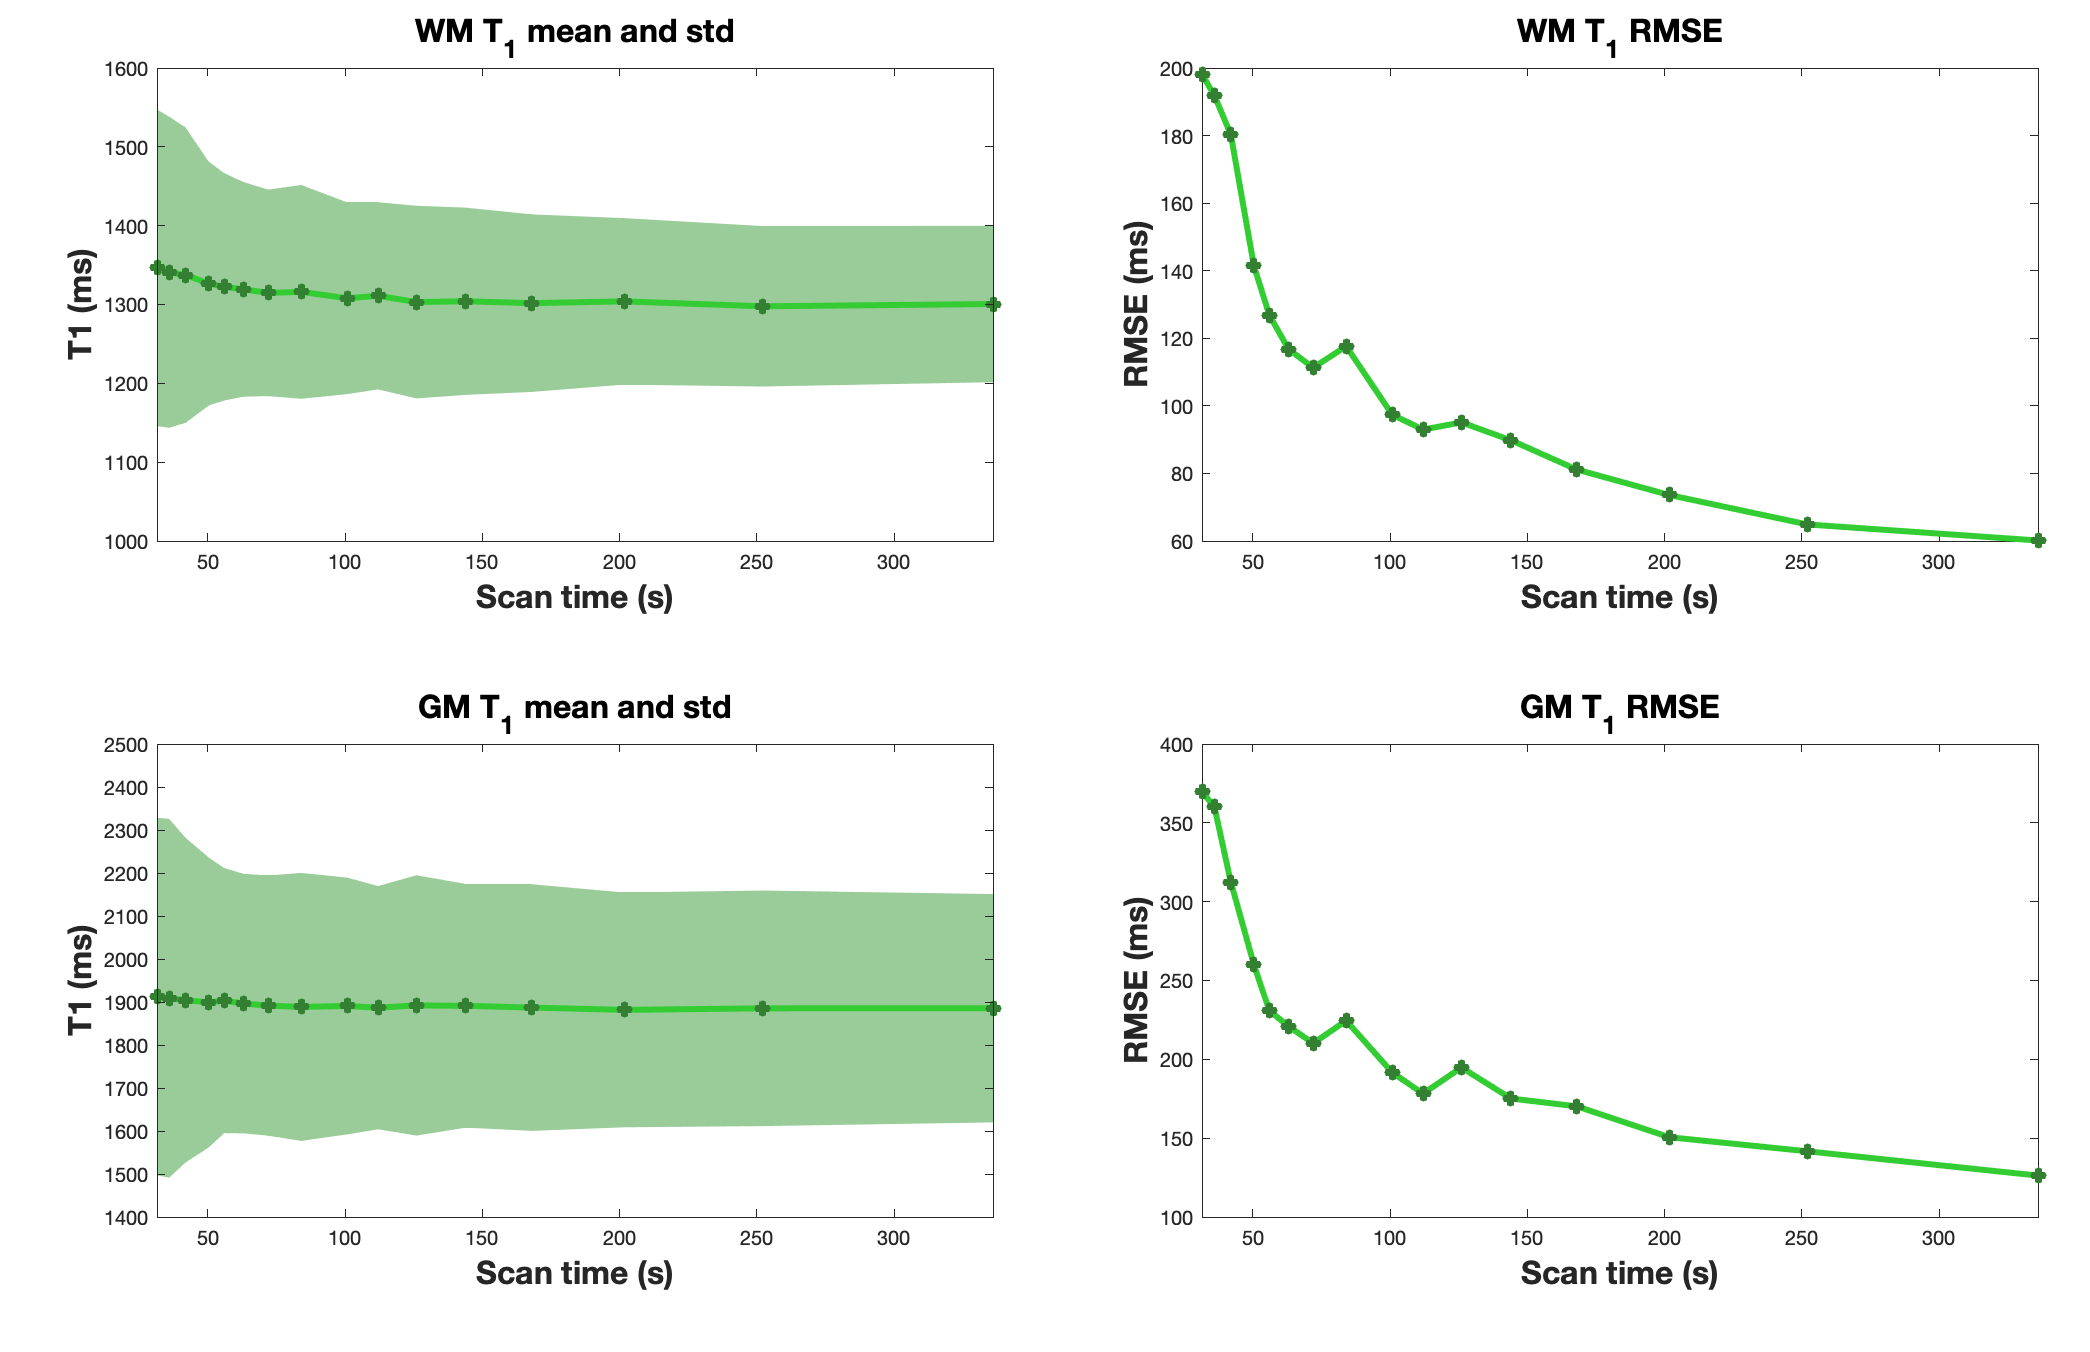
Figure 4 shows T1 mean, standard deviation and RMSE for the proposed approach from different subsampling factor. As expected, T1 mean, std and RMSE increase as subsampling factor increases. We also observed non-monotonic decrease of RMSE as a function of scan time.
Figure 5 shows Fourier Radial Error Spectrum Plots (ESP) 12,13 for the conventional approach and proposed approach. The proposed approach provides superior performance in low to mid-range of spatial frequencies for all subsampling factors.
Discussion
Direct T1 and M0 estimation can be applied to sparse pre-contrast VFA mapping, and it provides several improvements over conventional indirect approaches. In stark contrast to conventional approaches that use two separate steps, direct estimation integrates image reconstruction and T1 mapping in a single step. This simplification allows the algorithm to exploit rich data redundancy along the flip angle dimension. This is expected to allow even faster data acquisition, and a superior trade-off between scan time and performance.Interestingly, we noticed a small T1 bias as R increases. For white matter, the bias was always less than 60 ms, and for R<10 it was less than 20 ms. This is an important consideration that requires further investigation. We also observed slow convergence in long T1 tissues, partially due to the VFA angles being optimized for T1 values closer to white matter. This warrants further investigation if tracer kinetic maps are being used in long T1 regions. We further observed non-monotonic behavior of RMSE with respect to iterations during optimization and scan time. We will investigate reasons for this non-monotonic behavior and suitable stopping criteria in future research.
This study has several practical limitations. We utilized only one fully sampled volunteer dataset. This would need to be repeated in several subjects, preferably patients receiving clinically indicated DCE-MRI. Fully-sampled VFA data were subsampled in this study. Findings would need to be tested with prospective undersampling, and ideally integrated into a comprehensive high-resolution whole-brain DCE-MRI protocol3.
Conclusion
Direct estimation of pre-contrast T1 and M0 for high resolution DCE-MRI is feasible. The proposed approach provides superior performance especially for subsampling factors >10.Acknowledgements
We acknowledge National Institute of Health grant support (#R33-CA225400).References
[1] R. M. Lebel, J. Jones, J. C. Ferre, M. Law, K. S. Nayak. Highly accelerated dynamic contrast enhanced imaging. Magnetic Resonance in Medicine. 71(2):635-644. February 2014.
[2] Y. Guo, R. M. Lebel, Y. Zhu, S. G. Lingala, M. S. Shiroishi, M. Law, K. S. Nayak. High-resolution Whole-brain DCE-MRI Using Constrained Reconstruction: Prospective Clinical Evaluation in Brain Tumor Patients. Medical Physics 43:2013. April 2016.
[3] R. M. Lebel, Y. Guo, S. G. Lingala, R. Frayne, K. S. Nayak. "Highly Accelerated DCE imaging with integrated T1 mapping." Proc. ISMRM 25th Scientific Sessions, Honolulu, April 2017, p138.
[4] J. S. Park, E. Lim, S. H. Choi, C. H. Sohn, J. Lee, J. Park, Model-Based High-Definition Dynamic Contrast Enhanced MRI for Concurrent Estimation of Perfusion and Microvascular Permeability, Medical Image Analysis 59 (2020) 101566.
[5] C. Lavini, Simulating the effect of input errors on the accuracy of Tofts’ pharmacokinetic model parameters. Magn. Reson. Imaging 2015;33:222–235.
[6] Di Giovanni P., Azlan CA, Ahearn T. S., Semple S. I., Gilbert F. J., Redpath T. W.. The accuracy of pharmacokinetic parameter measurement in DCE-MRI of the breast at 3 T. Phys. Med. Biol. 2010;55:121–132.
[7] Zhao B., Lam F., Liang Z., Model-based MR parameter mapping with sparsity constraints Parameter estimation and performance bound, IEEE Trans Med Imaging. 2014 Sep; 33(9): 1832-1844.
[8] Maier O., Schoormans J., Schloegl M., et al. Rapid T1 quantification from high resolution 3D data with model‐based reconstruction. Magn Reson Med. 2019;81:2072-2089.
[9] Dikaios N., Arridge S., Hamy V., Punwani S., Atkinson D. Direct parametric reconstruction from undersampled (k, t)-space data in dynamic contrast enhanced MRI. Med Image Anal 2014;18:989–1001.
[10] Y. Guo, S. G. Lingala, Y. Zhu, R. M. Lebel, K. S. Nayak. Direct Estimation of Tracer-Kinetic Parameter Maps from Highly Undersampled Brain DCE-MRI. Magnetic Resonance in Medicine. 78(4):1566-1578. October 2017.
[11] Y. Zhu, Y. Guo, S. G. Lingala, R. M. Lebel, M. Law, K. S. Nayak. GOCART: GOlden-angle CArtesian Randomized Time-resolved 3D MRI. Magnetic Resonance Imaging. 34: 940-950. September 2016.
[12] T. H. Kim, J. P. Haldar. The Fourier Radial Error Spectrum Plot: A more nuanced quantitative evaluation of image reconstruction quality. IEEE International Symposium on Biomedical Imaging, Washington, DC, 2018.
[13] T. H. Kim, J. P. Haldar. Assessing MR image reconstruction quality using the Fourier Radial Error Spectrum plot. Joint Annual Meeting ISMRM-ESMRMB, Paris, 2018.
Figures