3467
Model-Based Iterative Reconstruction for diffusion Data with Phase Correction and Penalty Term1Internal Medicine II, University Ulm Medical Center, Ulm, Germany, 2Department of Radiology, University Ulm Medical Center, Ulm, Germany
Synopsis
A diffusion model is used to
generate a synthetic k-space which is compared with acquired k-space data.
Minimization of the cost function with an additional regularization term in
form of a total variation is performed by a nonlinear conjugated gradient
solver. Phase alterations due to strong diffusion gradients are considered by
introduction of a phase operator. Data of nine human knee joints were acquired
with a multi-shot diffusion weighted EPI sequence. Undersampling factors
between R=1.5 and R=3.57 yielded excellent results for magnitude and ADC data.
Introduction
Contrast agent enhanced T1-weighted sequences are most commonly used for synovitis imaging in knee joints. Especially for pediatric patients, diffusion weighted imaging (DWI) can be an alternative [1]. High spatial resolutions lead to non-acceptable scan times for clinical routine. To reduce the duration of pediatric examinations by undersampling, a model based iterative reconstruction in combination with a total variation (TV) regularization similar to the suggestion by Welsh et al. [2] has been applied. The approach iteratively optimizes the final magnetization and ADC maps as free variables under full consideration of phase alterations between the different b-value images.Methods
A series of images with different diffusion weightings $$$b$$$ shows a b-value dependent decay of signal intensity $$$S(b)$$$ due to the tissue dependent diffusion coefficient $$$D$$$:$$ S(b) = S_0 \cdot exp(-b \cdot D) $$
In clinical routine an apparent diffusion coefficient ($$$ADC$$$) is calculated by fitting this equation to a series of pixels with the same spatial coordinate over different b-values. Instead, the model based method compares a Fourier transformation ($$$A$$$) of a synthetic diffusion model generated Image series with the measured k-space data $$$k$$$. The model depends on the image amplitude $$$m_0$$$ without diffusion weighting and an $$$ADC$$$ map. The cost function $$$\phi$$$ consists of an $$$l_2$$$-norm of the difference between the synthetic and measured data and an additional regularization by applying a total variation filter on the ADC data:
$$ \phi (m_0 , ADC) = \frac{1}{2} \sum_{b} \sum_{c} || A \cdot \{P_b \cdot C_c \cdot (m_0 \cdot e^{-b \cdot ADC} ) \} -k_{b,c} ||_2^2 + \lambda_s || \nabla _s (ADC)|| _1 $$
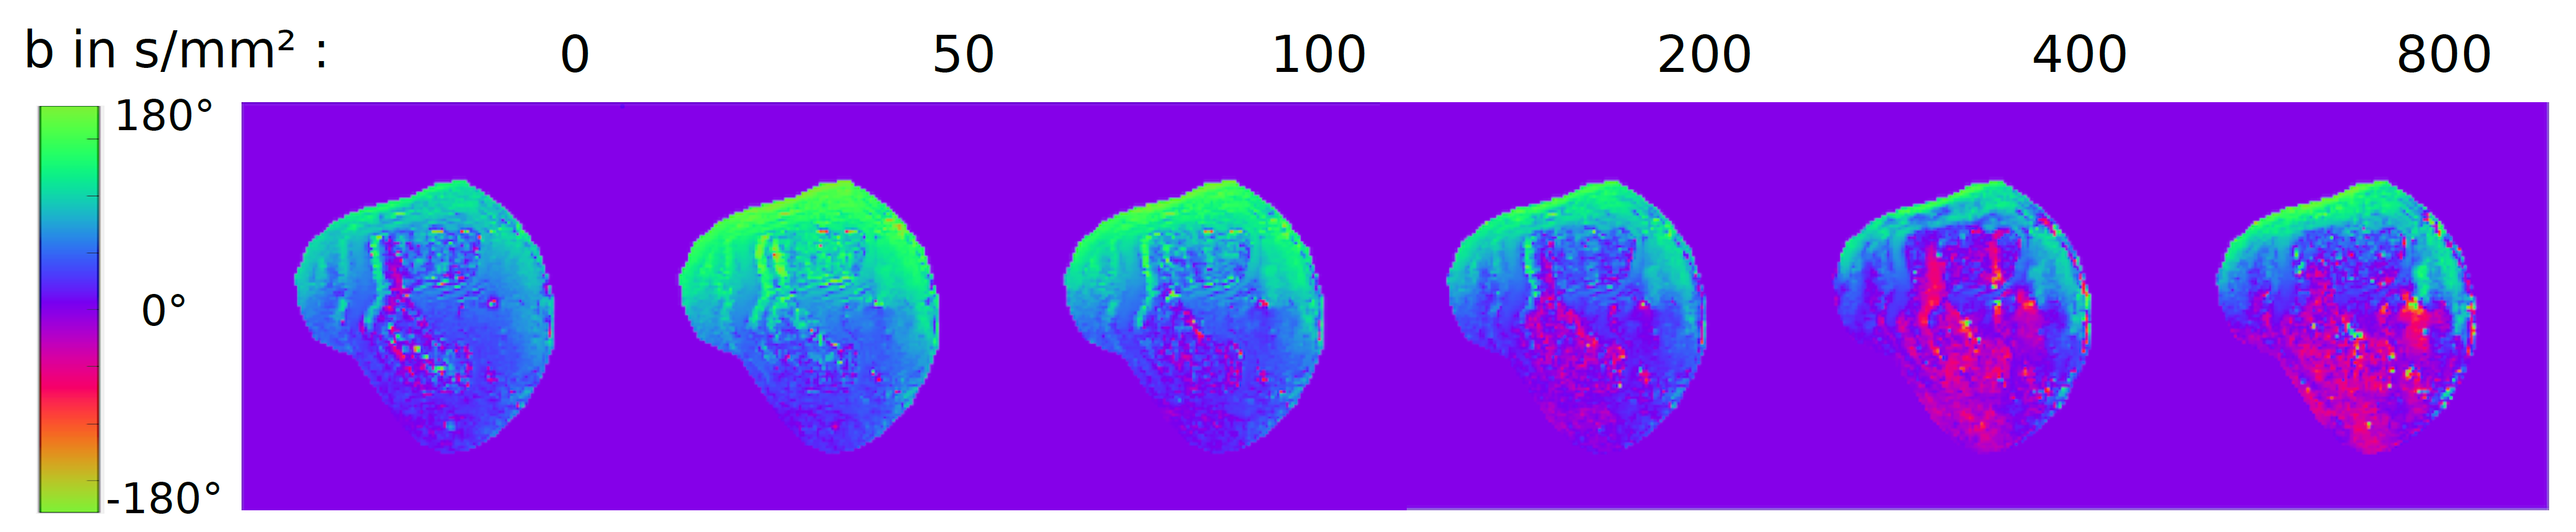
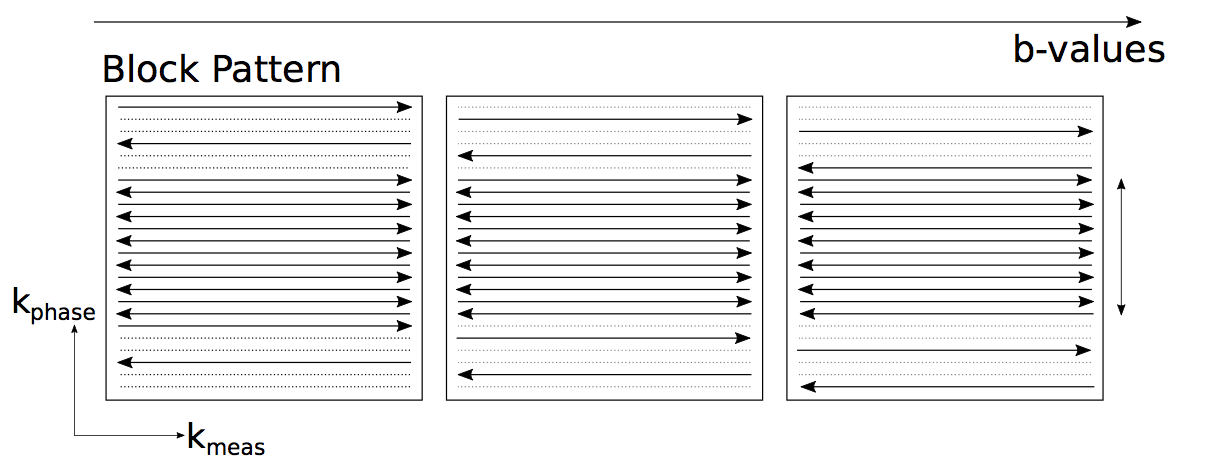
Phase alterations introduced by the strong diffusion gradient (Fig. 1) are taken into account by multiplying the model by the operator $$$ P $$$. Further, the sensitivity maps $$$C$$$ of the different coils $$$c$$$ are considered during optimization. A non-linear conjugated gradient solver is used to minimize the cost function within 200 iterations to determine $$$m_0$$$ and $$$ADC$$$. As the phase varies smoothly, $$$P$$$ can be approximated from a low-resolution image derived from the central k-space lines. Therefore, $$$\frac{1}{2}$$$, $$$\frac{1}{4}$$$,$$$\frac{1}{6}$$$ and $$$\frac{1}{8}$$$ of the central k-space was fully sampled. Whereas the outer region of k-space was undersampled by a factor R=6. Between subsequently acquired b-values the outer undersampling pattern was shifted to ensure coverage of each k-space line at least once (Fig. 2). The resulting undersampling factors were 1.67, 2.5, 3.13, 3.56. As an initial value for the $$$ADC$$$ the diffusivity of water at room temperature and for $$$m_0$$$ the mean value of the low-resolution images were used.
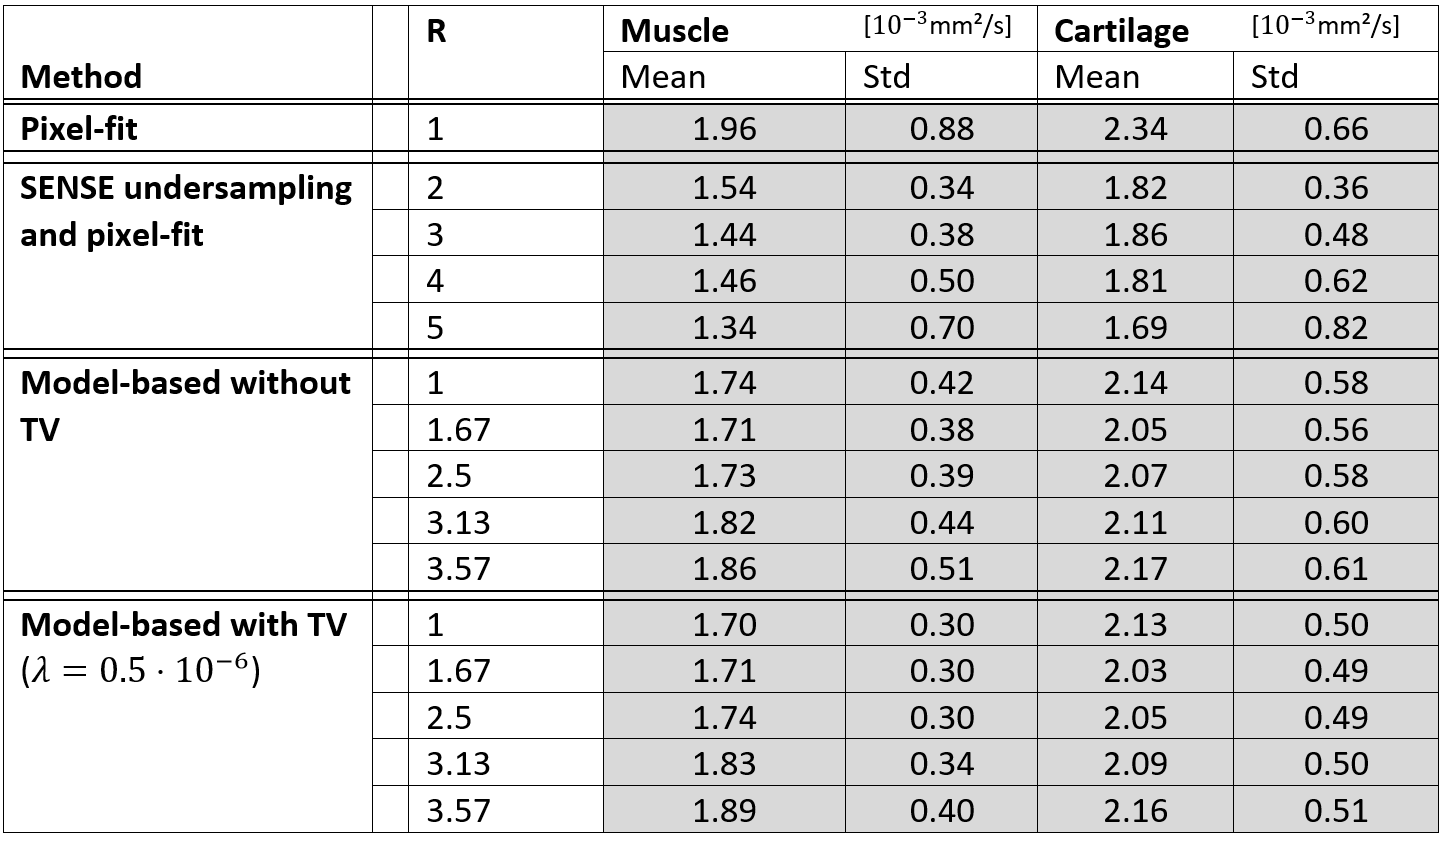
Data were acquired in nine healthy volunteers on an Achieva 3 T (Philips Healthcare, Best, The Netherlands) with an eight channel knee coil and a multi-shot DW EPI sequence. The scan parameters were: EPI-factor = 11; TE = 72 ms; TR = 4000 ms; FOV: 180x180x24 mm; r: 1.3x1.3x5 mm³; b-values: 0, 50, 100, 200, 400, 800 s²/mm. $$$ADC$$$ and standard deviation of the cartilage between patella and femur and of the gastrocnemius derived from the suggested approach were compared with pixel-wise fitted images, obtained from complete data sets and respective undersampled data sets individually reconstructed with SENSE.
Results
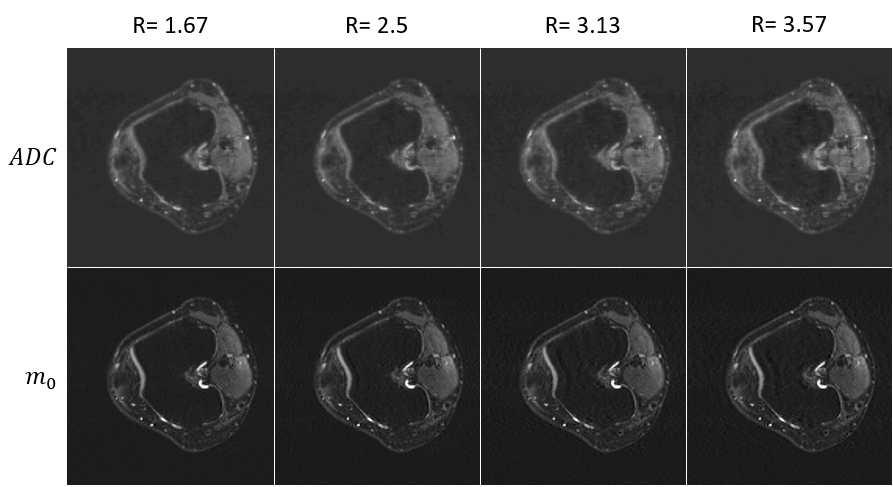
A lambda of $$$0.5 \cdot 10^{-6}$$$ yielded reasonable image quality for $$$m_0$$$ as well as for the $$$ADC$$$ maps without any obvious regularization artifacts (Fig. 3) for undersampling factors between R= 1.5 and R = 3.57. Direct comparison with the $$$ADC$$$ values derived from fully sampled data (Table 1) reveals errors in the 14% range for the iterative reconstruction and 27% for the SENSE based pixel fit. T-Tests show a significant difference for all undersampled model based reconstructed ADC maps compared with SENSE reconstructed maps with the nearest undersampling factor. Additional regularization mainly improved the standard deviation in the $$$ADC$$$ maps. Figure 3 visualizes the behavior that the $$$ADC$$$ map with the highest undersamplings shows increased absolute values. Additionally a less sampled k-space and the missing phase information introduces noise and blur which increases the standard deviation.Discussion
Model based reconstructions with R=1.67 show a decrease of up to 5% in $$$ADC$$$ compared to values without undersampling. For higher undersampling factors the values increase again. This might be caused by an insufficient minimization of the cost function. A reason for the increase of $$$ADC$$$ values with higher undersampling could be the less dense information at k-space center, which causes less spatial resolution of the phase Information.Conclusion
The model based reconstruction has shown the potential to reconstruct undersampled diffusion data of knee joins with more accurate than a SENSE based pixel fit. Additionally a regularization term can be incorporated providing improved standard deviation of the $$$ADC$$$ maps. A further extension of the reconstruction model by considering perfusion effects may provide additional relevant diagnostic information in the case of synovitis.Acknowledgements
The authors thank the Ulm University Center for Translational Imaging MoMAN for its support.References
1. HILBERT, Fabian, et al. Intravoxel incoherent motion magnetic resonance imaging of the knee joint in children with juvenile idiopathic arthritis. Pediatric radiology, 2017, 47. Jg., Nr. 6, S. 681-690.
2. WELSH, Christopher L., et al. Model‐based reconstruction of undersampled diffusion tensor k‐space data. Magnetic resonance in medicine, 2013, 70. Jg., Nr. 2, S. 429-440.
Figures