3466
Can an Adapted SEM Accurately Deliver 129Xe MRI-based Lung Morphometry Estimates1Physics and Astronomy, Western University, London, ON, Canada, 2Lawson Health Research Centre, London, ON, Canada, 3Department of Medicine, Respiratory, Western University, London, ON, Canada, 4Robarts Research institute, London, ON, Canada, 5Medical Biophysics, Western University, London, ON, Canada
Synopsis
We hypothesize that the SEM equation can be adapted for fitting the spin-density dependence of the MR signal similar to fitting the time or b-value dependences: Signal=exp[-(nr)^β], where 0<β<1, n is an image number and r is the fractional spin-density. Such an approach permits consideration of the signal intensity variation as reflection of the underlying spin-density variation and hence, reconstruction of the under-sampled k-space using the adapted SEM equation. In this proof-of-concept evaluation, we have demonstrated the feasibility of this approach in a small group of patients. Lung SV/ADC/morphometry/T2* maps have been generated using reconstructed images and their corresponding weighing.
Purpose
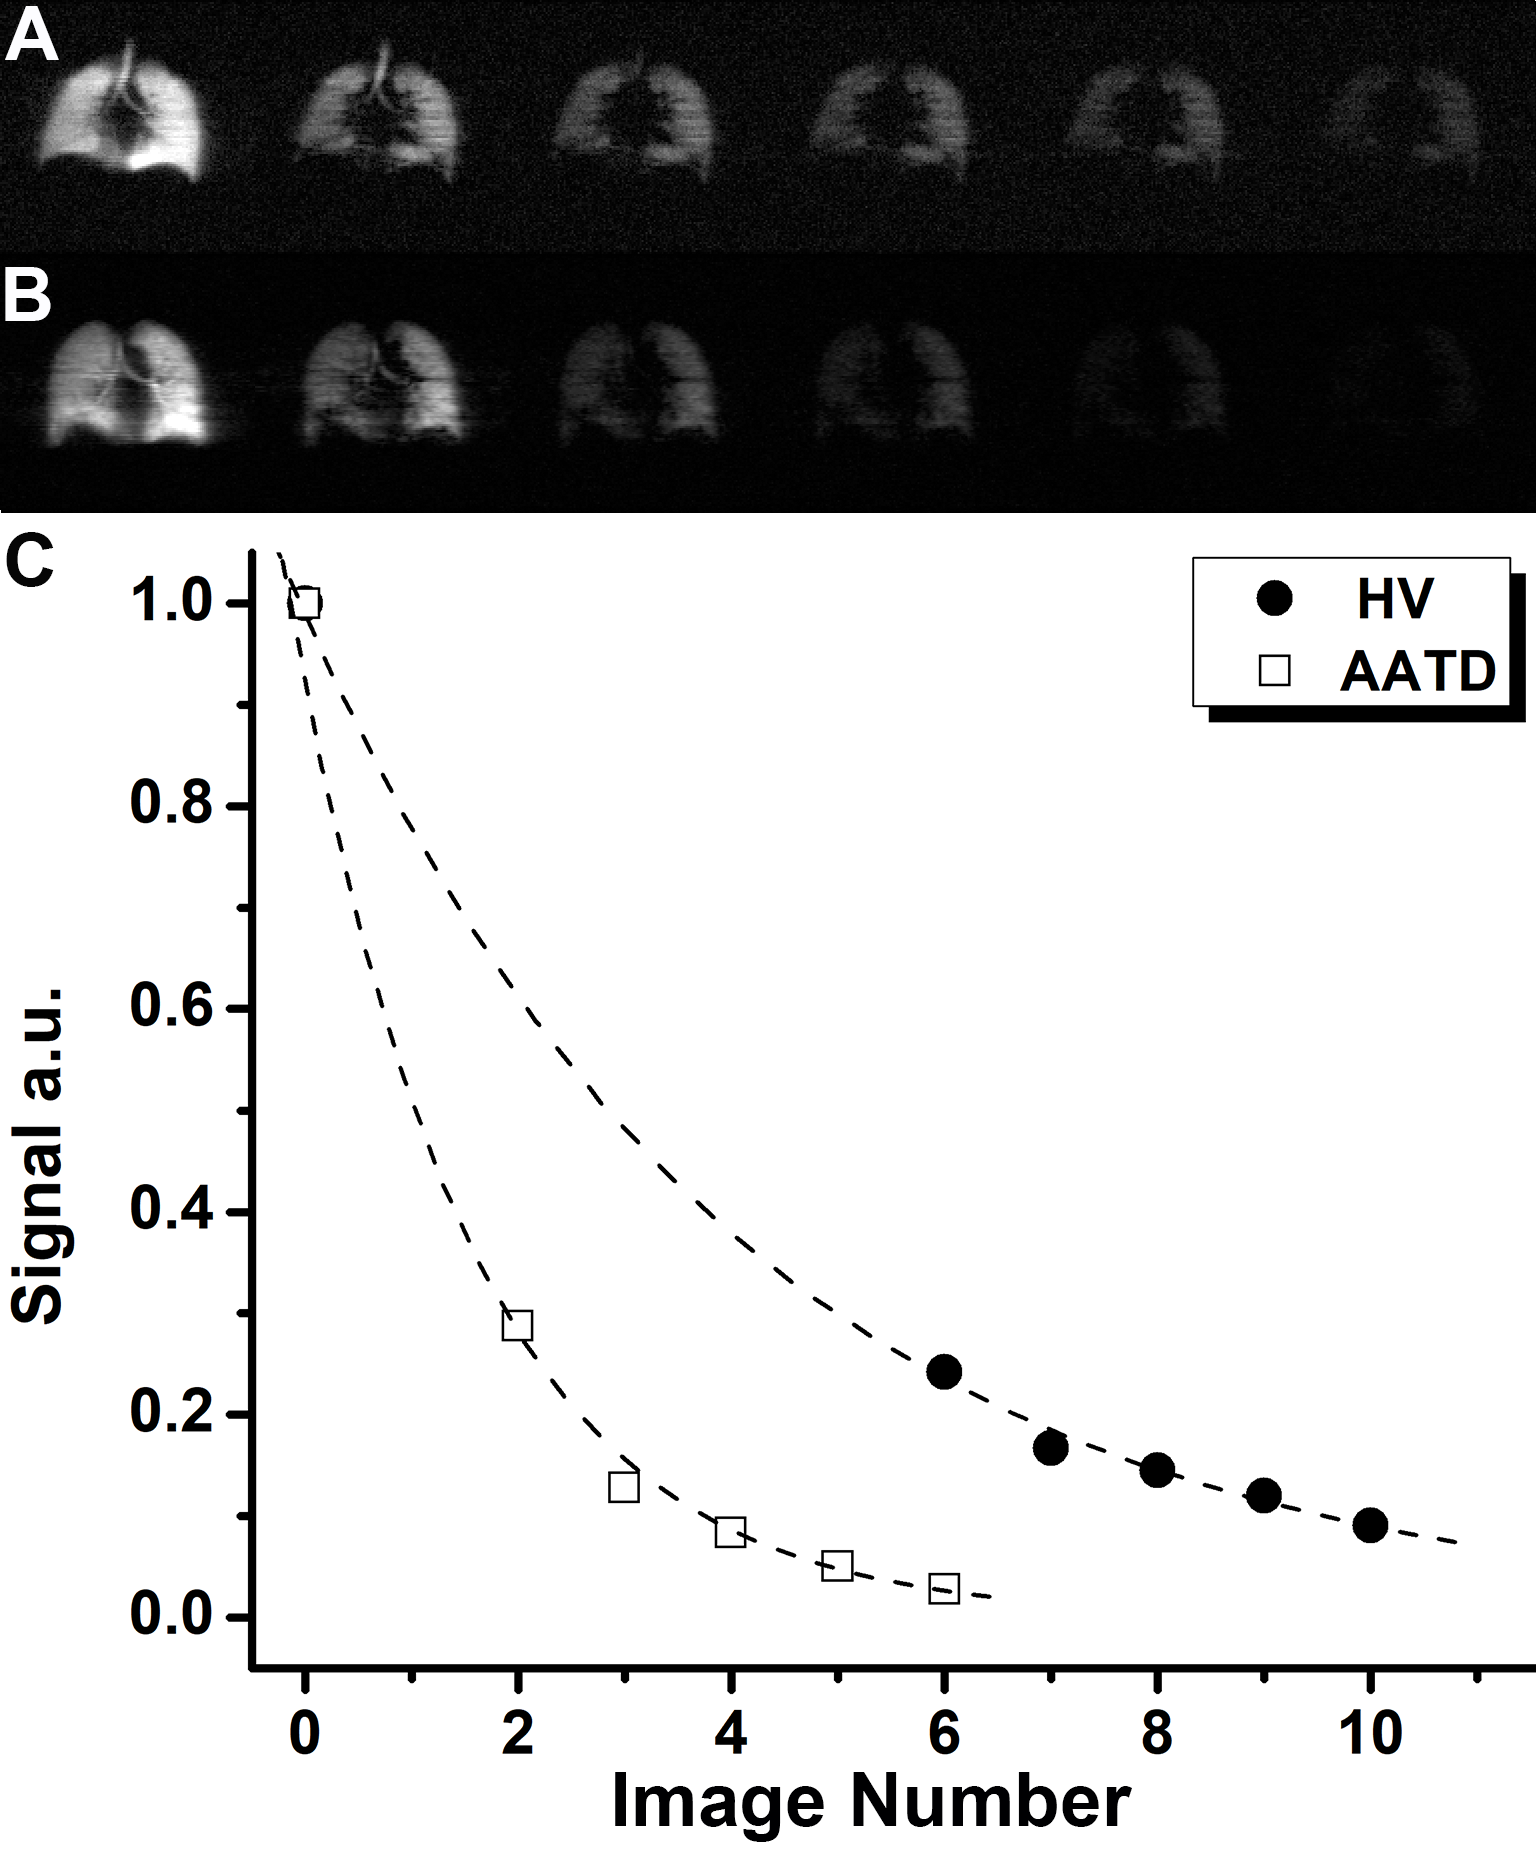
Multi-b diffusion-weighted hyperpolarized inhaled-gas MRI provides imaging biomarkers of terminal airspace enlargement, including apparent-diffusion-coefficients (ADC) and mean-diffusion-length (LmD), but clinical translation has been limited because image acquisition requires long-duration or multiple breath-holds which are not well-tolerated by patients. Recently, a stretched-exponential-model1 (SEM) combined with under-sampling in the imaging direction, employing a different under-sampling pattern for different b-values2 and an acceleration factor (AF) of 7 was used for the generation of 3He/129Xe static-ventilation (SV), T2* and multiple b-value diffusion-weighted MRI-based ADC and morphometry maps.3,4 The distribution of the signal weightings due to T2* and diffusion requires separate image reconstruction approaches to generate maps of SV/T2* and ADC/morphometry. We hypothesize that the SEM equation can be adapted for fitting the spin density dependence of the MR signal similar to fitting the time or b-value dependences:5,6 Signal=exp[-(nr)β], where 0<β<1, n is an image number and r is the fractional spin-density.7 Such an approach permits consideration of the MR signal intensity variation (Figure1a,b) as reflection of the underlying spin-density variation and hence, reconstruction of the under-sampled k-space using the adapted SEM equation. Lung SV/ADC/morphometry/T2* maps can be generated using reconstructed images and their corresponding weighing. Therefore, in this proof-of-concept evaluation, our objective was to demonstrate the feasibility of our approach in a small group of patients.Methods
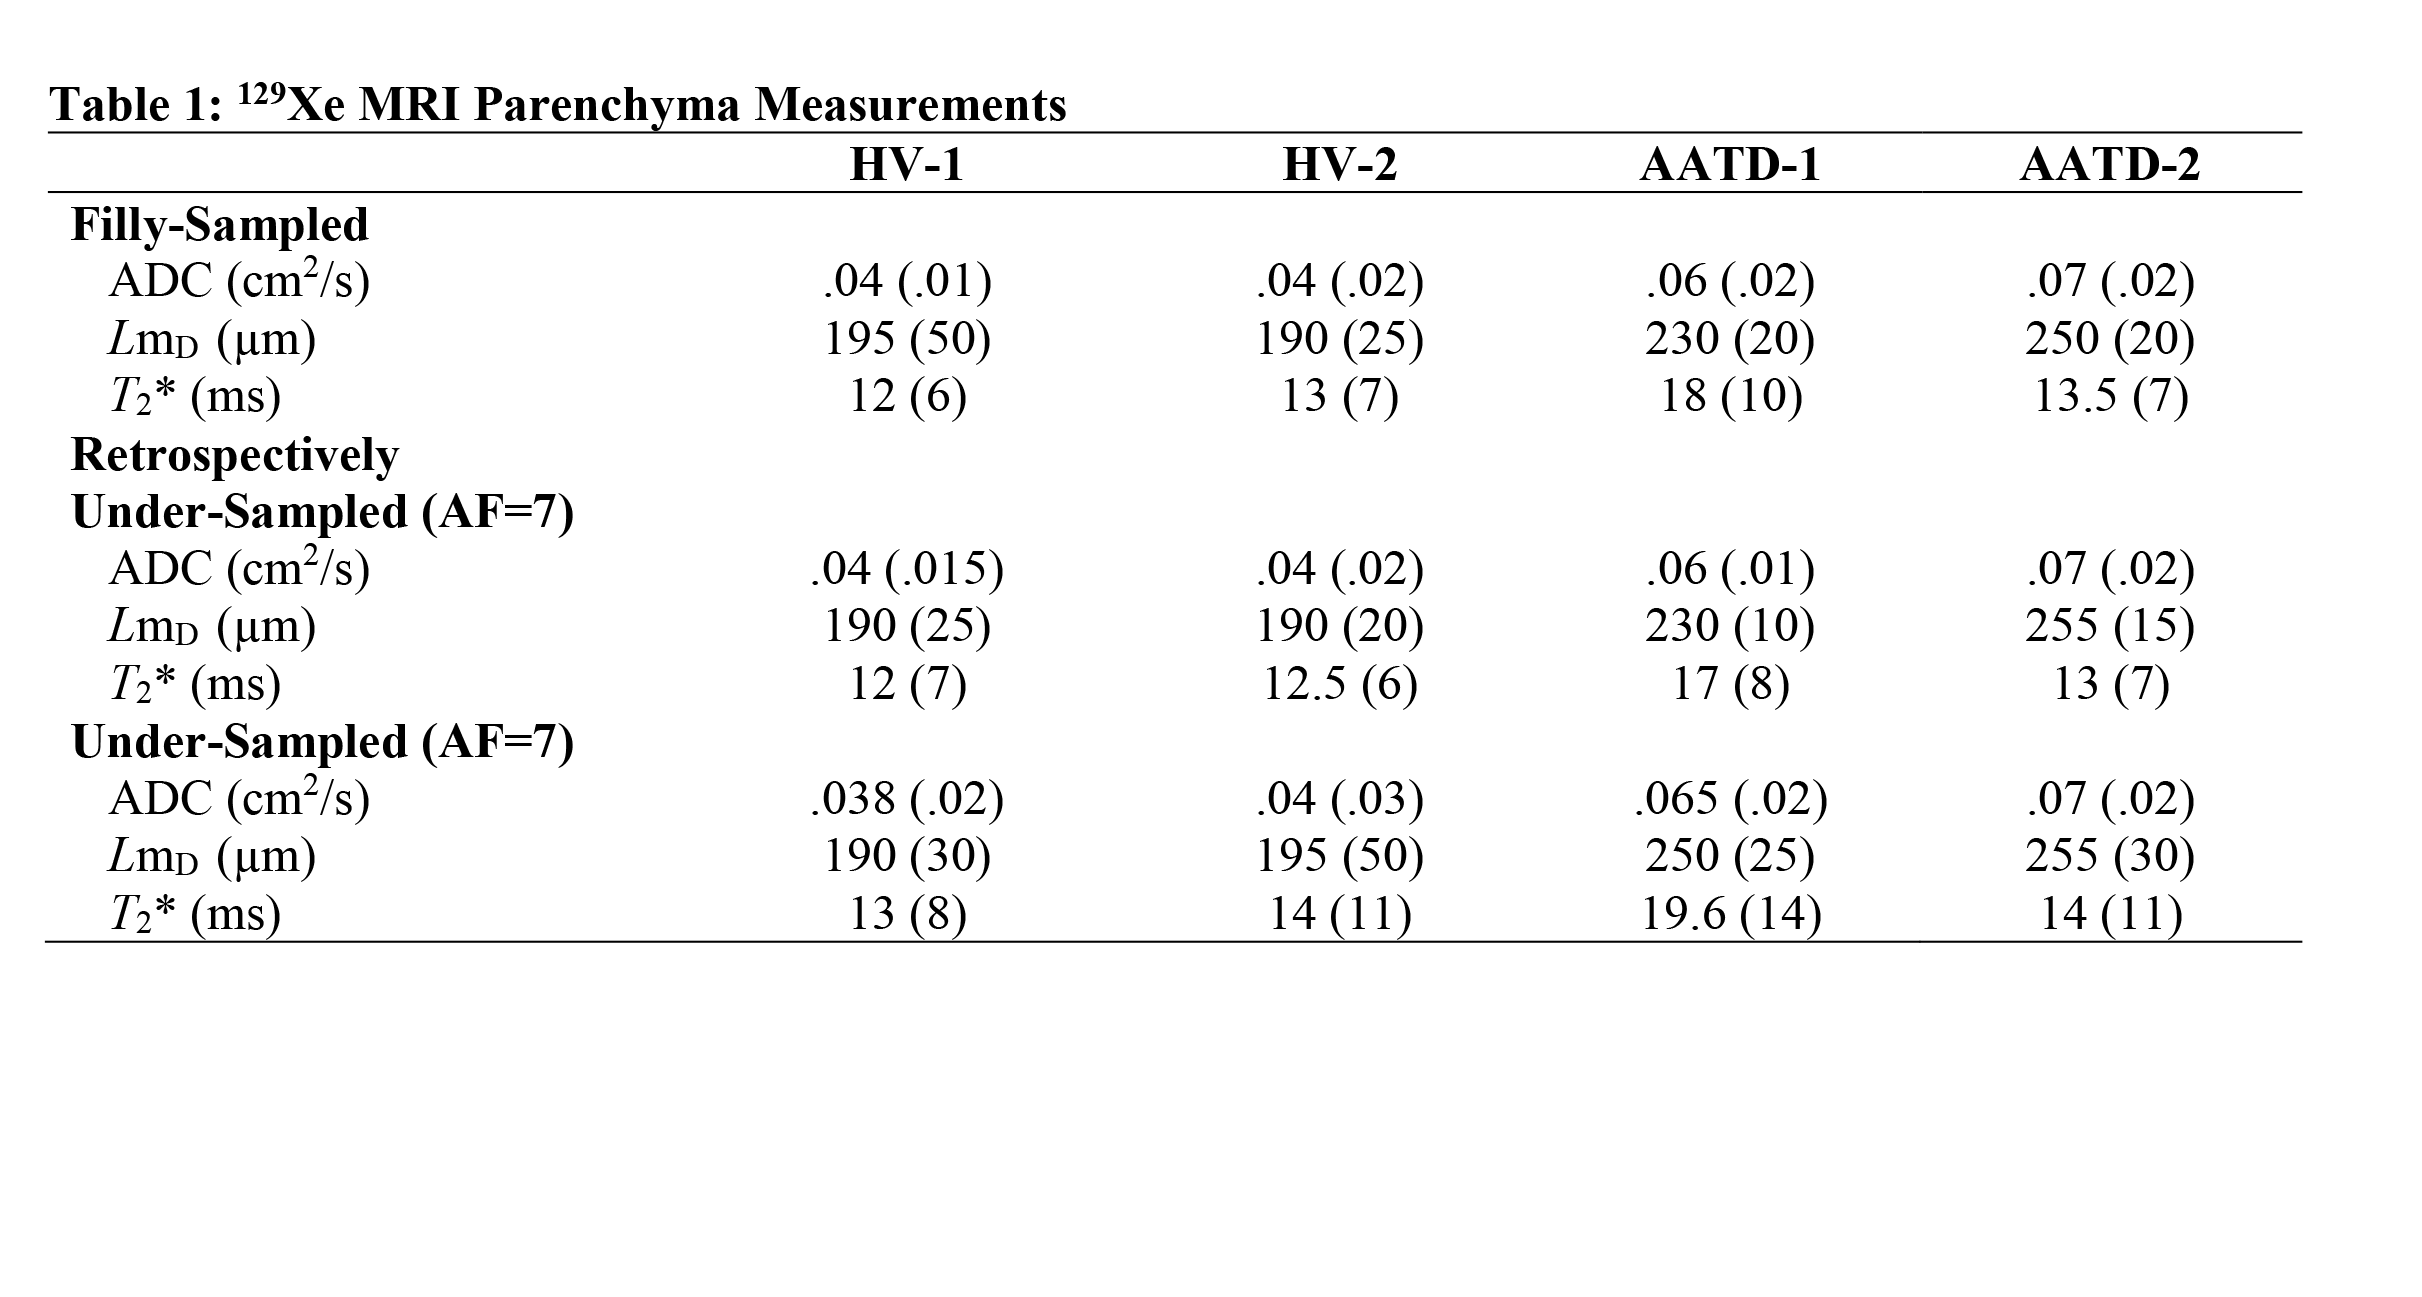
Two healthy-volunteers (HV, 24/26yr) and two Alpha-1 Antitrypsin Deficiency (AATD, 67/66yr) patients provided written informed consent to an ethics-board approved study protocol and underwent spirometry, plethysmography, and 129Xe MRI morphometry with and without acceleration. Imaging was performed at 3.0T (MR750, GEHC, WI) using whole-body clinical gradients (5G/cm maximum) and a commercial, xenon quadrature flex human RF coil8 (MR Solutions, USA). For xenon measurements, the diffusion-sensitization gradient pulse ramp up/down time=500μs, constant time=2ms, ΔXe=5.2ms, providing five b-values 0, 12.0, 20.0, 30.0, and 45.5s/cm2. For fully-sampled acquisitions (single breath-hold), a multi-slice interleaved (six interleaves) centric 2D FGRE diffusion-weighted sequence was acquired for two 30mm coronal slices (TE=10msec, TR=13msec, reconstructed matrix size=128x128, and FOV=40x40cm2, constant-flip-angle=4o, 14sec single breath-hold).4 For accelerated acquisitions (AF=7), a multi-slice interleaved (six interleaves) centric 2D FGRE diffusion-weighted sequence was acquired, for seven 30mm coronal-slices (sequence parameters were similar to fully-sampled).4 An extra interleave with no diffusion-weighting (b=0) and significantly reduced TE (2ms) was utilized to generate a short-TE static-ventilation-image and a T2* map (by using a long-TE (10ms) static-ventilation-image (b=0)) for both accelerated and fully-sampled cases.4 A 7.4o constant-flip-angle (120 [20 per b-value] RF pulses-per-slice) was used for the AF=7 (all participants, 12sec single breath-hold).4 Fully-sampled data were retrospectively under-sampled to mimic AF=7, then the lung function maps were generated for three cases (full-sampling; retrospective under-sampling; and accelerated sampling) in two steps. Firstly, the signal intensity of the under-sampled k-spaces were represented as a functions of the image number (Figure1c) and then fitted following Abascal et al method.2 n=0, 6, 7, 8, 9, 10 and 0, 2, 3, 4, 5 was used to fit HV and AATD under-sampled data respectively (Figure1c). Secondly, the ADC (b=0/b=12s/cm2) and LmD1,9 were generated for all cases as previously described.1,3,10-14.Results
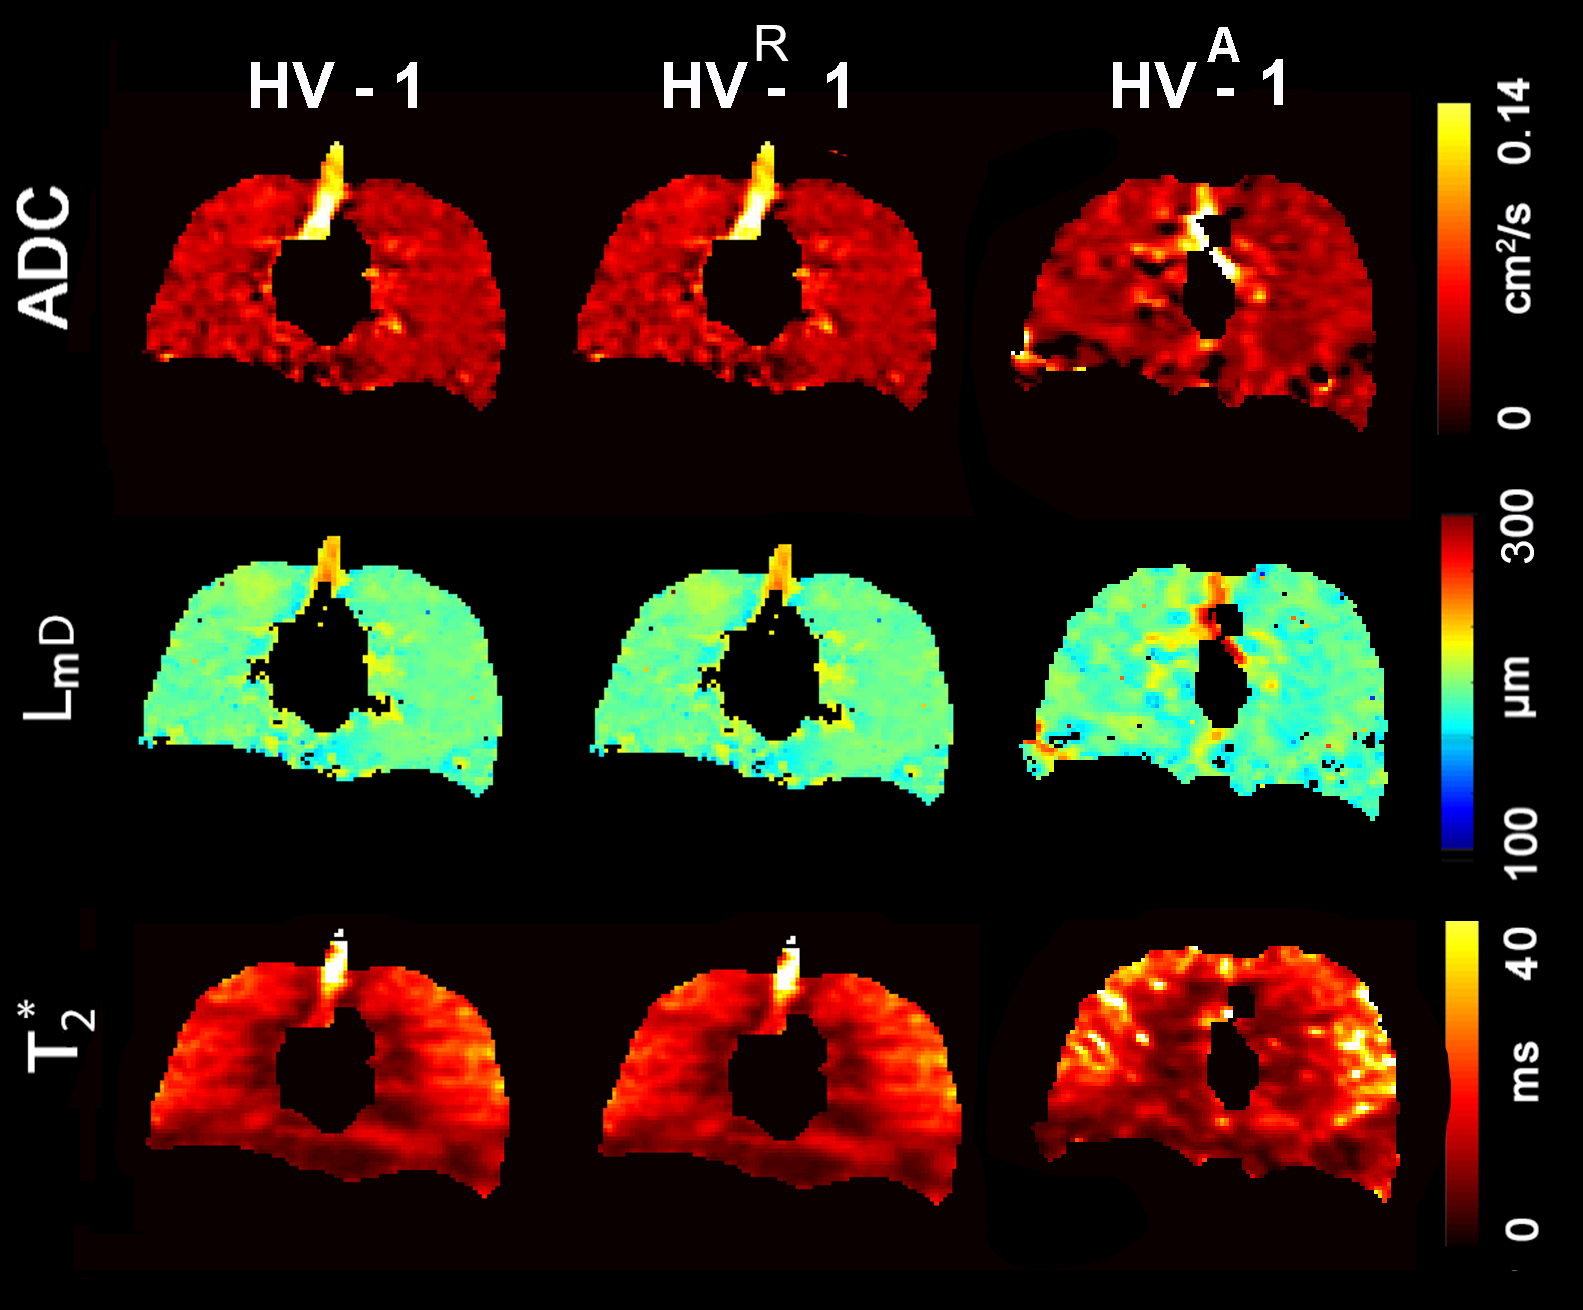
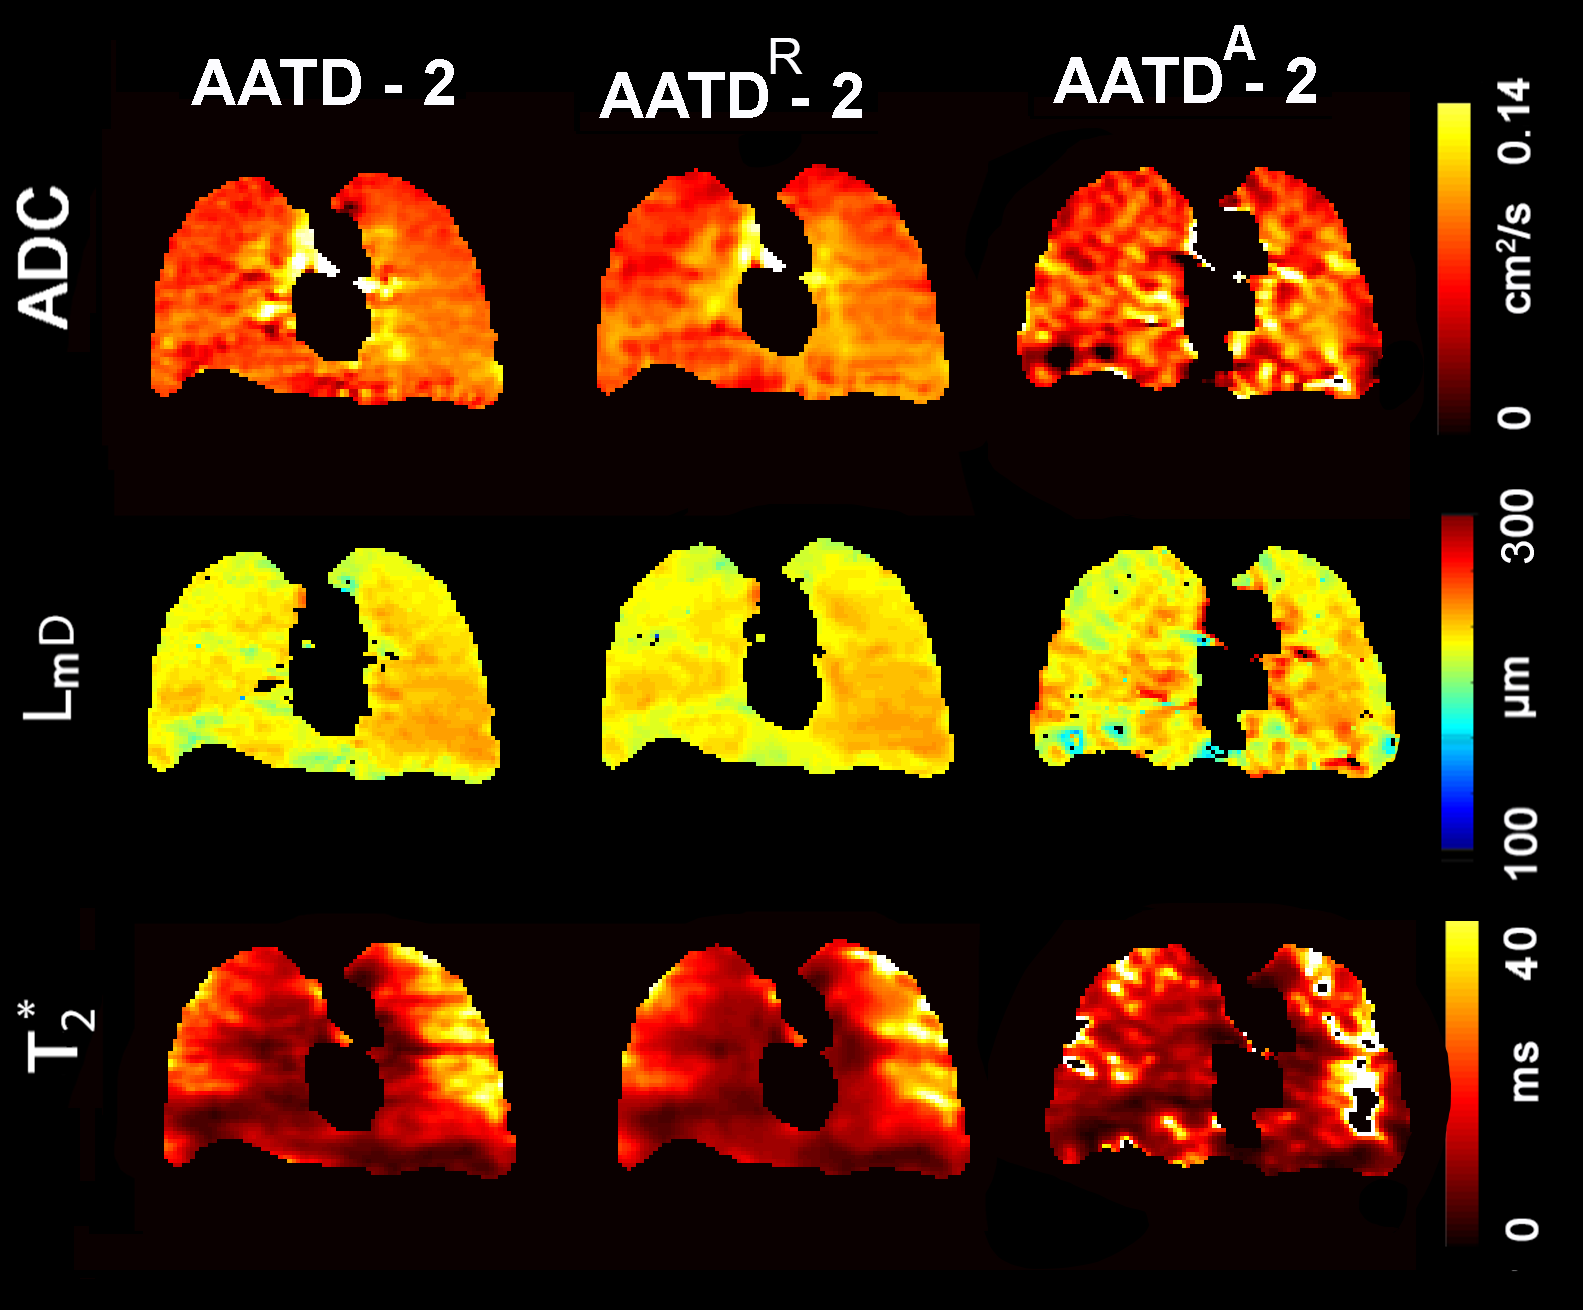
Figures 2 and 3 show representative center-slice ADC/ADCR/ADCA, LmD/RLmD/ALmD, and T2*/RT2*/AT2* (where R indicates retrospectively under-sampled and A indicates under-sampled acquisition) maps for all subjects while Table1 shows mean estimates. The pixel-by-pixel differences between the original fully-sampled short-TE/b=0 and short-TE/b=0 images reconstructed after the retrospective under-sampling was within the interval of 11%-15% for all study subjects. For the HV/AATD subgroups, mean differences less than 10.0% were observed between fully-sampled and under-sampled (both R and A) k-space for the ADC, LmD, and T2* values respectively.Discussion and Conclusion
In this proof-of-concept study, we showed that the SEM equation can be adapted for fitting the “spin density” dependence of the MR signal similar to fitting to the time or b-value dependences. The differences in 129Xe MRI-based ADC/LmD and Lm estimates from fully-sampled and under-sampled (AF=7) k-space were similar to those observed with accelerated 129Xe multi-b diffusion-weighted MRI.9 Thus, the ADC and morphometry estimates obtained using the proposed approach can be considered for translation to use in patients. Furthermore, the total number of sampled k-space lines was 120 (20x6images), so by utilizing AF=10 (13 k-space lines out of 128 per image), one can acquire three more maps (longitudinal-relaxation-time-constant (T1) map,15 partial-oxygen-pressure (PO2) map16 and a RF flip-angle (B1) map17, or thee more short-TE images) and still finish data acquisition in 16sec (13lines x 9images=117). We believe that the adapted SEM equation can be used to reconstruct all nine images which in turn can be utilized to generate SV/ADC/LmD/T2*/T1/B1/PO2 maps.Acknowledgements
A. Ouriadov was funded in part by a fellowship from the Alpha-1 Foundation (USA).References
1 . Chan, H. F., Stewart, N. J., Parra-Robles, J., Collier, G. J. & Wild, J. M. Whole lung morphometry with 3D multiple b-value hyperpolarized gas MRI and compressed sensing. Magn Reson Med 77, 1916-1925, doi:10.1002/mrm.26279 (2017).
2 . Abascal, J. F. P. J., Desco, M. & Parra-Robles, J. Incorporation of prior knowledge of the signal behavior into the reconstruction to accelerate the acquisition of MR diffusion data. ArXiv e-prints 1702 (2017). <http://adsabs.harvard.edu/abs/2017arXiv170202743A>.
3. Westcott, A., Guo, F., Parraga, G. & Ouriadov, A. Rapid single-breath hyperpolarized noble gas MRI-based biomarkers of airspace enlargement. J Magn Reson Imaging 49, 1713-1722, doi:10.1002/jmri.26574 (2019).
4. Ouriadov, A., Guo, F., McCormack, D. G. & Parraga, G. Accelerated 129Xe MRI Morphometry of Terminal Airspace Enlargement: Feasibility in Volunteers and Those with Alpha-1 Antitrypsin Deficiency. Mag Res in Med, doi:10.1002/MRM.28091 (2019).
5. Berberan-Santos, M. N., Bodunov, E. N. & Valeur, B. Mathematical functions for the analysis of luminescence decays with underlying distributions 1. Kohlrausch decay function (stretched exponential). Chemical Physics 315, 171-182, doi:10.1016/j.chemphys.2005.04.006 (2005).
6. Parra-Robles, J., Marshall, H. & Wild, J. M. Characterization of 3He Diffusion in Lungs using a Stretched Exponential Model [abstract]. ISMRM 21st Annual Meeting, 0820 (2013).
7. Fox, M. & Ouriadov, A. in Magnetic Resonance Imaging (ed Associate Prof. Lachezar Manchev) (IntechOpen Limited, 2019).
8. Kaushik, S. S. et al. Single-breath clinical imaging of hyperpolarized (129)Xe in the airspaces, barrier, and red blood cells using an interleaved 3D radial 1-point Dixon acquisition. Magn Reson Med 75, 1434-1443, doi:10.1002/mrm.25675 (2016).
9. Chan, H. F., Stewart, N. J., Norquay, G., Collier, G. J. & Wild, J. M. 3D diffusion-weighted (129) Xe MRI for whole lung morphometry. Magn Reson Med 79, 2986-2995, doi:10.1002/mrm.26960 (2018).
10. Kirby, M. et al. Hyperpolarized 3He and 129Xe MR imaging in healthy volunteers and patients with chronic obstructive pulmonary disease. Radiology 265, 600-610, doi:10.1148/radiol.12120485 (2012).
11. Yablonskiy, D. A. et al. Quantification of lung microstructure with hyperpolarized 3He diffusion MRI. J Appl Physiol (1985) 107, 1258-1265, doi:10.1152/japplphysiol.00386.2009 (2009).
12. Sukstanskii, A. L. & Yablonskiy, D. A. Lung morphometry with hyperpolarized 129Xe: theoretical background. Magn Reson Med 67, 856-866, doi:10.1002/mrm.23056 (2012).
13. Ouriadov, A., Lessard, E., Sheikh, K., Parraga, G. & Canadian Respiratory Research, N. Pulmonary MRI morphometry modeling of airspace enlargement in chronic obstructive pulmonary disease and alpha-1 antitrypsin deficiency. Magn Reson Med 79, 439-448, doi:10.1002/mrm.26642 (2018).
14. Ouriadov, A. et al. Pulmonary hyperpolarized (129) Xe morphometry for mapping xenon gas concentrations and alveolar oxygen partial pressure: Proof-of-concept demonstration in healthy and COPD subjects. Magn Reson Med 74, 1726-1732, doi:10.1002/mrm.25550 (2015).
15. Ouriadov, A. V., Lam, W. W. & Santyr, G. E. Rapid 3-D mapping of hyperpolarized 3He spin-lattice relaxation times using variable flip angle gradient echo imaging with application to alveolar oxygen partial pressure measurement in rat lungs. MAGMA 22, 309-318, doi:10.1007/s10334-009-0181-3 (2009).
16. Miller, G. W. et al. A short-breath-hold technique for lung pO2 mapping with 3He MRI. Magn Reson Med 63, 127-136, doi:10.1002/mrm.22181 (2010).
17. Miller, G., Altes, T., Brookeman, J., De Lange, E. & Mugler Iii, J. Hyperpolarized 3He lung ventilation imaging with B 1-inhomogeneity correction in a single breath-hold scan. Magn Reson Mater Phys Biol Med 16, 218-226 (2004).
Figures