3465
Enhancing GRE magnitude image using rank reduction of structured matrix1Indian Institute of Information Technology and Management-Kerala, Trivandrum, India, 2Sree Chitra Tirunal Institute for Medical Science and Technology, Trivandrum, India
Synopsis
The noise and phase dispersion in the multi-slice multi-echo Gradient Echo (GRE) acquisition causes non-exponential signal decay along the temporal dimension. Due to this, signal dropouts are observed in the air tissue interface. Construction of structured block Hankel matrix and rank minimization with a fidelity for data consistency reduces the signal loss and improves the visibility of venous structures in the GRE magnitude image.
Introduction
High resolution acquisition in MRI causes reduction in signal-to-noise ratio. This effect of noise will be severe in regions with low signal strength. This is especially true in multi-echo GRE acquisition with sufficiently long TE[1]. Due to noise and the effect of field inhomogeneities, the exponential decay of signal along temporal dimension will be distorted. This will causes signal dropouts and errors in the parameters estimated using this magnitude image. So to reduce the effect of phase dispersion and noise, a filtering operation is beneficial prior to estimation of any parameters from the measured signal. The rank minimization is reported to have high capability for removing noisy components from the measured signal or noisy observations [2]. Moreover the rank minimization applied to the background suppressed phase image will preserve only the strong frequency components thereby removes the components due to phase dispersion. The filtering operation through rank minimization by maintaining the fidelity with the acquired data can be easily framed as a minimization problem. Additionally, magnitude image is enhanced by make use of the information available with the neighboring slices. For this a structured block Hankel matrix is constructed from the multi-echo multi-slice signal at each location .Theory
The filtering operation can be described as a rank minimization problem that extracts the processed data from the observed data by solving the following minimization problem $$min\frac{1}{2}\parallel{X-Y}\parallel_2^2+\mid{Z}\mid\star\ subject to Z=Y,$$ where X is the block Hankel matrix constructed from the measured signal. $$$Y$$$ and $$$Z$$$ are the primal variable for solving the minimization problem using ADMM. For constructing the matrix $$$X$$$ at position $$$r$$$ in the slice $$$p$$$, neighboring slices $$$(p-j)$$$ and $$$(p+j)$$$ are also chosen. For each location of a slice, Hankel matrix is constructed using the multi-echo sample points. The individual Hankel matrix is arranged in block Hankel form to construct a matrix of size $$$[N*w×N*w]$$$. Here $$$N$$$ is the number of slices used and $$$w$$$ is the window length used to construct the Hankel matrix. On solving the above minimization using ADMM formulation [3], the solutions Y and Z can be obtained as $$Y^{q+1}=Y^{q}+\delta[(X-Y^{q})+(Z-Y^{q}+\frac{Q}{\delta})],$$ and Z is updated by singular value thresholding of $$$Y^{q+1}-\frac{Q}{\delta}$$$ with a threshold $$$λ/δ where $$$λ is the regularization parameter, δ is the penalty parameter and Q is the Lagrange multiplier.Methods
We have implemented the optimization algorithm using ADMM to obtain the low rank signal from the measured signal. After rank minimization, the additional redundancy due to block Hnakel matrix structure is removed together with the noise, which is mostly represented by smaller singular values in the rank minimization problems. Another advantage of using this block Hankel matrix in the rank minimization is that the correlated information in the neighboring slices can be enhanced. After rank minimization the final processed image at $$$p$$$-th slice is obtained by choosing the respective elements from Y .In each iteration the threshold $$$λ/δ$$$ for rank minimization is updated by incrementing the value of $$$δ$$$ using a constant step size.Resuts
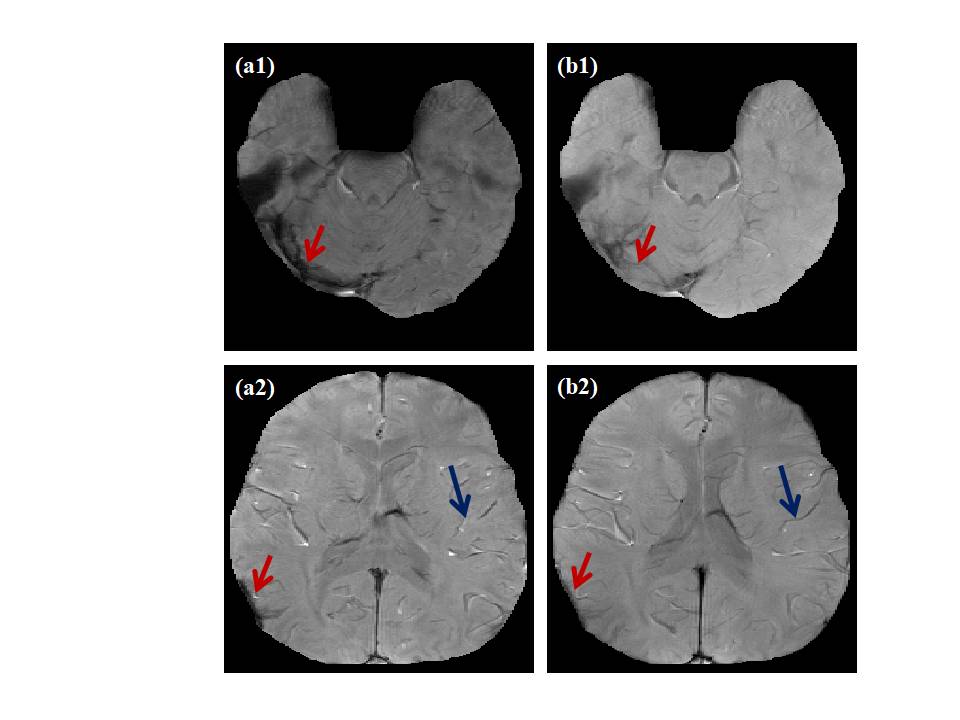
Fig. 1 show slices (row wise panel) of multi-echo 3D GRE acquisition on GE 3T scanner with acquisition parameters TE/TR of 20/35 ms. The data set used was a three echo data acquired at an initial TE of 20 ms and echo spacing of 4.9 ms. Column wise panel shows the magnitude image without and with processing. Red arrows are used to indicate the reduction in signal loss observed after processing. Blue arrows are used to indicate the continuity of venous structures observed in the processed magnitude images.Discussion
The magnitude image obtained after rank minimization shows reduced signal loss. This is due to reduction in noise and field inhomogeneities in the processed image. Continuity of the venous structure is achieved by enhancing the correlated information in the block Hankel matrix constructed from neighboring pixels of adjacent slices.Conclusion
In this work we have implemented the rank minimization based filtering for enhancing the GRE images using ADMM formulation. The application of structured block Hankel matrix for rank minimization exhibit the advantage of recovering the noise corrected images that also show reduction in signal loss in the regions near air tissue interface. We have demonstrated that the visibilities of venous structures are also increased in the magnitude image after processing.Acknowledgements
The authors are thankful to Council of Scientific and Industrial Research-Senior Research Fellowship (File No: 09/1208(0001)/2018.EMR-I) and planning board of Govt. of Kerala (GO(Rt)No.101/2017/ITD.GOK(02/05/2017)), for financial assistance.References
[1]Liu, Saifeng, et al. "Susceptibility‐weighted imaging: current status and future directions." NMR in Biomedicine 30.4 (2017): e3552.
[2]Xu L, Wang C, Chen W, Liu X. Denoising multi-channel images in parallel MRI by low rank matrix decomposition. IEEE transactions on applied superconductivity. 2014 Jun 25;24(5):1-5.
[3] Boyd S, Parikh N, Chu E, Peleato B, Eckstein J. Distributed optimization and statistical learning via the alternating direction method of multipliers. Foundations and Trends® in Machine learning. 2011;3(1):1-122.
Figures