3459
Data-Driven Model Consistency Condition Reconstruction Performance for Radial Acquisition in Breast DCE-MRI
Ping N Wang1, Julia V Velikina1, Leah C Henze Bancroft2, Alexey A Samsonov2, and James H Holmes2
1Department of Medical Physics, University of Wisconsin Madison, Madison, WI, United States, 2Department of Radiology, University of Wisconsin Madison, Madison, WI, United States
1Department of Medical Physics, University of Wisconsin Madison, Madison, WI, United States, 2Department of Radiology, University of Wisconsin Madison, Madison, WI, United States
Synopsis
MOCCO reconstruction enables high spatial and temporal resolution DCE imaging for breast, which was proposed to be less sensitive to modeling error. However, the impact of noise level and lesion size on reconstruction performance is remained unknown. In this work we use a digital reference object phantom with the ability to adjust both spatial and temporal features for breast pharmacokinetic simulation. Further, we perform G-factor analysis of SNR performance, sharpness assessment, nRMSE and PK analysis for evaluating the temporal fidelity.
Introduction
Dynamic contrast-enhanced (DCE) MRI provides the greatest sensitivity of any modality for the detection of breast cancer establishing it as the gold standard for breast cancer detection1, but its comparatively lower specificity can result in indeterminate findings requiring biopsy and/or imaging follow-up2. Quantitative pharmacokinetic (PK) modeling of DCE-MRI has shown promise to provide additional non-invasive evidence for differentiating benign and malignant lesions3. The challenge of DCE-MRI is the need for high spatial and temporal resolution and SNR to resolve small lesions and accurately fit PK models. Studies have shown the potential of high spatial-temporal resolution breast imaging by using stack-of-stars radial acquisition with compressed sensing (CS) reconstruction4. More recently, a data-driven low-rank-based method (MOCCO) exploiting spatial-temporal correlations was utilized to enable very high temporal resolution breast DCE-MRI images (10 seconds/frame)5. However, the previous study focused on the optimization of MOCCO parameters for temporal fidelity in a very high SNR setting. The remaining question is the performance of the approach under a broader range of imaging conditions (noise level, lesion size, spatial resolution) to predict the limits of its practical performance. Numerical simulations provide a critical testing bed for direct comparison of imaging methods while controlling for patient dependent factors including variable contrast kinetics, motion, and other physiologic characteristics. In this study, we apply a numerical simulation to evaluate both spatial/temporal quality of the MOCCO reconstruction under different breast imaging settings.Methods
Simulations: A breast digital reference object (DRO)6 was used to simulate time-resolved radial data acquired with a 16-channel coil (Fig. 1). Lesion size and SNR were independently modified from the original DRO to evaluate the performance of the MOCCO reconstruction. For the lesion size simulation, additional radial data were generated by varying the lesion size (10 - 7mm). For the SNR simulation, Gaussian noise was added (0, 10, and 30% of the mean k-space value) to the k-space data.Reconstruction: The underlying temporal model for MOCCO6,7 was obtained from the low frequency region of the fully-sampled central k-space data using progressive learning with cubic spline approximation7,8 followed by complex independent component analysis9. The undersampled data were reconstructed at 10s temporal resolution, corresponding to 16 projections/frame (undersampling factor R=44) using MOCCO and SENSE. For comparison, the fully sampled SENSE images with 10s temporal resolution were reconstructed.
Analysis: One hundred realizations of i.i.d. Gaussian noise were added to k‐space data and each dataset was reconstructed with MOCCO and SENSE. Additionally, the same number of reconstructions from fully sampled data with the same noise level was performed. The reconstruction bias was assessed by taking a pixelwise mean across all reconstructed Monte‐Carlo samples and calculating normalized image difference with the fully sampled images. The propagation of noise was estimated by calculating a noise amplification factor (g‐factor),
$$\frac{\sigma_{R}}{\sigma_{F}\sqrt{R}}$$
where σ2R and σ2F are noise variances for reduced (by a factor of R) and full data reconstructions calculated across Monte‐Carlo samples. Temporal curves from regions-of-interest (ROIs) placed in each lesion were measured for both SNR and lesion size simulations. PK modeling was performed by fitting the curves to the extended Tofts model10 using an in-house implementation of the Levenberg-Marquaradt algorithm to assess the ability to fit and recover specific kinetic parameters from the temporal curves.
Results
The MOCCO reconstruction showed consistent image quality across all lesion sizes (Fig. 2). Line profiles from MOCCO and the reference image showed good agreement across all 3 lesion sizes, an example from lesion 6 is shown in Fig. 2. No significant differences were observed in the g-factor maps (Fig. 3) at 10% and 30% noise levels, showing that MOCCO has the ability to recover spatial resolution from low SNR acquired datasets. Figure 4 demonstrates that the MOCCO could accurately recover temporal curves under varying noise levels. MOCCO was found to display slightly lower nRMSE with larger lesions (Fig. 4). Similar results were shown in PK analysis in Figure 5, where no significant difference was found between different noise levels. However, Ktrans and Ve were underestimated as the lesion size decreased which was consistent with overall underestimation of the time curves.Discussion and conclusions
In this study, we evaluated the performance of MOCCO for spatial recovery and robustness to noise in the data. The simulated results indicated that MOCCO has the ability to recover small lesions without loss of spatial resolution that should be well suited to the spatial resolution demands of breast DCE-MRI. The MOCCO reconstruction showed no significant image quality degradation with the presence of noise combined with high undersampling factors. MOCCO was found to provide robust high spatial and temporal quality across the broad range of parameters evaluated.Acknowledgements
The authors wish to acknowledge support from NIH-R21EB018483, NIH-R01EB027087, GE Healthcare, the RSNA Research and Education Foundation, and a Research and Development Grant from the Departments of Radiology and Medical Physics, University of Wisconsin.References
- Kuhl, C. K. et al. Mammography, Breast Ultrasound, and Magnetic Resonance Imaging for Surveillance of Women at High Familial Risk for Breast Cancer. J. Clin. Oncol. 23, 8469–8476 (2005).
- Li, J., Dershaw, D. D., Lee, C. H., Kaplan, J. & Morris, E. A. MRI Follow-Up After Concordant, Histologically Benign Diagnosis of Breast Lesions Sampled by MRI-Guided Biopsy. Am. J. Roentgenol. 193, 850–855 (2009).
- Furman-Haran, E., Schechtman, E., Kelcz, F., Kirshenbaum, K. & Degani, H. Magnetic resonance imaging reveals functional diversity of the vasculature in benign and malignant breast lesions. Cancer 104, 708–718 (2005).
- Kim, S. G. et al. Influence of temporal regularization and radial undersampling factor on compressed sensing reconstruction in dynamic contrast enhanced MRI of the breast: Temporal Regularization and Radial Undersampling Effects on DCE-MRI. J. Magn. Reson. Imaging 43, 261–269 (2016).
- Wang, P. et al. Breast DCE-MRI using Radial Acquisition with Data-Driven Model Consistency Condition Reconstruction. Proceedings of the 27th ISMRM Scientific Meeting 2019. Montreal Canada, 2019.
- Henze, L. Digital Breast Phantom for Evaluating Dynamic Accelerated Imaging Methods. in Proceedings of the 18th ISMRM Scientific Meeting 2010 (2010)
- Velikina, J. V. & Samsonov, A. A. Reconstruction of Dynamic Image Series from Undersampled MRI Data Using Data Driven Model Consistency Condition (MOCCO). 12.
- Velikina, J. et al. Ultrafast Speech Imaging at High Spatial Resolution using Model-Consistency Condition Reconstruction with Progressive Temporal Basis Learning. Proc. 26th ISMRM Sci. Meet. 2018 (2018).
- Boor, C. de. A Practical Guide to Splines. in Applied Mathematical Sciences (1978). doi:10.1007/978-1-4612-6333-3.
- Novey, M. & Adali, T. On Extending the Complex FastICA Algorithm to Noncircular Sources. IEEE Trans. Signal Process. 56, 2148–2154 (2008).
- Tofts, P. S. et al. Estimating kinetic parameters from dynamic
contrast-enhanced t1-weighted MRI of a diffusable tracer: Standardized
quantities and symbols. 10.
Figures
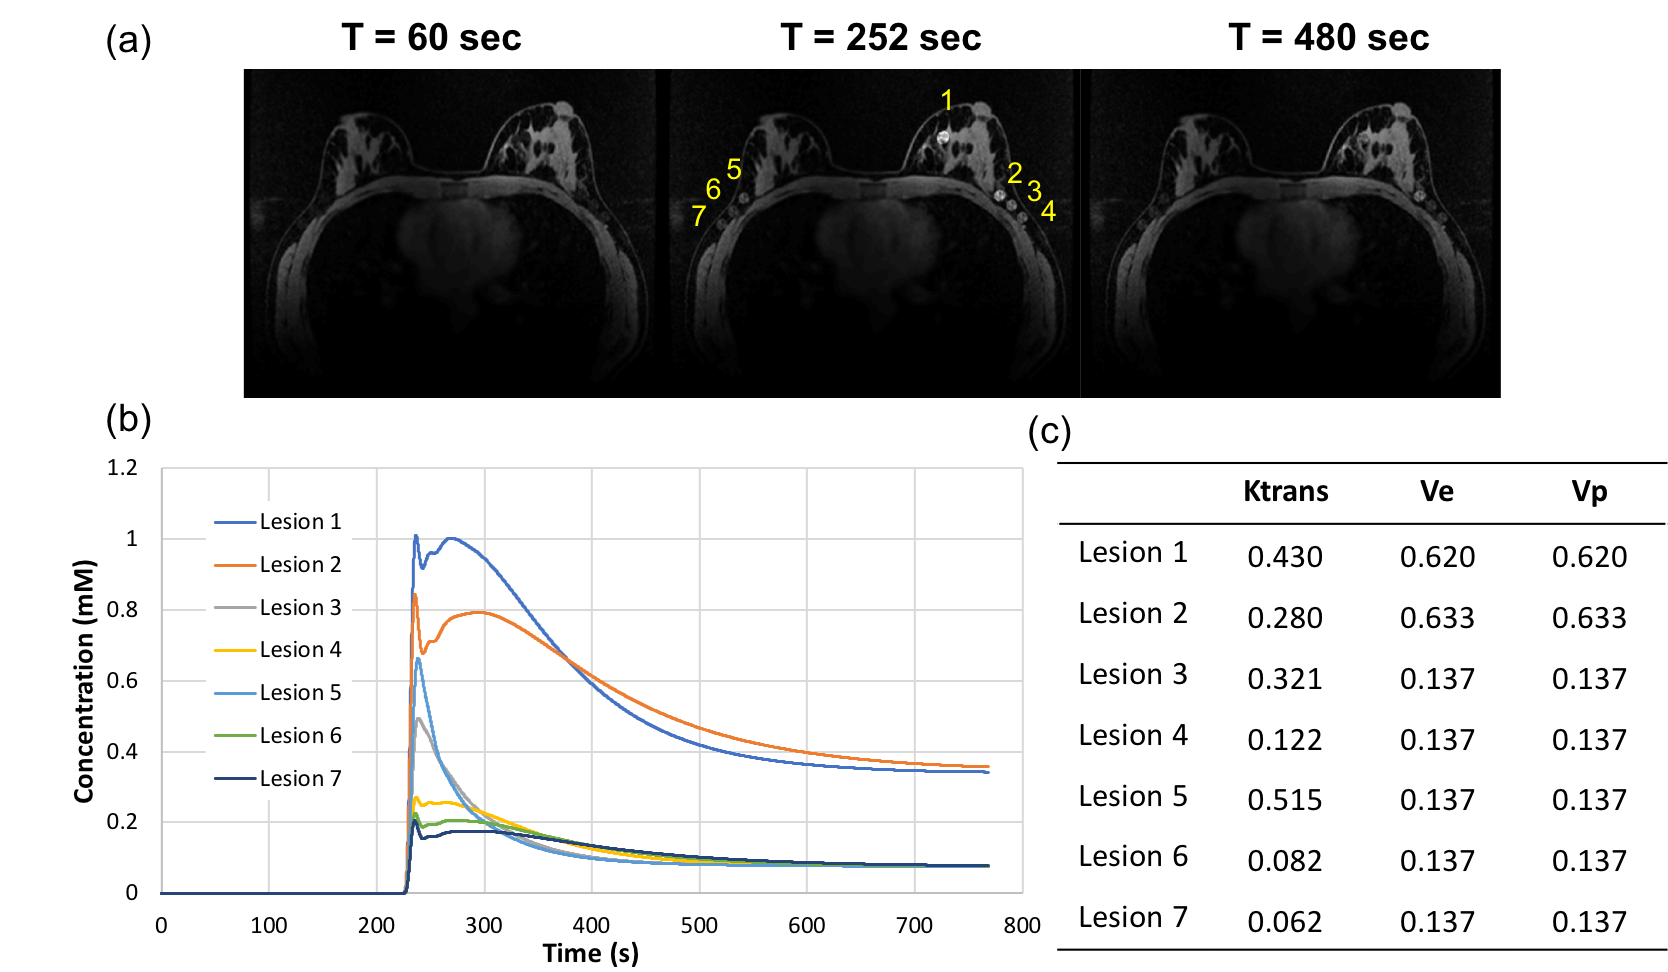
Figure1: A breast digital reference object (DRO) (matrix
size 448x448x142) phantom is shown with with
seven
lesions
located in the fibroglandular tissue and axilla region (a). Lesions of matched diameters were added with contrast kinetics generated by assigning the Ktrans, Ve,
and Vp from the extended Tofts model (b, c).
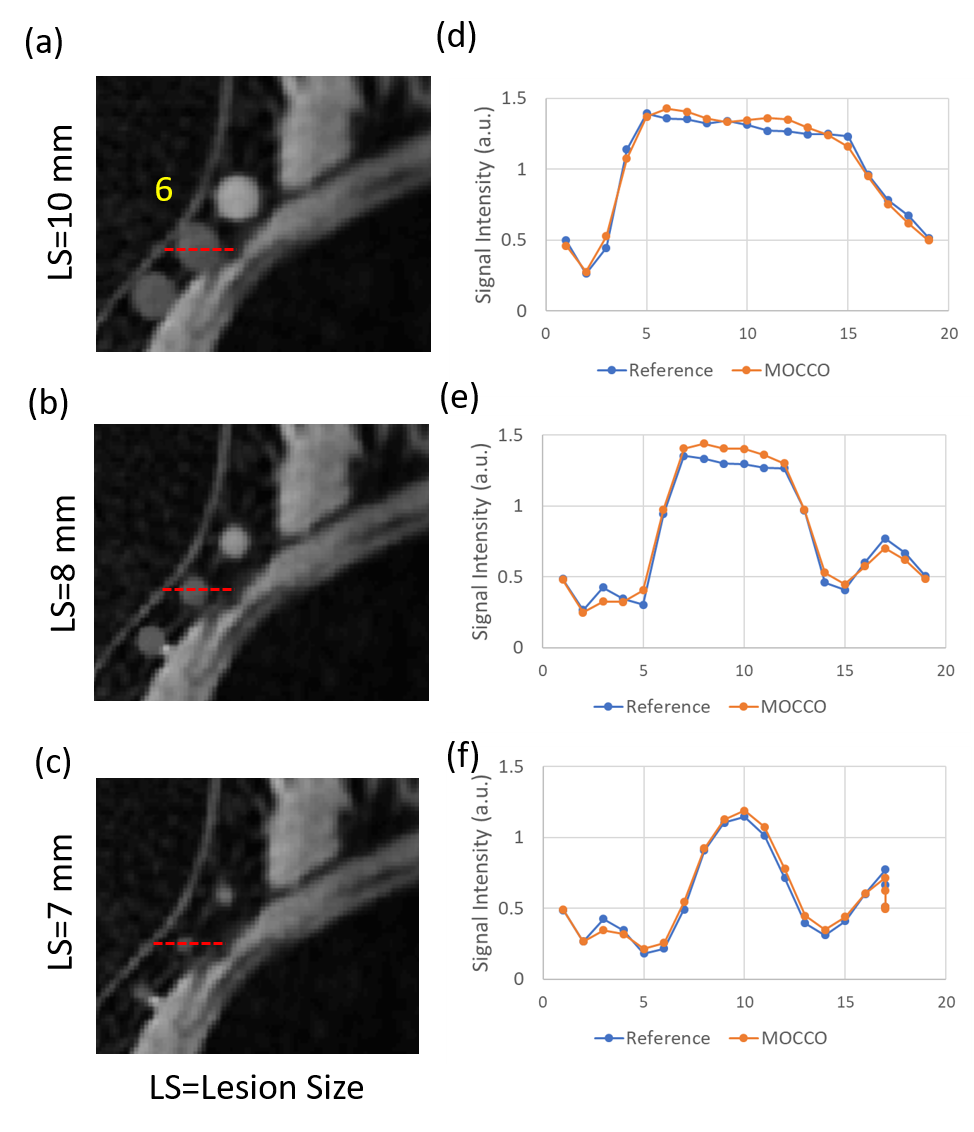
Figure2: Representative time frames with maximum time intensity were shown here with lesion size
of (a) 10, (b) 8, and (c) 7mm. The line ROIs were placed at lesion 6 and the
corresponding line profiles (d-f) were plotted for MOCCO and reference images.
MOCCO showed consistent results with less variation across the three lesion
sizes.
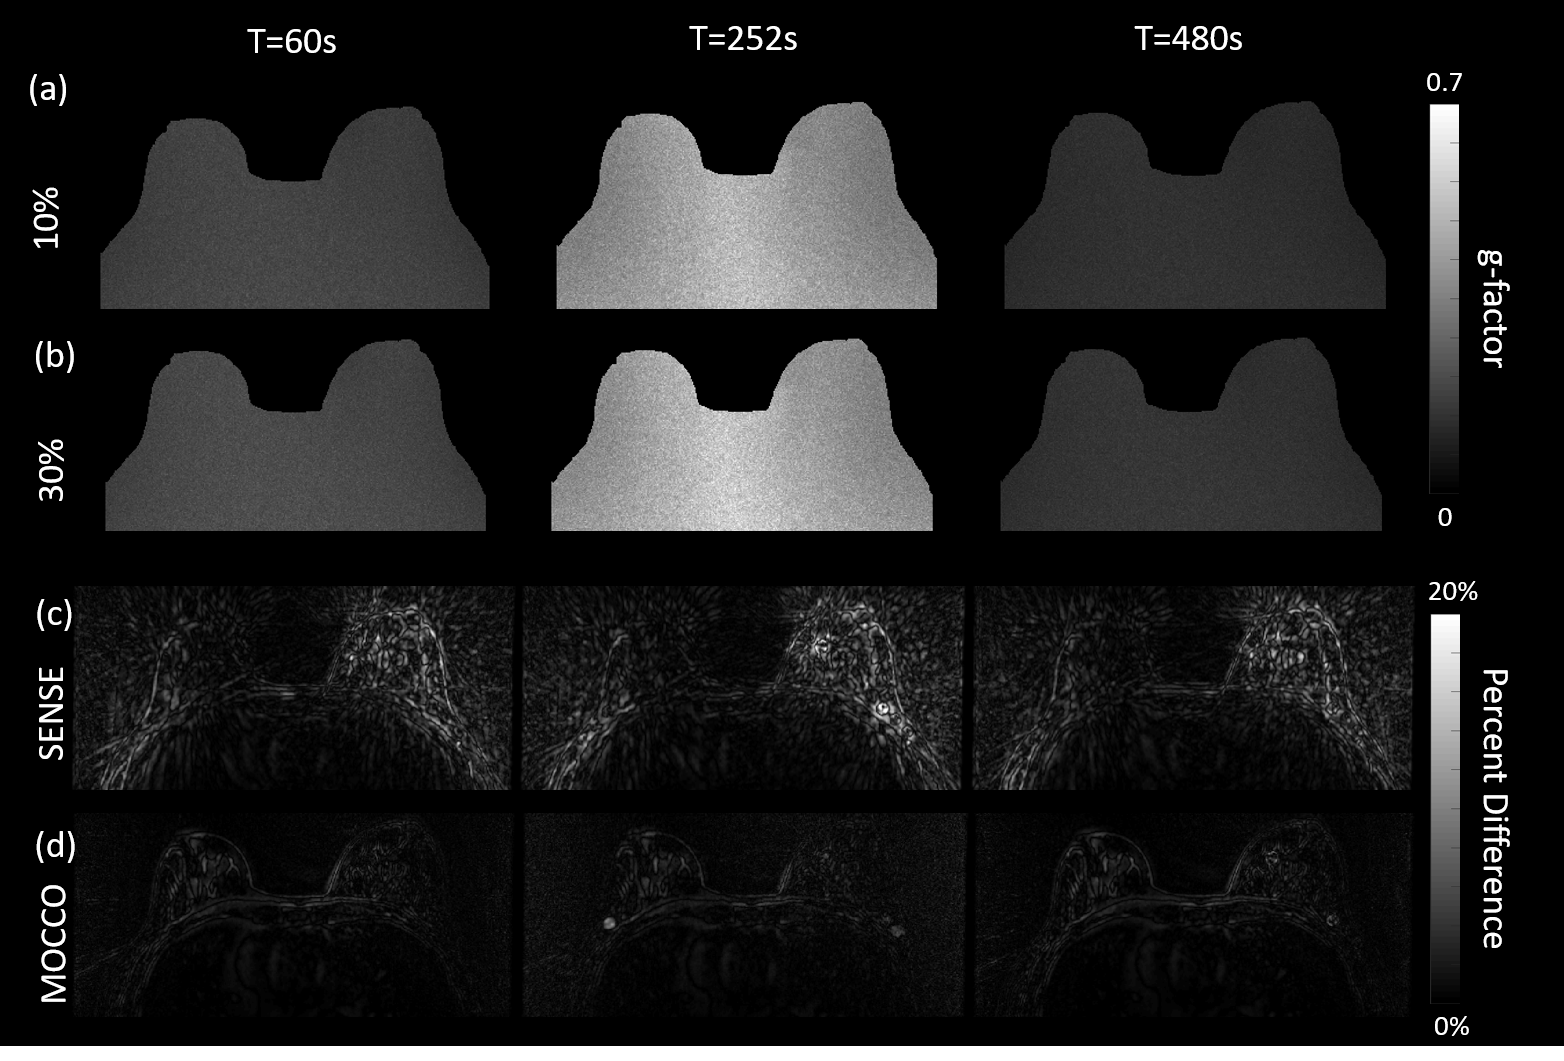
Figure3: G-factor maps generated from
Monte Carlo simulations with Gaussian noise levels of (a) 10%, and (b) 30% of
the mean k-space value. Figure (c) and (d) show the spatial difference between
MOCCO/SNESE to reference images, respectively. MOCCO reconstruction showed
robustness of different noise level and nice recovery of spatial resolution
with percent difference less than 10% compared with highly streaky SENSE
images.
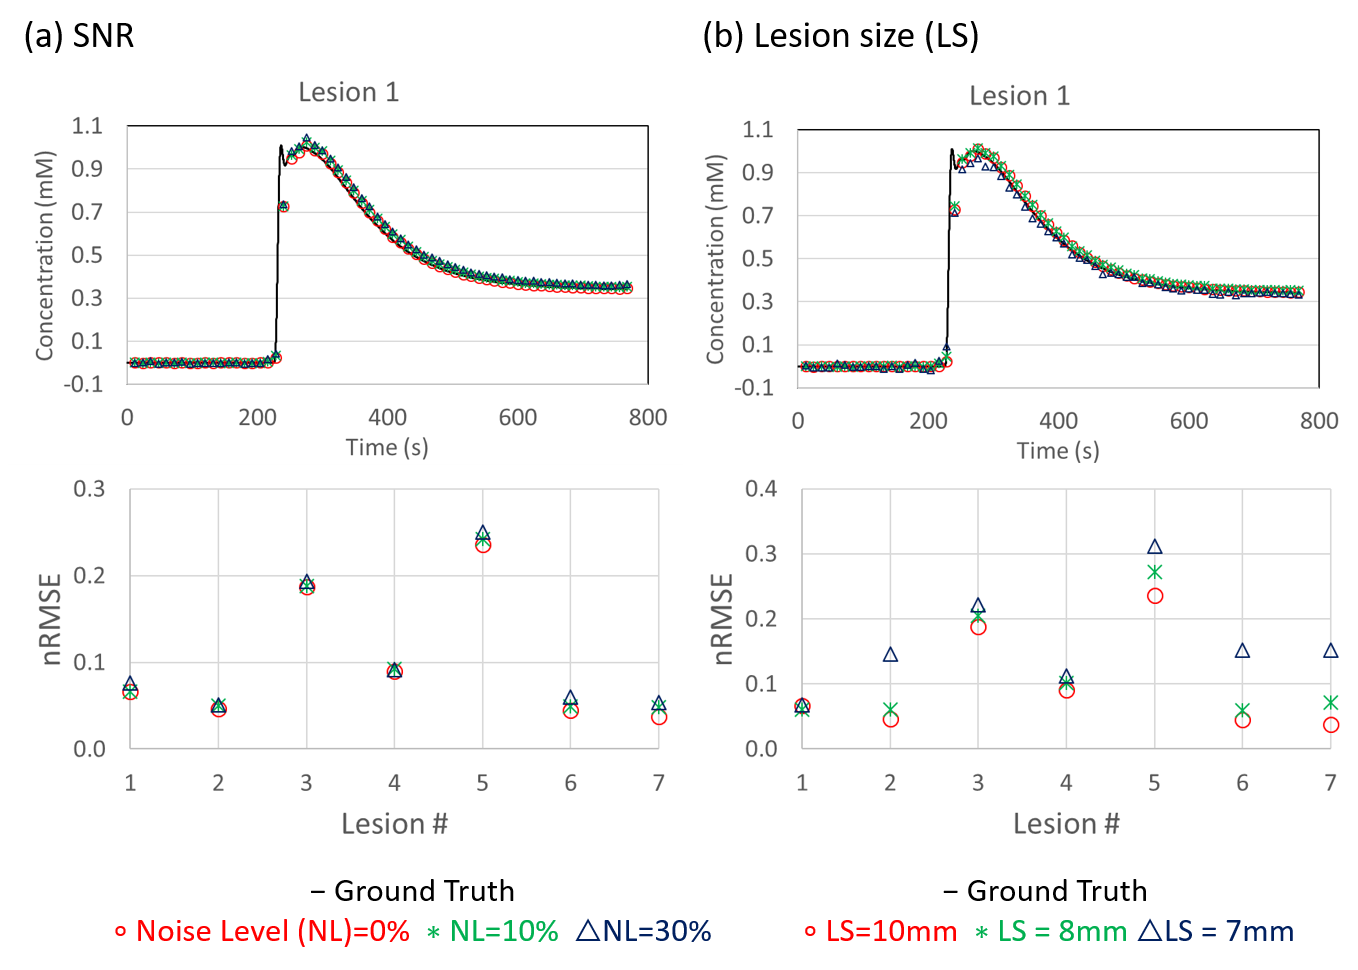
Figure4: Representative tissue concentration time curves
from lesion 1 with different noise level (a) and lesion size (b). Curves from
MOCCO show high accuracy compared with the ground truth curve for all three
noise levels, resulting in low nRMSE. Mild differences were observed in the nRMSE
between different noise levels and lesions. In particular, curves from smaller
lesions showed underestimation of the curve peak, corresponding to higher
nRMSE.
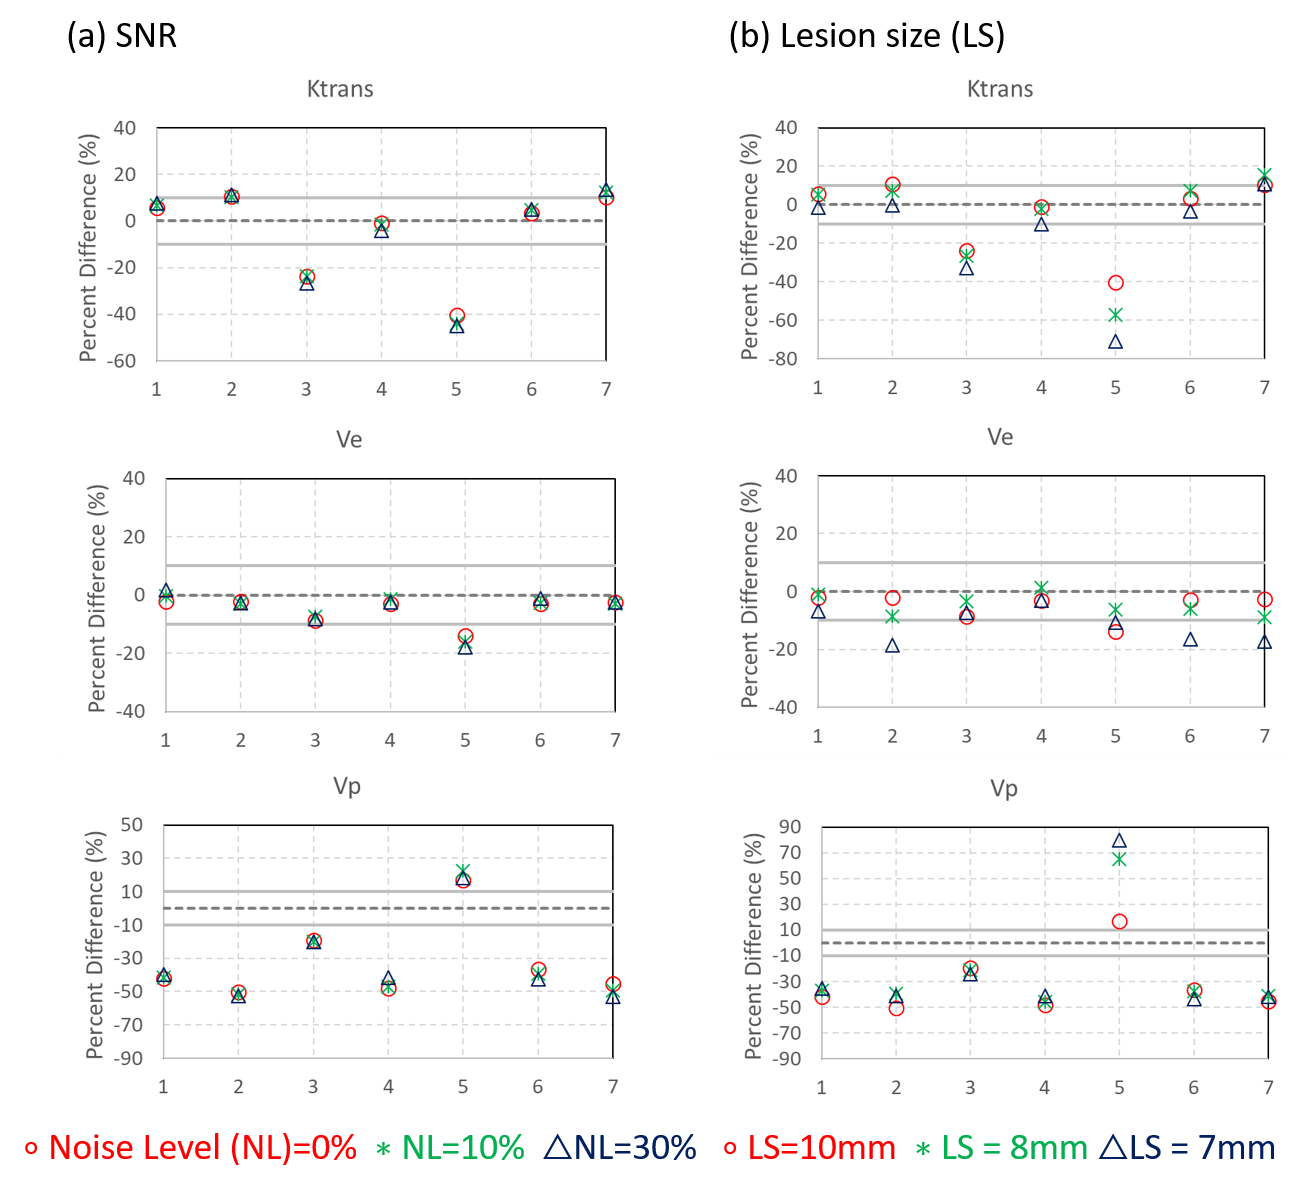
Figure5: PK parameters fit from the temporal curves
generated from SNR and lesion size simulations. The 10% error bound is plotted
as a gray line for all three parameters. SNR simulations showed consistent
results across all three PK parameters. Lesion 3 and 5 showed underestimation of
Krans due to challenges in recovering the wash-in slope. The error was also
found to increase with decreasing lesion size. Larger overall errors were found
for Vp in both simulations.