3457
Comparison of fixed vs. low rank reconstruction methods for acceleration of quantitative T2 mapping1Department of Biomedical Engineering, Tel Aviv University, Tel Aviv, Israel, 2Department of Computer Science and Applied Mathematics, Weizmann Institute of Science, Rehovot, Israel, 3Departments of Medical Physics and Radiology, Memorial Sloan Kettering Cancer Center, New York, NY, United States, 4Center for Advanced Imaging Innovation and Research (CAI2R), New-York University Langone Medical Center, New York, New York, NY, United States, 5Sagol School of Neuroscience, Tel-Aviv University, Tel Aviv, Israel
Synopsis
Quantification of T2 values is valuable for a wide range of research and clinical applications. Multi-echo spin echo protocols allow mapping T2 values, yet, at the cost of strong contamination from stimulated echoes. The echo-modulation-curve algorithm can efficiently overcome these limitations to produce accurate T2 values. Still, integration into clinical routine requires further acceleration in scan time. In this work we present a fixed-rank and sparse algorithm (SPARK) for accelerating the acquisition of T2 values, and compare it against standard L+S and GRAPPA. SPARK was found to improve robustness to reconstruction parameters, and achieve superior accuracy at high acceleration factors.
Introduction
Quantification of T2 values is valuable for a wide range of research and clinical applications1–3. The use of single spin-echo protocol is impractical due to its extensive scan time. Multi-echo spin echo (MESE) protocols offer significantly shorter scan-times and lower diffusion effects, yet, at the cost of strong contamination from stimulated and indirect echoes4–6. The echo-modulation-curve (EMC) algorithm can efficiently overcome these limitations to produce accurate T2 values, which are most importantly reproducible across scanners and scan settings6. Further acceleration of quantitative mapping can be achieved by undersampling the spatial or temporal domains. Low-rank plus Sparse (L+S) signal-decomposition was recently introduced as a powerful tool for reconstructing undersampled perfusion and cardiac MRI data, enhancing standard compressed sensing7. It was shown that enforcing fixed rank along with sparsity constraints may outperform standard L+S8. In previous work we introduced SPARK, a new fixed rank and sparsity constrained reconstruction algorithm. Both L+S and SPARK require the selection of optimization parameters such as sparsity and low rank regularizers, and a set of undersampling masks. In addition, SPARK requires the determination of a fixed rank value r which is to be enforced during the reconstruction. This is in contrary to L+S reconstruction, that leads to a solution of undetermined low rank which is affected by the regularization parameter λL. The selection of such parameters is crucial for a successful reconstruction, while using nonoptimal parameters can yield unpredictable results. Many heuristics exist for overcoming this task, yet they are usually time consuming and optimized with respect to a limited reference data9. In this work we compare the T2 mapping performance using SPARK, L+S and GRAPPA10 and show SPARK’s superior robustness to the selection of different parameter sets.Methods
MRI scans: Brain and calf images were acquired using a standard MESE sequence with fully sampled cartesian k-space. Imaging was done using a 16-channel receiver coil (brain) and a flexible 4-channel receiver coil and 4 additional coils embedded in the scanner bed (calf). Scan parameters for both datasets were: Nechoes=30; TE/TR=10/3000 ms; in-plane resolution=1.1x1.1x3 mm (brain), and 1.3x1.3x3 mm (calf).Postprocessing: Images were reconstructed from retrospectively under sampled k-spaces using our proposed method, L+S and standard GRAPPA. SPARK reconstruction was performed by solving the following optimization problem: $$[L,S]=argmin_{L \in C, S} \frac{1}{2}\left \| d-E\left ( L+S \right ) \right \|_{2}^{2}+\lambda_S\left \|S \right \|_{1}$$ where E is the acquisition operator, d is the under-sampled k-t data and C is the set of matrices of fixed rank r. The Identity transform was used to enforce sparsity in the image domain of S. The fixed rank value was estimated based on the singular values of the EMC signal model4 prior to reconstruction. Variable density schemes U were used following the compressed sensing framework7,11. Following the iterative reconstruction, T2 maps were generated on a pixel-by-pixel basis using the EMC algorithm4.
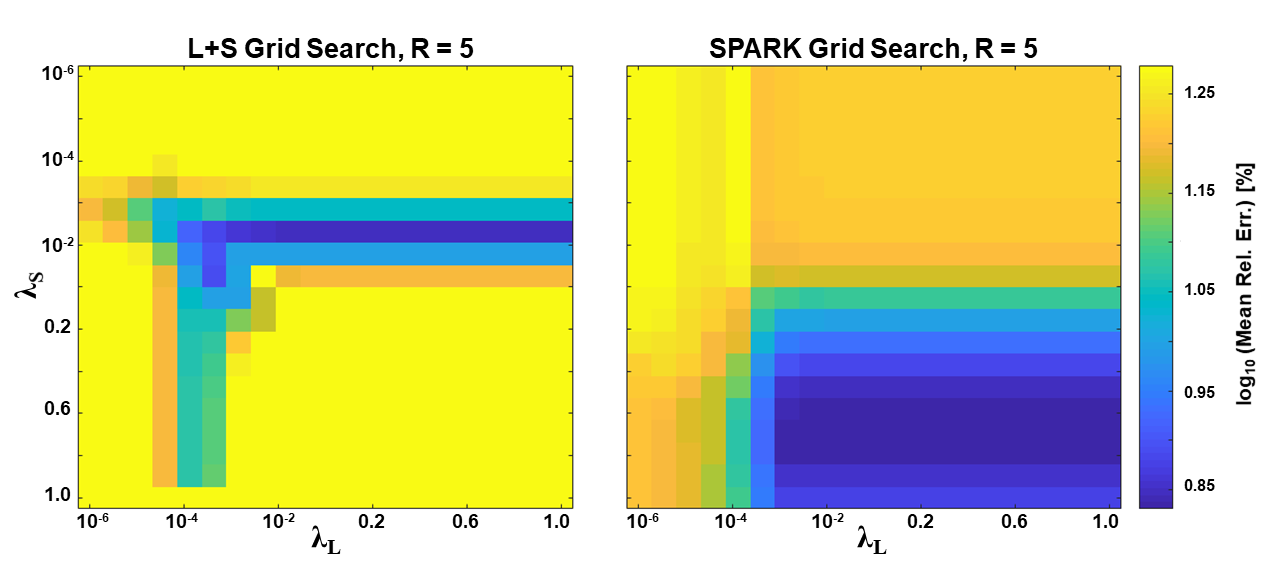
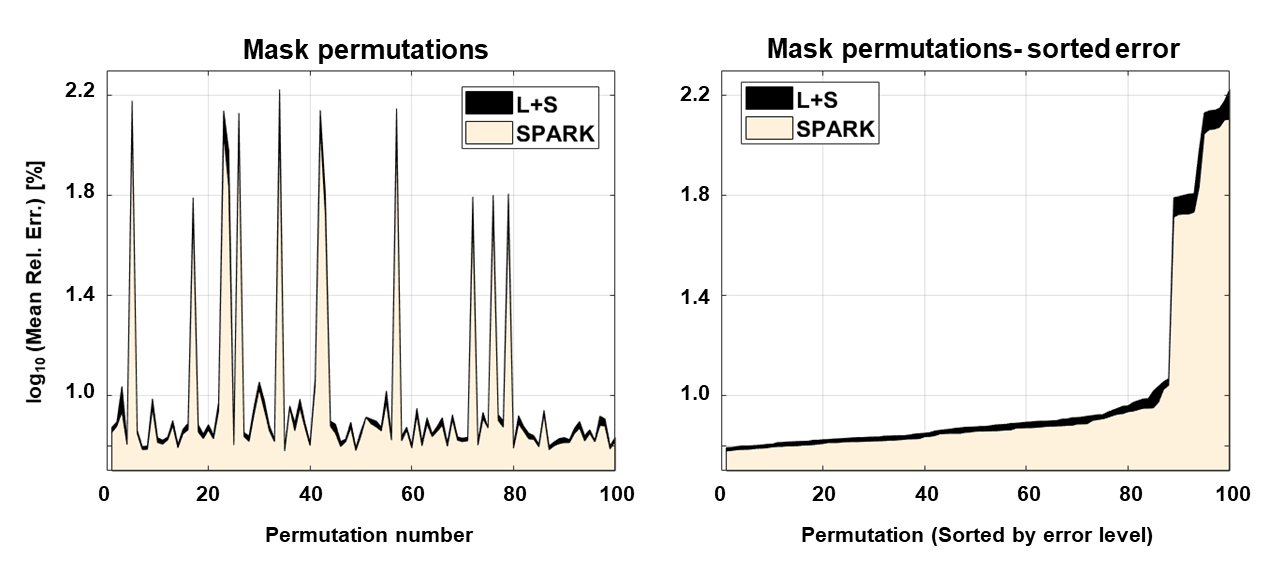
Analysis: Mean ± standard deviation of T2 values were calculated for each anatomy, and relative errors were calculated vs. fully sampled data. Sensitivity to regularization parameters was evaluated performing a grid search on a range of 20x20 (λL, λS) values. Sensitivity to undersampling k-t pattern was evaluated testing 100 random permutations of each undersampling scheme. Finally, performance of SPARK for all possible values of r was evaluated against L+S reconstruction. The results were sorted in increasing order for ease of visualization and interpretability.
Results
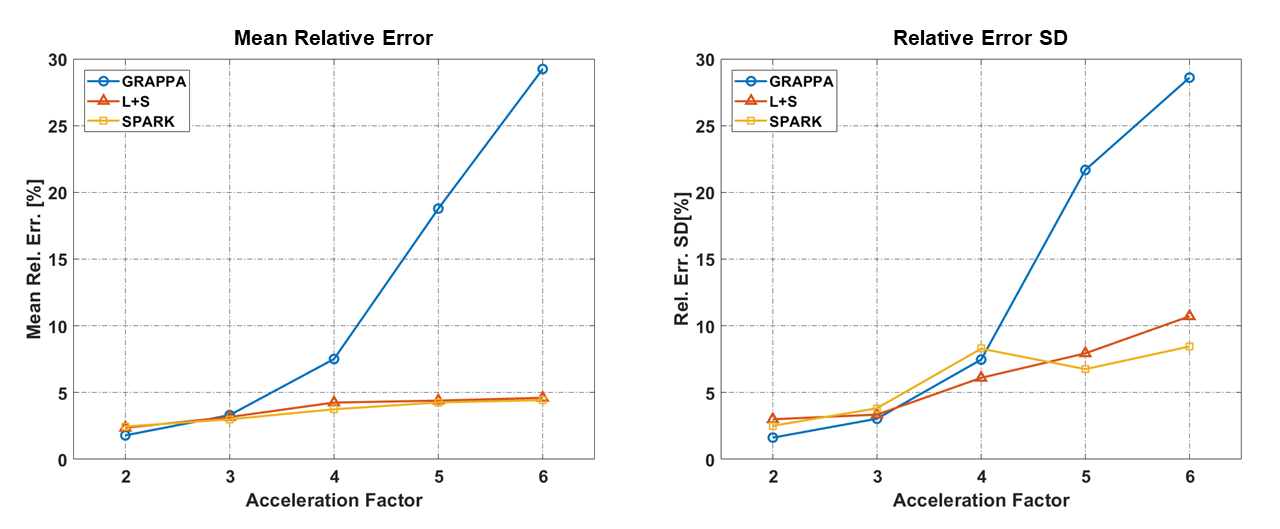
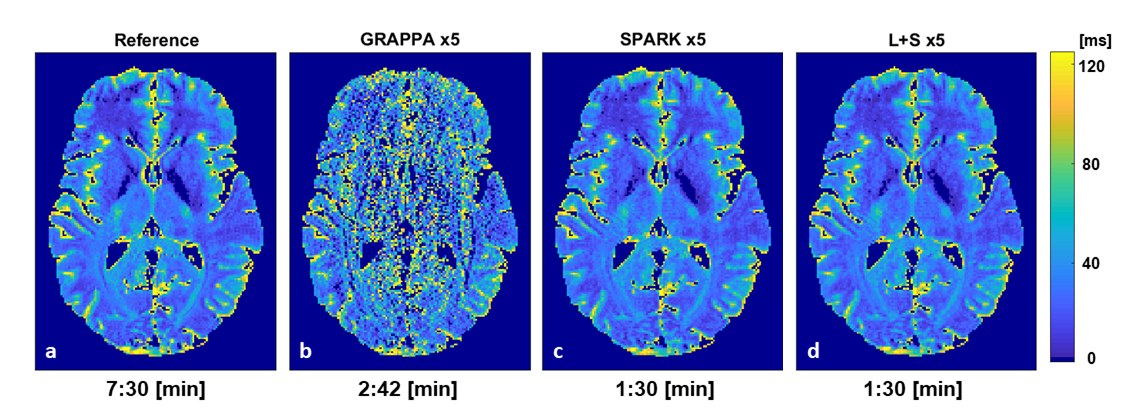
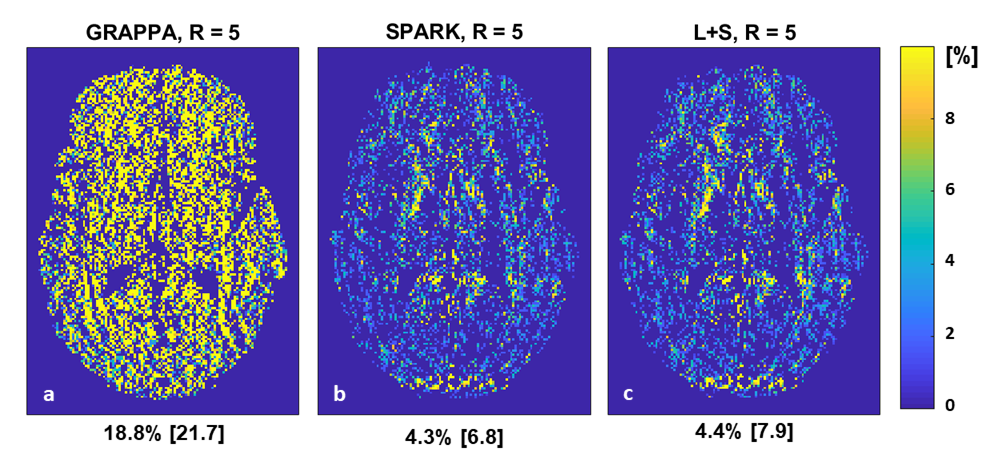
The fixed rank for SPARK was set to r = 7 based on SVD analysis of EMC signal simulation. While SPARK and L+S significantly outperform GRAPPA at high acceleration rates, SPARK shows comparable performance vs. L+S in terms of mapping error (Fig 1). In addition, T2 and error maps achieved by L+S and SPARK are visually and qualitative similar (Fig 2-3). With respect to (λL, λS) choice, SPARK exhibited relatively low error, and wider range of possible (λL, λS) pairs (Fig 4). We see that different permutations of the undersampling scheme may have large effect on the output T2 values. SPARK usually shows lower errors than L+S, particularly at nonoptimal permutations (Fig 5). We found that always exists some r outperforming L+S.Discussion
Our results demonstrate that the combination of EMC and SPARK achieves high accuracy and precision in T2 quantification for acceleration factors x2-x6. Although the acquisition of fully sampled k-t data with clinical resolution would take 7.5 minutes, accelerating its acquisition at factor x5 would take 2.7 minutes with GRAPPA, and only 1.5 minutes using SPARK or L+S. Moreover, the SPARK is in good agreement with reference fully sampled maps, provided that the following parameters are correctly tuned: λS for sparsity, λL for singular value thresholding and r for rank truncation. Although SPARK only slightly outperforms L+S given an optimal set of reconstruction parameters, our results demonstrate the superior robustness of SPARK to suboptimal parameter selection compared to standard L+S. The fixed rank reconstruction using a priori rank input from the EMC model achieves better performance across a wider range of parameters, making this approach promising and convenient for acceleration of T2 mapping from highly undersampled MESE data.Acknowledgements
ISF 2009/17
References
1. Eitel, I. & Friedrich, M. G. T2-weighted cardiovascular magnetic resonance in acute cardiac disease. J. Cardiovasc. Magn. Reson. 2011;13: 13.
2. Lund, H. et al. Cognitive deficits in multiple sclerosis: correlations with T2 changes in normal appearing brain tissue. Acta Neurol. Scand. 2012; 125: 338–344.
3. Siemonsen, S. et al. Quantitative T2 Values Predict Time From Symptom Onset in Acute Stroke Patients. Stroke 2009; 40: 1612–1616.
4. Noam, B.-E., K., S. D. & Tobias, B. K. Rapid and accurate T2 mapping from multi–spin‐echo data using Bloch-simulation-based reconstruction. Magn. Reson. Med. 73: 809–817
5. Ben-Eliezer, N., Sodickson, D. K., Shepherd, T., Wiggins, G. C. & Block, K. T. Accelerated and motion-robust in vivo T 2 mapping from radially undersampled data using bloch-simulation-based iterative reconstruction. Magn. Reson. Med. 2016;75: 1346–1354.
6. Shepherd, T. M. et al. New rapid, accurate T2 quantification detects pathology in normal-appearing brain regions of relapsing-remitting MS patients. NeuroImage Clin. 2017; 14: 363–370.
7. Otazo, R., Candès, E. & Sodickson, D. K. Low-rank plus sparse matrix decomposition for accelerated dynamic {MRI} with separation of background and dynamic components. Magn. Reson. Med. 2014; 73: 1125–1136.
8. Lior, W., L., M. K., C., E. Y. & Mark, C. PEAR: PEriodic And fixed Rank separation for fast fMRI. Med. Phys. 44: 6166–6182
9. Knoll, F., Clason, C., Diwoky, C. & Stollberger, R. Adapted random sampling patterns for accelerated MRI. Magn. Reson. Mater. Physics, Biol. Med. 2011; 24: 43–50.
10. Griswold, M. A. et al. Generalized autocalibrating partially parallel acquisitions (GRAPPA). Magn. Reson. Med. 2002; doi:10.1002/mrm.10171
11. Lustig, M., Donoho, D. & Pauly, J. M. Sparse MRI: The application of compressed sensing for rapid MR imaging. Magn. Reson. Med. 2007; 58: 1182–1195.
Figures