3434
Accelerating silent MRI using a gradient axis at 20 kHz and generalized conjugate gradient SENSE reconstruction1Radiology, University Medical Center Utrecht, Utrecht, Netherlands, 2Spinoza Centre for Neuroimaging Amsterdam, Amsterdam, Netherlands
Synopsis
A silent gradient axis driven at 20 kHz can be used to decrease acoustic noise and increase patient comfort in MR-exams. However, the speed of this silent acquisition is determined by the amount of data needed for artifact free reconstructions. In this work, we present a framework for increasing the time efficiency while maintaining image quality of silent imaging with a silent gradient axis. We show that, by using a generalized conjugate gradient SENSE reconstruction, a 2-3-fold decrease in scan time is feasible both on a phantom and in-vivo.
Introduction
Acoustic noise during an MR-exam can lead to substantial discomfort in subjects and pose a potential health risk due the high sound pressure levels reached (>100dB) during gradient intensive sequences. Previously, we presented a method for imaging with a silent gradient axis driven at 20 kHz, which featured no peripheral nerve stimulation and was inaudible to the human hearing.1 A segmented readout scheme was used to fill k-space in a number of readout lanes. However, as a gridding based reconstruction was performed, extra readout lanes were needed to limit aliasing artefacts by oversampling where two readout lanes meet. In this work, we present an alternate sampling scheme and reconstruction framework to be much more time efficient by undersampling the data and using a generalized conjugate gradient (CG) SENSE algorithm for reconstruction.Methods
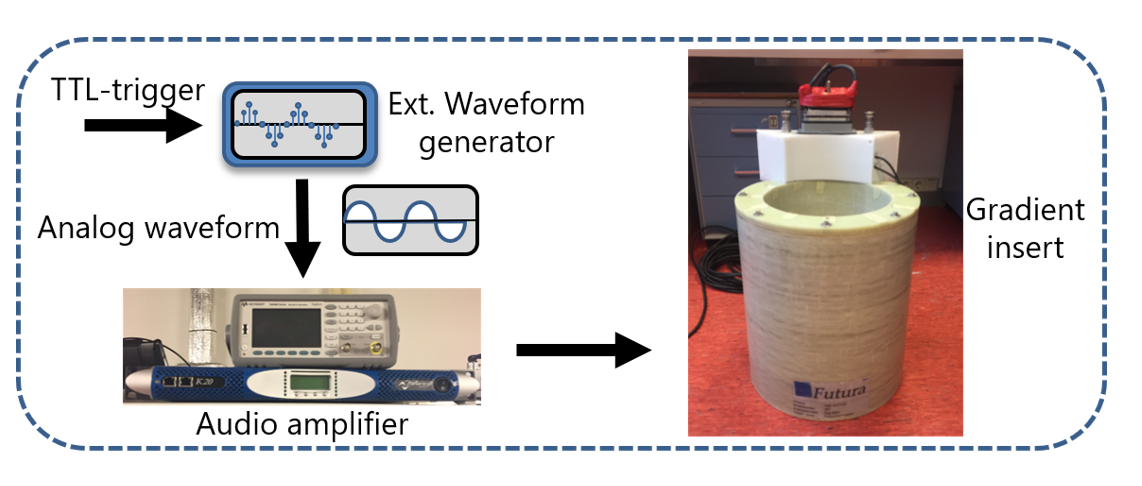
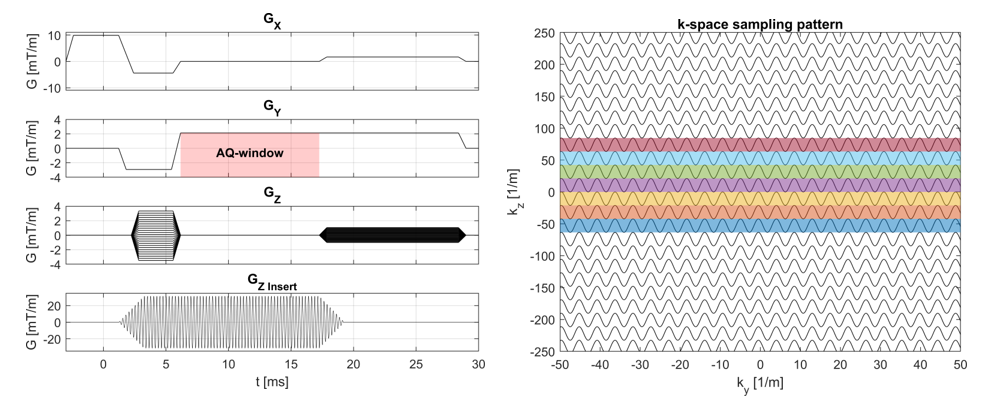
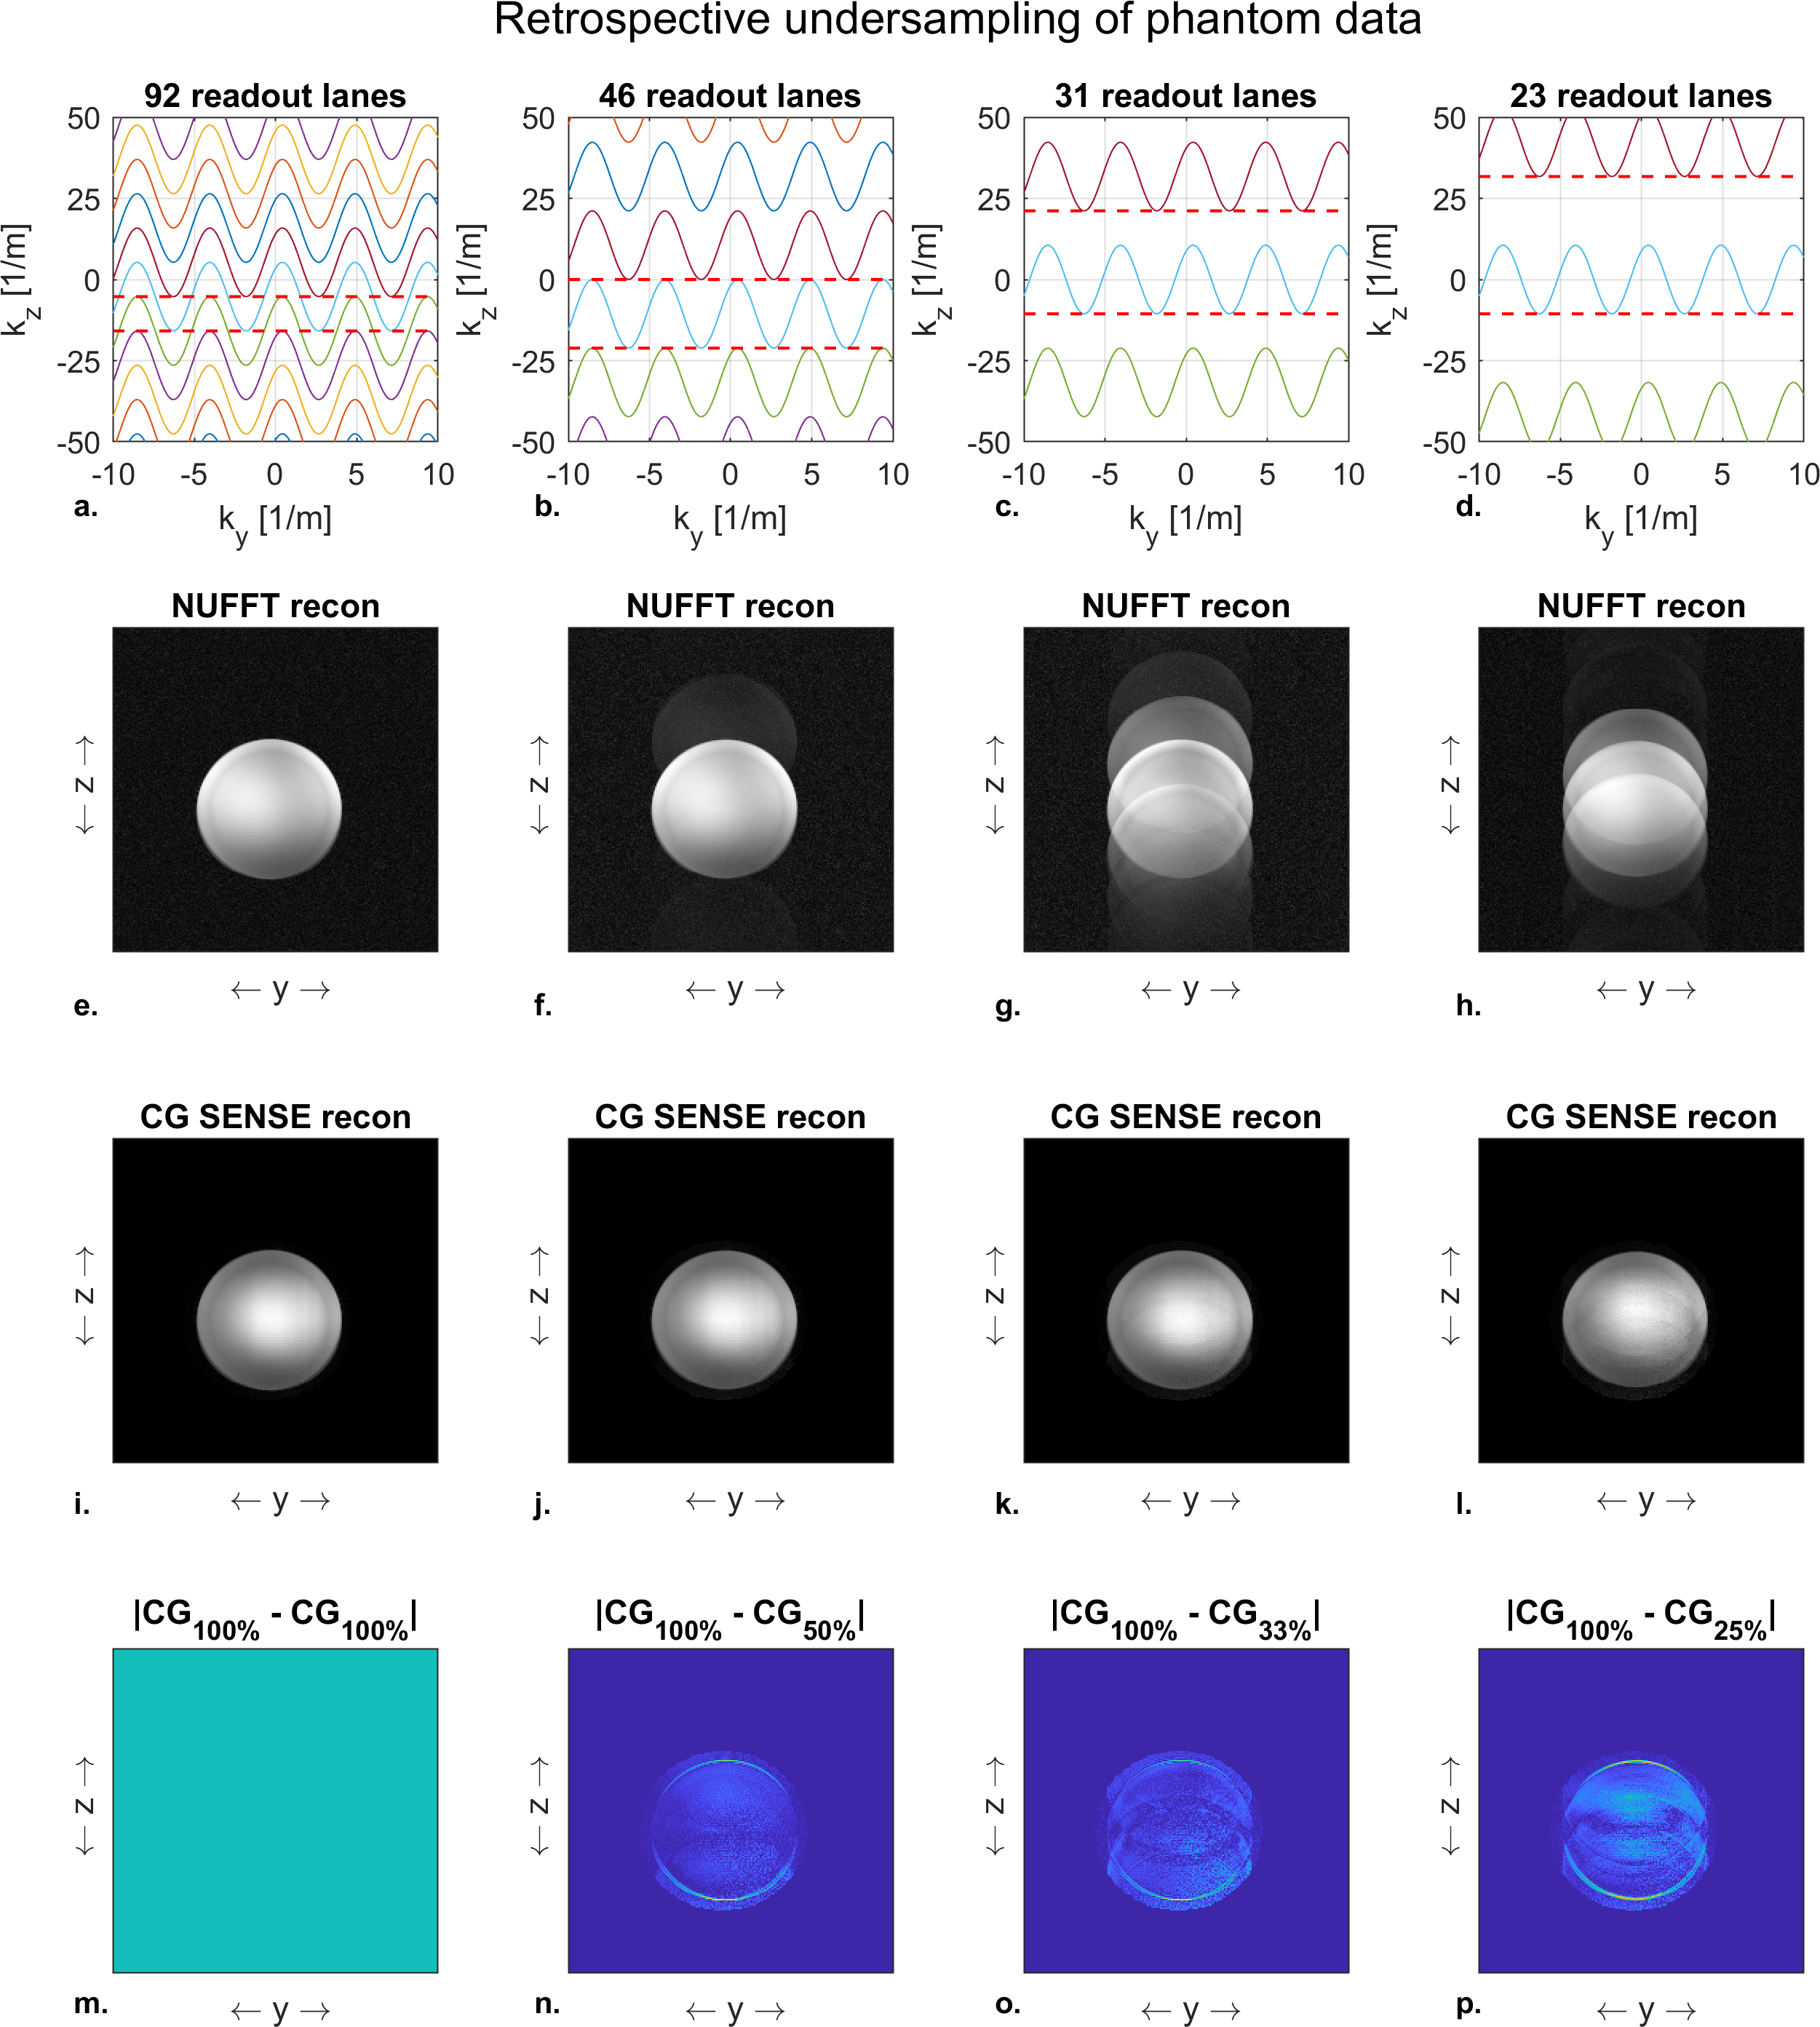
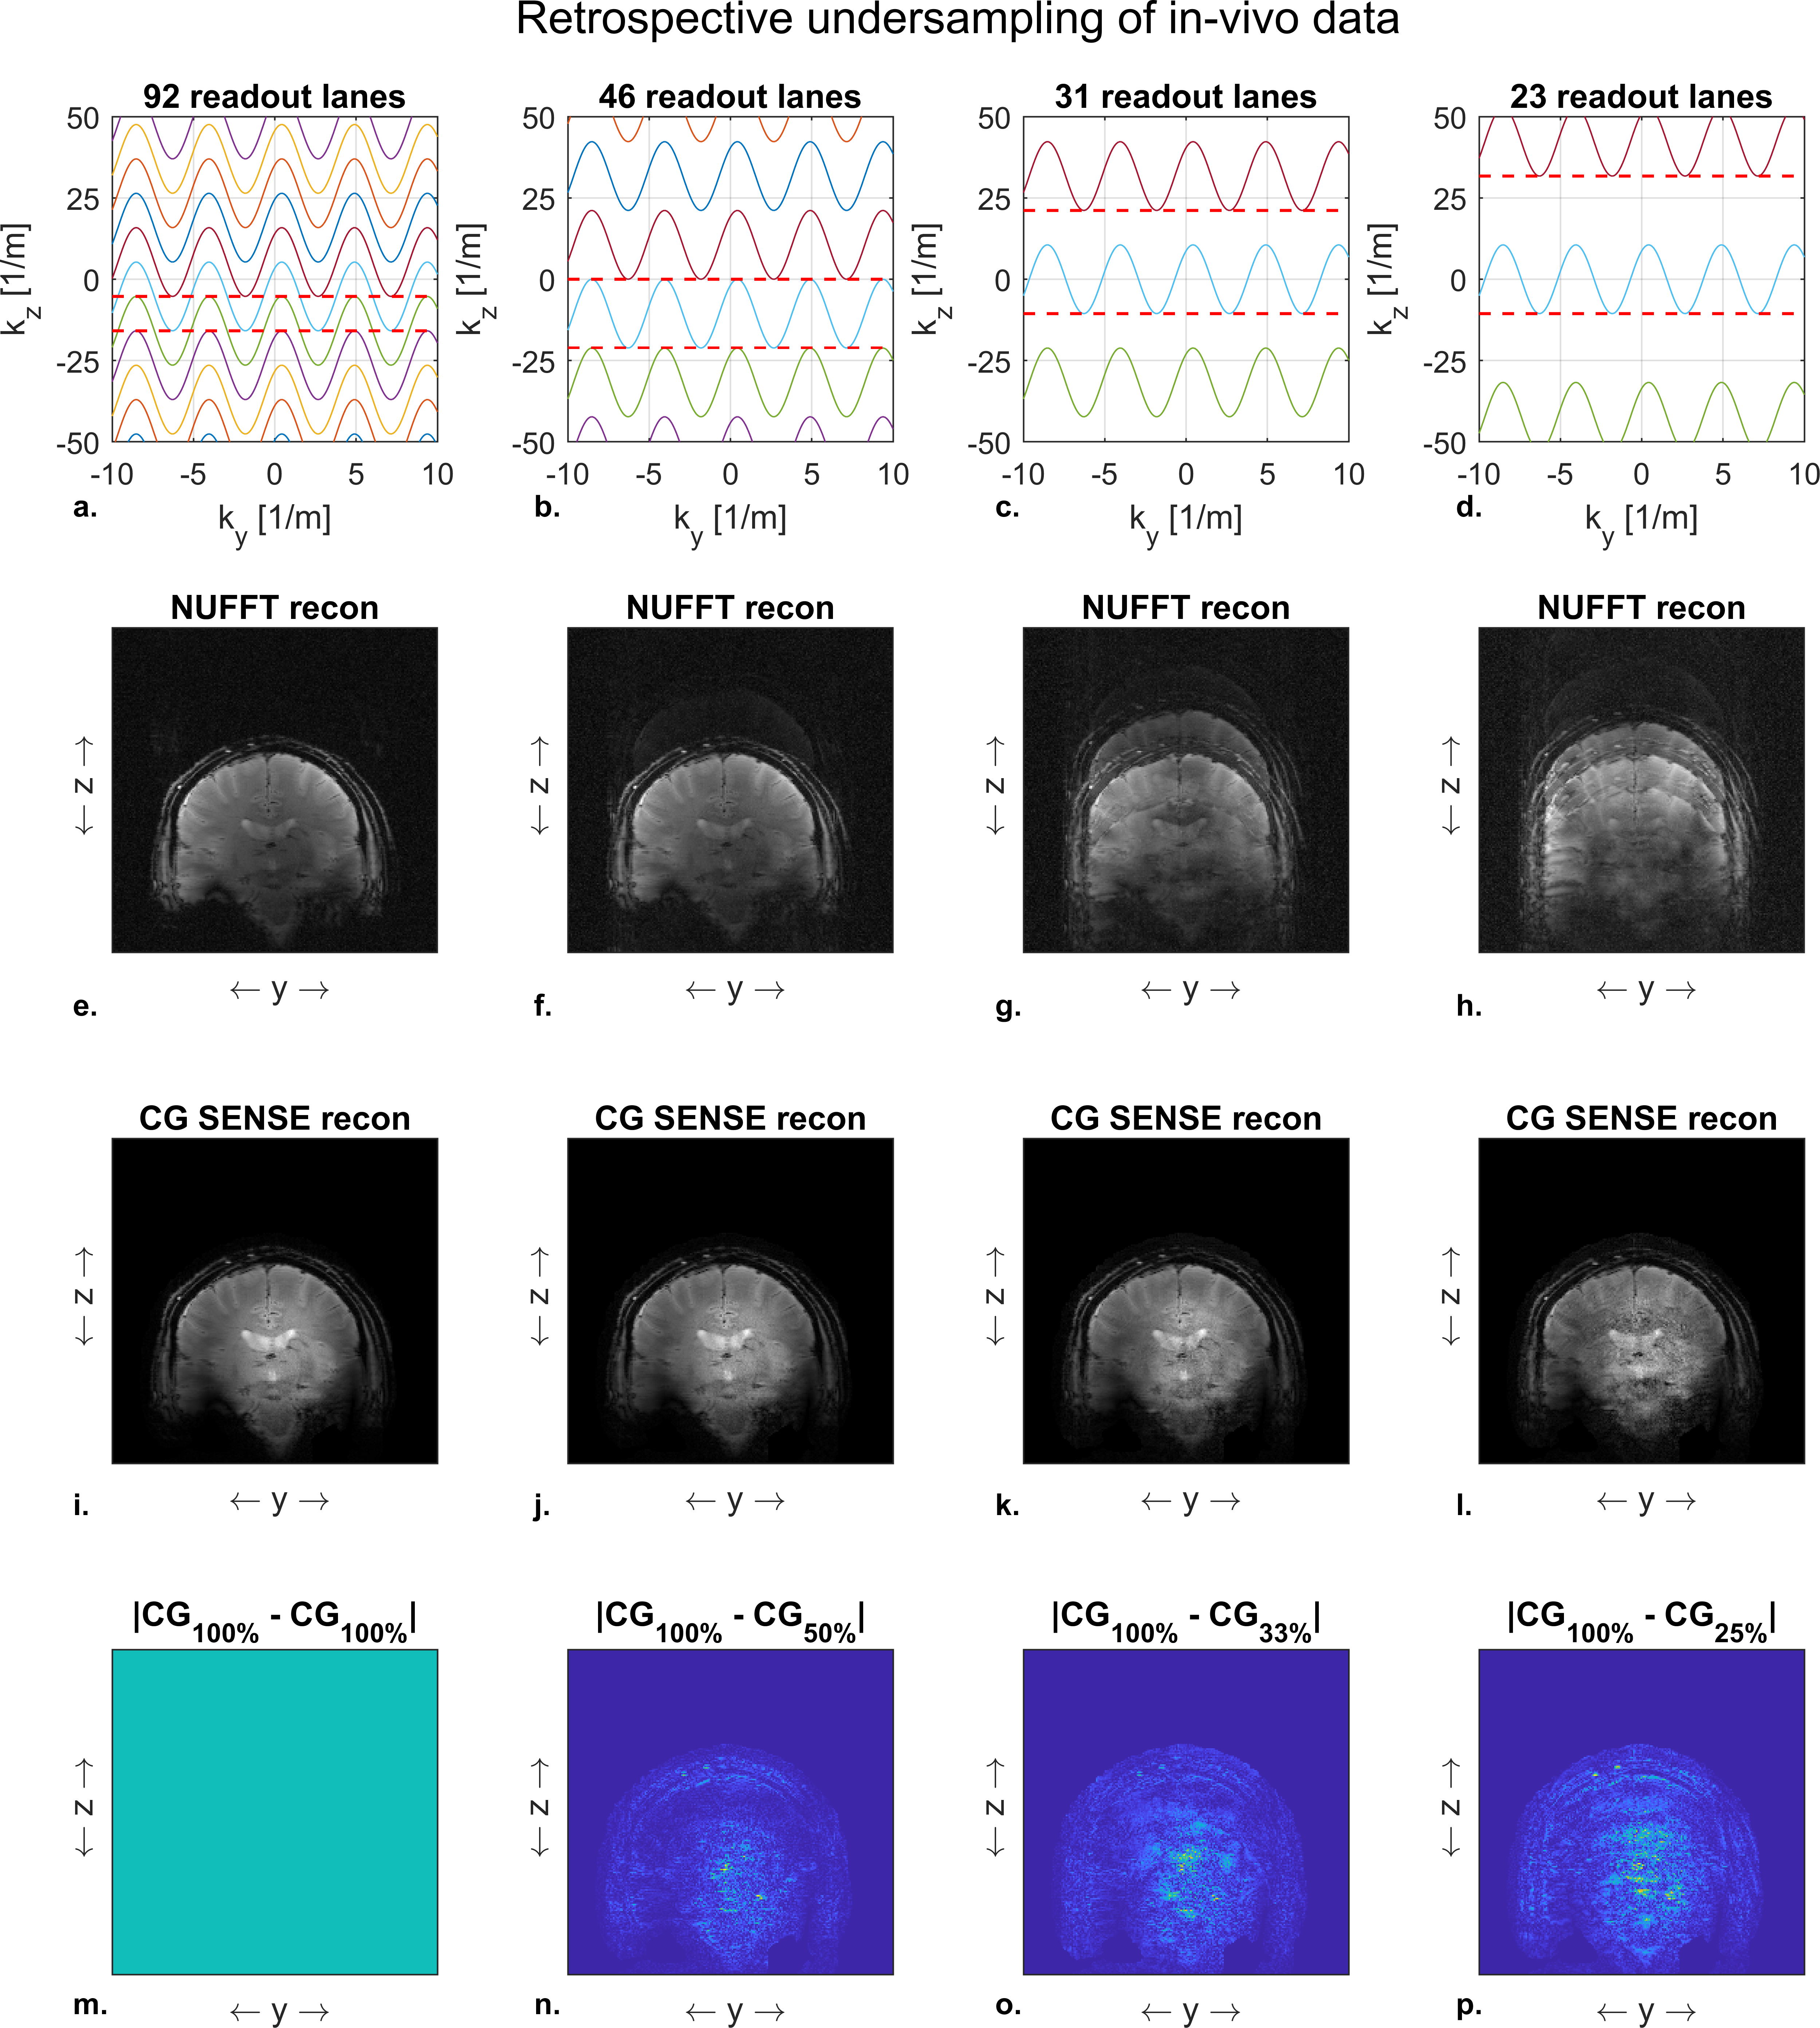
The silent mode was achieved by driving a lightweight single-axis (z-direction) gradient insert (Futura Composites) with an 18-kW audio amplifier that produces 31.5 mT/m at 20.2 kHz. Imaging experiments were performed both in a phantom and in-vivo on a 7T MR-scanner (Philips Healthcare) by using the gradient insert with an integrated birdcage coil for transmit and a 32-channel receive coil (Nova Medical). The setup is shown in Figure 1.We used a 2D gradient echo sequence (Fig 2) with an in-plane resolution of 1 x 1 mm2, a FOV of 224 x 224 mm2, a flip angle of 26 degrees, and a TE of 11.7 ms. The TR was limited to a minimum of 62 ms due to the maximum duty cycle of the audio amplifier. We acquired a reference “fully sampled” acquisition consisting of 95 readout lanes. Here, each lane overlapped for 50% with the next lane. The minimum number of lanes needed for a relatively artefact free image reconstruction was investigated by retrospectively undersampling this acquisition to yield 46, 31 and 23 readout lanes (Fig 3-4 a-d).
Two reconstructions were performed: a gridding based non-uniform fast Fourier transform (NUFFT) with density compensation and a CG-SENSE reconstruction (2). Both methods required trajectory and density estimation, which were obtained from field camera measurements (Skope Inc.) and an iterative density estimation algorithm.3,4 Additionally, the CG-SENSE reconstruction required coil sensitivity estimates which were acquired and computed from coil reference scans. We used the absolute difference between the degrees of undersampling to qualitatively assess the residual aliasing artefacts present in the CG-SENSE reconstruction. A quantitative assessment of the reconstruction results was performed by computing the root-mean-square error (RMSE) of each reconstruction with respect to the “fully sampled” acquisition. For the RMSE calculation, we used the magnitude images which were scaled to their mean value.
Results and Discussion
The NUFFT reconstruction only returned an artifact free reconstruction for the reference full k-space acquisition. Here, a reduction in the number of readout lanes resulted in a direct increase in aliasing artefacts (Fig 3-4 e-h). These originate from the relatively large variations in k-space sampling density in the direction of the silent gradient axis.The CG-SENSE reconstruction showed no visible aliasing artifacts when reconstructing using 46 out of the 95 readout lanes (Fig 3-4 i-j). A further reduction to 31 readout lanes resulted in noticeable but subtle aliasing artifacts (Fig 3-4 k). Additionally, the decrease in readout lanes yielded an increase in noise in the images due to the decrease in data points used for reconstruction (Fig 3-4 m-p). Reducing the number of readout lanes to 23 resulted in visible aliasing artefacts in both the phantom and in-vivo reconstructions (Fig 3-4 l).
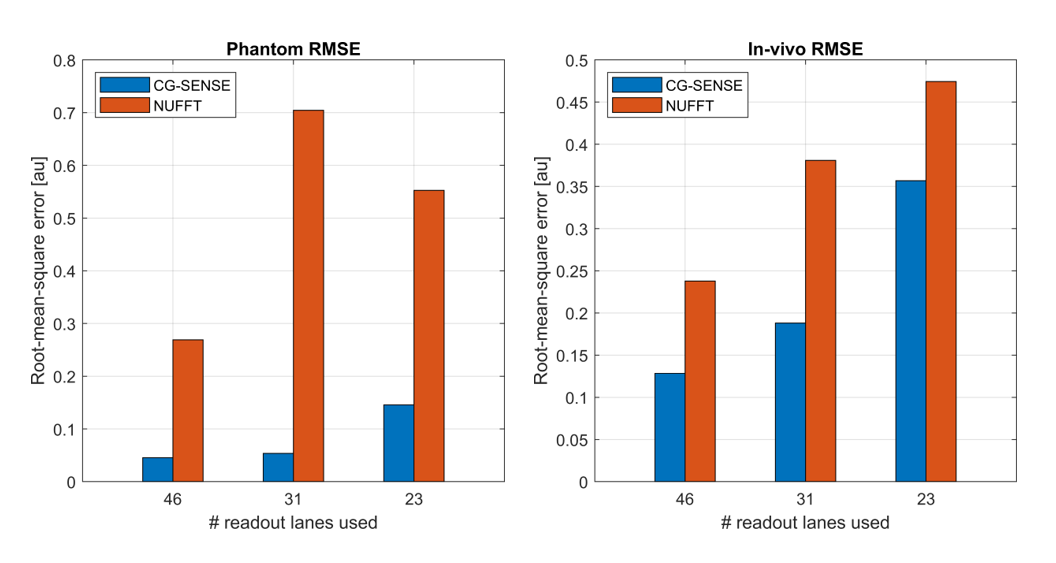
Figure 5 shows the RMSE of each reconstruction. Here, the CG-SENSE reconstruction showed a lower RSME than the NUFFT reconstruction for all cases, as the addition of coil sensitivity data allowed for unfolding of the aliasing artifacts. When reducing the number of readout lanes, the RMSE of the CG-SENSE reconstruction increased due to the presence of more aliasing artifacts. The largest increase in RMSE (2.7-fold in the phantom and 1.9-fold in-vivo) was observed when going from 31 to 23 readout lanes.
A fully sampled acquisition for the same image parameters would acquire 224 k-space lines. In comparison, the 46 readout lanes for no aliasing artefact would result in an acceleration factor of 224/46 = 4.8. A 224/31 = 7.2-fold acceleration could be reached when limited aliasing artefacts in the image are permitted. When expanding the presented framework to 3D-acquisitions a further acceleration is foreseen by sampling the readout lanes in a CAIPI-like pattern.
Conclusion
We have shown that by undersampling and CG-SENSE reconstruction the efficiency of imaging with a silent gradient axis can be increased 2-3-fold without noticeable artifacts.Acknowledgements
No acknowledgement found.References
1. Versteeg E, Klomp D, Hendrikse J, Siero J. Supersonic imaging with a silent gradient axis driven at 20 kHz. In: Proceedings of the 27th Annual Meeting of ISMRM. ; 2019. p. #4586.
2. Pruessmann KP, Weiger M, Börnert P, Boesiger P. Advances in sensitivity encoding with arbitrary k -space trajectories. Magn. Reson. Med. 2001;46:638–651 doi: 10.1002/mrm.1241.
3. Dietrich BE, Brunner DO, Wilm BJ, et al. A field camera for MR sequence monitoring and system analysis. Magn. Reson. Med. 2016;75:1831–1840 doi: 10.1002/mrm.25770.
4. Zwart NR, Johnson KO, Pipe JG. Efficient sample density estimation by combining gridding and an optimized kernel. Magn. Reson. Med. 2012;67:701–710 doi: 10.1002/mrm.23041.
Figures