3428
Fast radial T2 mapping of the liver1Department of Radiology, Medical University Vienna, Vienna, Austria, 2Christian Doppler Laboratory for Clinical Molecular Imaging, MOLIMA, MUW, Vienna, Austria, 3Siemens Healthcare GmbH, Erlangen, Germany, 4Siemens Siemens Healthcare Diagnostics GmbH, Graz, Austria, 5Division of Endocrinology and Metabolism, Department of Medicine III, Medical University of Vienna, Vienna, Austria
Synopsis
Radial T2 mapping of the liver is fast and motion insensitive, which is ideal for clinical applications. Here we tested a prototype radial turbo-spin-echo sequence for T2 mapping of the liver in phantoms and in-vivo in patients. In the phantoms we compared it to conventional Cartesian multi-SE sequence and tested the effect of fat suppression by comparing fat-suppressed and fat-unsuppressed values. From the patient evaluation, comparing it to single-voxel multi-echo MRS, we proved it to be suitable for clinical applications and a promising tool for characterization of diffuse liver disorders, but there are systematic differences between different methods.
Introduction
Magnetic resonance is a non-invasive modality that was established as a reliable method for diagnosis of many liver disorders1,2,3. Hepatic T2 relaxation times change with many pathological conditions, but clinical application of conventional techniques is limited due to breathing motion in the abdomen and long scan times. A fast radial turbo-spin-echo (rTSE) sequence was proposed to overcome these problems4. Crossing the center of the k-space with each acquisition results in oversampling and averaging of low spatial frequencies and to motion insensitivity. In combination with tiered echo sharing and pseudo golden angle ratio reordering, the scan time is reduced, which makes it acceptable in clinical settings5. Therefore, the goal of this study was to test a fast prototype rTSE T2 map in phantoms and in-vivo.Workflow & methods
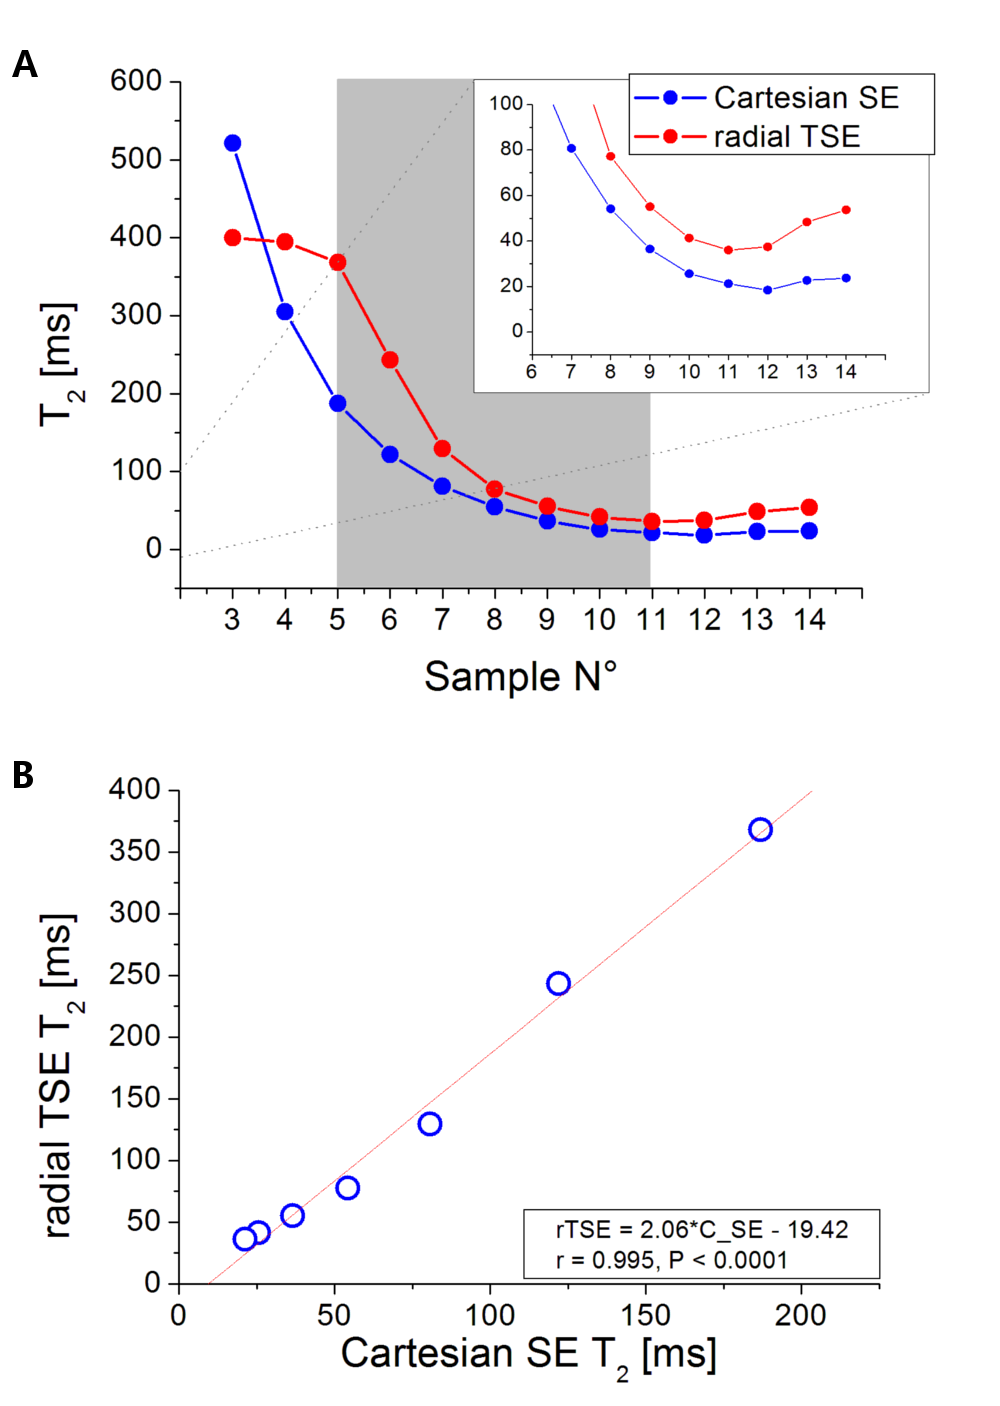
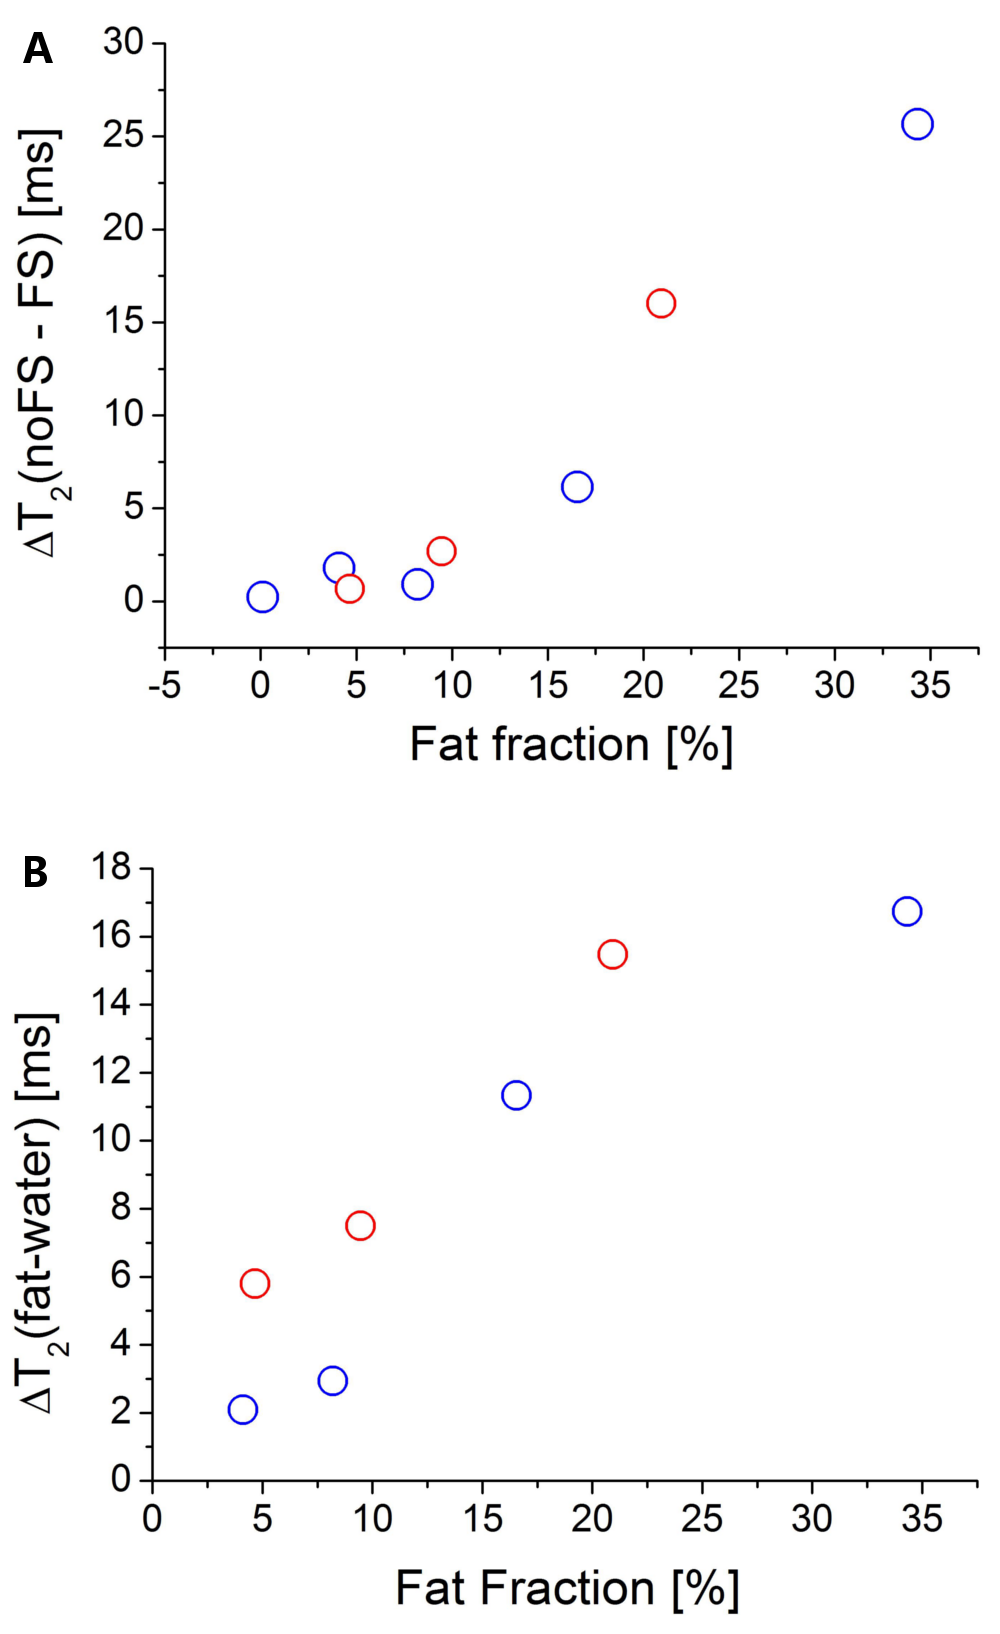
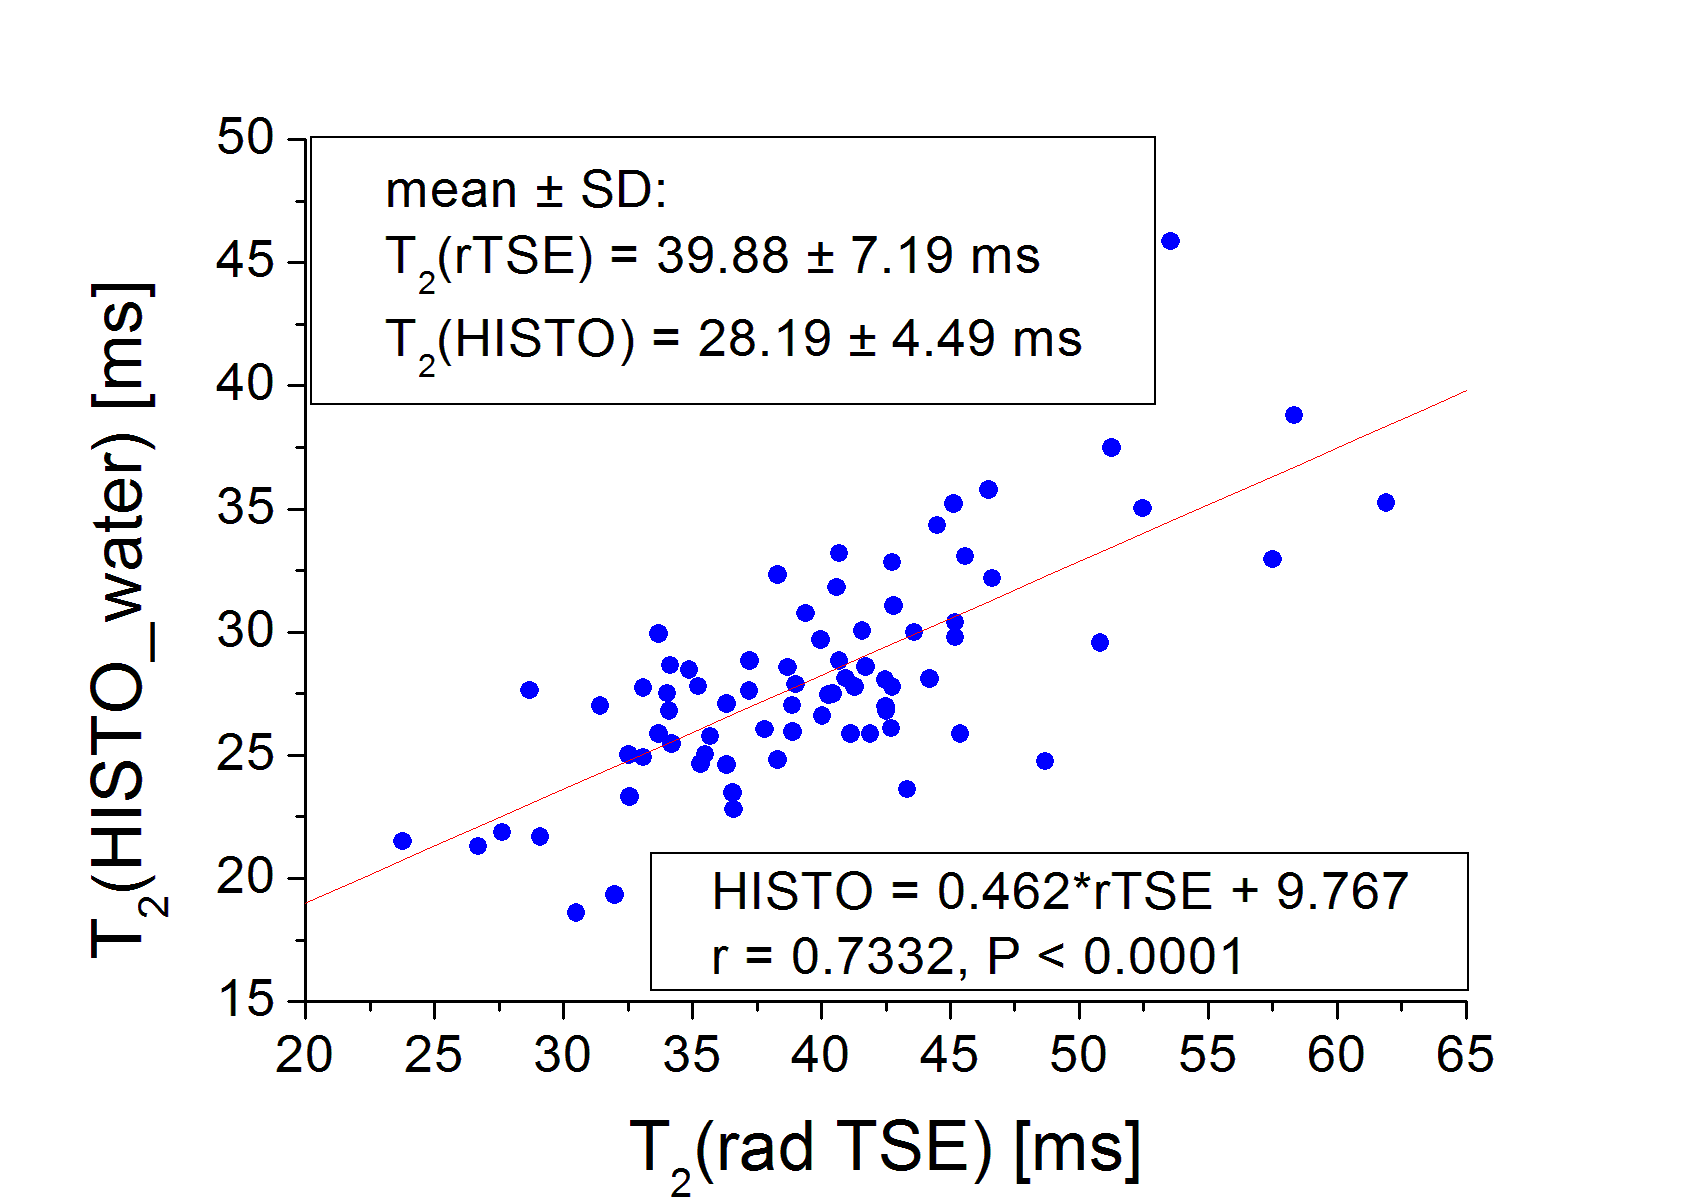
A prototype rTSE T2 map (TR = 1500 ms, turbo factor = 29, TE range = 9.2 – 266 ms, FOV = 400×400 mm2, matrix = 256×256, FA = 180˚, ST = 6 mm, total acquisition time = 17 sec) was compared to conventional Cartesian multi-SE based T2 map (TR = 5000 ms, turbo factor = 32, TE range = 11.5 – 380 ms, FOV = 250×250 mm2, matrix = 256×256, FA = 180˚, ST = 6 mm, total acquisition time > 20 minutes) in the NIST phantom with a T2 array (range 8 – 800 ms)6 at a 3T MRI scanner (MAGNETOM Prisma Fit, Siemens Healthcare, Erlangen, Germany), equipped with a 18-channel body coil and 32-channel spine coil. Secondly, to test the effect of fat suppression on the T2 values obtained by the rTSE, fat-suppressed (FS) and fat-unsuppressed (noFS) acquisitions were compared in phantoms with variable fat fraction (FF = 0-30%). T2 values were calculated inline using a mono-exponential signal model and noise floor subtraction; for rTSE, the first echo was excluded from the fit to reduce the effect of stimulated echoes. For comparison, single voxel multi-echo STEAM spectroscopy (HISTO, 5 TEs = 12, 24, 36, 48 and 72 ms, TR = 3 s)7, which allows separate water and fat relaxometry, was measured in this case. Finally, T2 values from fat-suppressed rTSE T2 map and HISTO MRS-based acquisition were evaluated in a heterogeneous group of 75 patients appointed to clinical abdomen examinations. The presence of streaking artifacts, to which radial acquisitions are prone, was subjectively evaluated, and the BMI was recorded for each patient. Patients were divided into 3 groups: normal, overweight and obese. T2 values were compared, and the effect of BMI on streaking artifacts was evaluated.Results
From the NIST phantom measurement, rTSE T2 values were capped at 400 ms by the fitting algorithm. There was an excellent correlation between the rTSE and Cartesian values in the range of T2s ≈ 22 – 260 ms, but rTSE gave systematically higher values (Figure 1).In the phantoms containing fat, the application of FS in rTSE decreased the T2 values in samples with FF over 10% (Figure 2(A)). From the HISTO results, the T2s of fat are longer than water T2s, and with increasing FF the difference is also increasing (Figure 2(B)). Moreover, correlation between rTSE T2s and MRS-T2s of water was improved with the application of FS (r=0.722, P=0.043 without, r=0.849, P=0.008 with FS).
In the patient group, there were 42 women (age = 58.9 ± 18.2y) and 34 men (age = 63.2 ± 11.4y). rTSE T2 values ranged from 23.8 to 61.9 ms (mean = 39.9 ms). HISTO T2 water values ranged from 18.6 to 45.9 ms (mean = 28.2 ms). There was a significant correlation between rTSE and HISTO T2 values (r = 0.7332, P < 0.0001, Figure 3), but there is a systematic difference between the two.
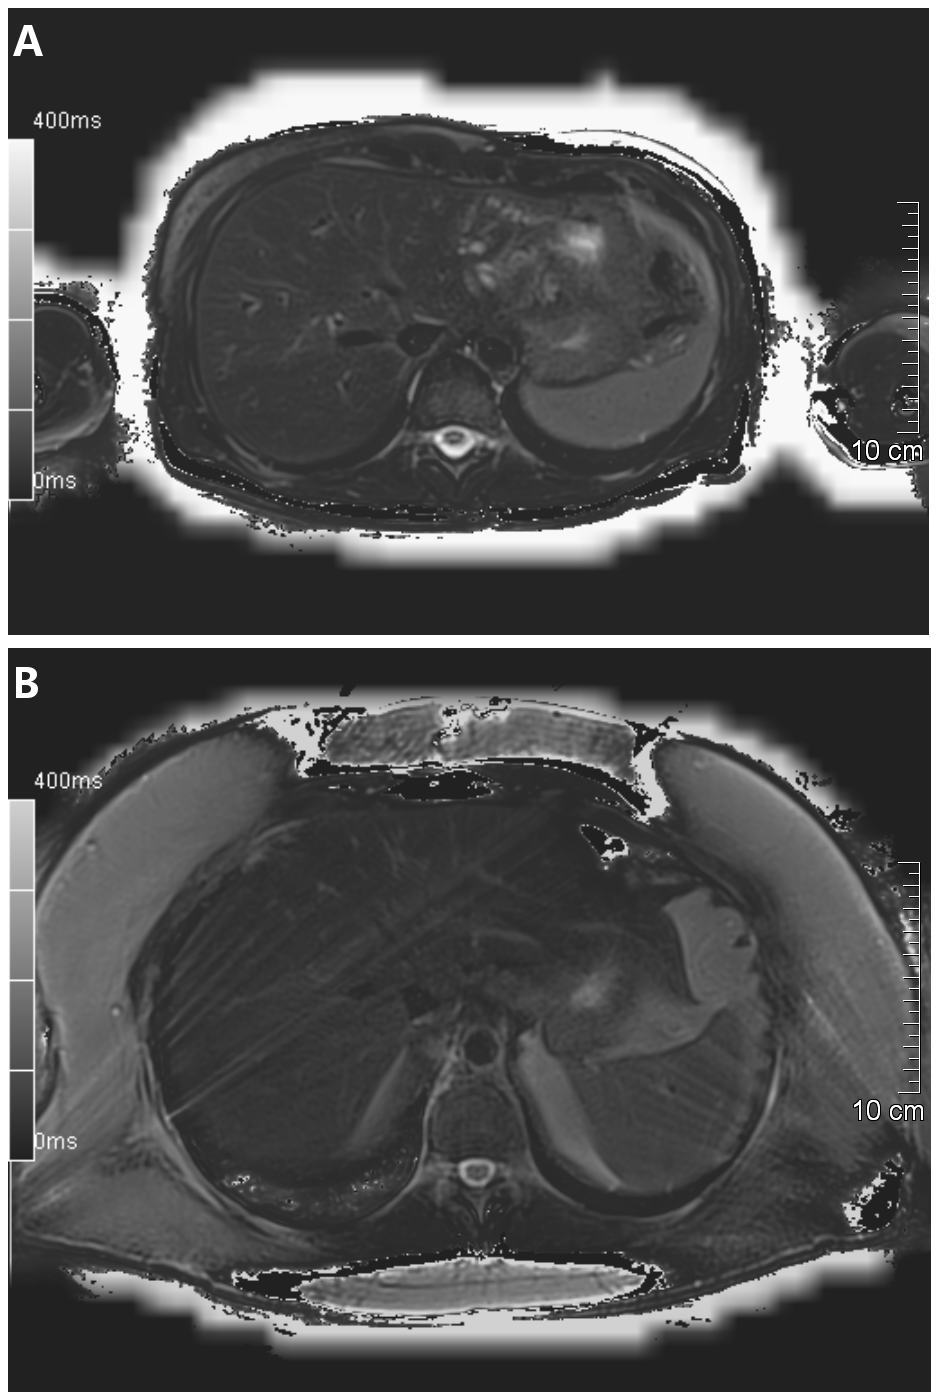
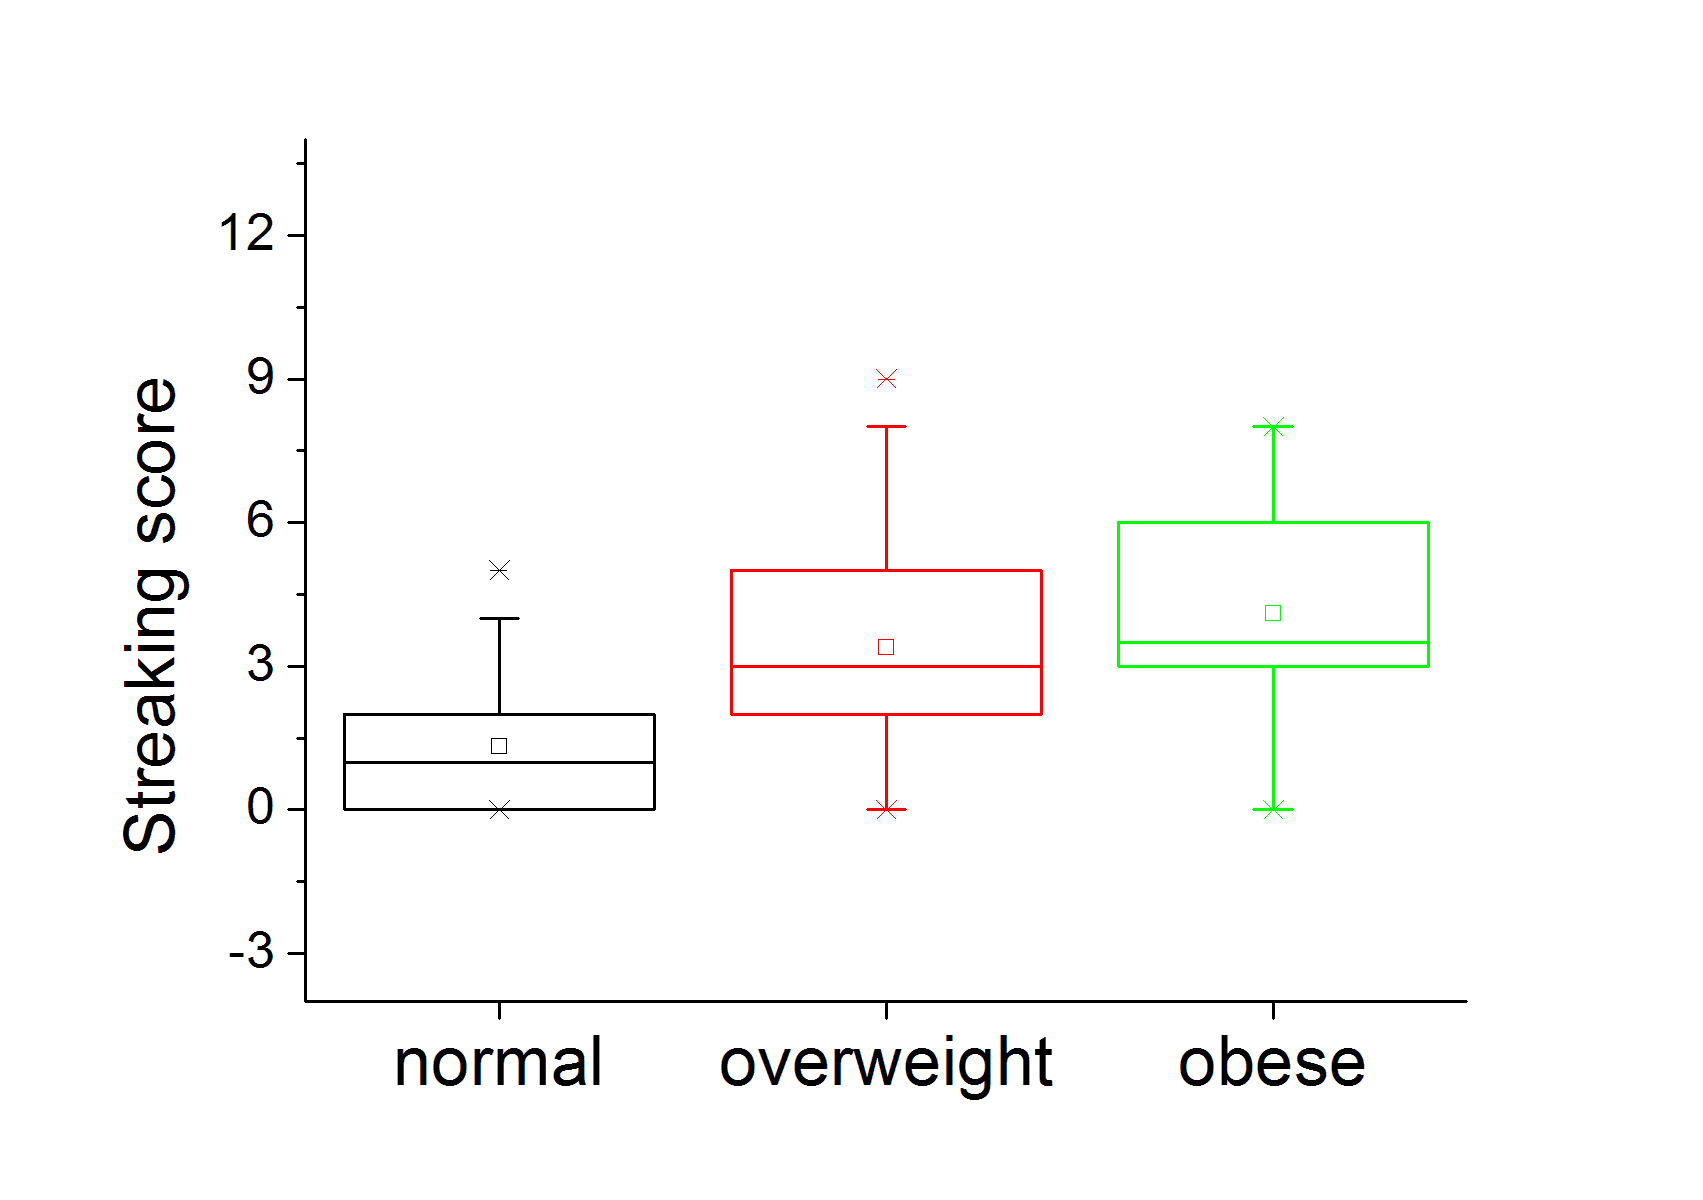
There were 41 patients with normal BMI, 25 overweight and 10 obese patients. All the T2 maps were fit to be evaluated (representative T2 maps without and with streaking artifacts present are shown in Figure 4). The streaking artifacts score for each group is given in Figure 5. There was a significant difference between normal and overweight and between normal and obese (Games-Howell test, P = 0.002 and P = 0.02, respectively), but no difference between overweight and obese patients (P = 0.756, Figure 5).
Discussion
There are systematic differences in phantom T2 values between rTSE and Cartesian; potential reasons include differences in sequence parameters and the parameter fitting. Going forward, advanced algorithms should be considered8. The discrepancy between rTSE and HISTO in our results is in agreement with a previously reported study that compared multiple single-spin-echo imaging with HISTO9. There, a non-unity slope (0.548) and an intercept of 16.29 was reported from regression analysis. In our study the slope is similar (0.462) and the intercept is 9.767 which reflects the fact that rTSE yields higher values. The presence of streaking artefacts, which increases with increasing BMI, results in limited measurable ROI areas. In addition, as indicated by the phantom results, fat signal influences the T2 values, therefore fat suppression appears necessary. A limitation of this study is the missing direct comparison to a reference standard.Conclusion
rTSE T2 mapping is practical for in-vivo application, making it a promising tool for characterizing diffuse liver disorders.Acknowledgements
This study was funded by the Christian Doppler Laboratory for Clinical Molecular MR Imaging (Austrian Federal Ministry for Digital and Economic Affairs and the National Foundation for Research, Technology and Development).
Word of thanks belongs to Yutaka Natsuaki, who is the original developer of the rTSE T2 mapping prototype.
References
1. Zhan, Chenyang, et al. Detection of hepatic steatosis and iron content at 3 Tesla: comparison of two-point Dixon, quantitative multi-echo Dixon, and MR spectroscopy. Abdominal Radiology, 2019, 44.9: 3040-3048.
2. Dekkers, Ilona A.; LAMB, Hildo J. Clinical application and technical considerations of T 1 & T 2 (*) mapping in cardiac, liver, and renal imaging. The British Journal of Radiology, 2018, 91.1092: 20170825.
3. Banerjee, Rajarshi, et al. Multiparametric magnetic resonance for the non-invasive diagnosis of liver disease. Journal of hepatology, 2014, 60.1: 69-77.
4. Altbach, Maria I., et al. Radial fast spin‐echo method for T2‐weighted imaging and T2 mapping of the liver. Journal of Magnetic Resonance Imaging: An Official Journal of the International Society for Magnetic Resonance in Medicine, 2002, 16.2: 179-189.
5. Natsuaki, Yutaka, et al. Flexible and Efficient 2D Radial TSE T2 Mapping with Tiered Echo Sharing and with “Pseudo” Golden Angle Ratio Reordering. In: Proceedings of the 25th ISMRM annual meeting, Honolulu, HI. 2017.
6. NIST phantom: https://collaborate.nist.gov/mriphantoms/bin/view/MriPhantoms/MRISystemPhantom. ISMRM/NIST MRI System Phantom. Accessed October 5, 2019.
7. Pineda, Nashiely, et al. Measurement of hepatic lipid: high-speed T2-corrected multiecho acquisition at 1H MR spectroscopy—a rapid and accurate technique. Radiology, 2009, 252.2: 568-576.
8. Huang, Chuan, et al. T2 relaxometry with indirect echo compensation from highly undersampled data. Magnetic resonance in medicine, 2013, 70.4: 1026-1037.
9. Lin, Huimin, et al. Quantitative analysis of hepatic iron in patients suspected of coexisting iron overload and steatosis using multi‐echo single‐voxel magnetic resonance spectroscopy: Comparison with fat‐saturated multi‐echo gradient echo sequence. Journal of Magnetic Resonance Imaging, 2018, 48.1: 205-213.
Figures