3424
Fast, Automatic MRI Quality Assurance: Validation and Comparison with Manual Analysis using the ACR phantom1Centre for Advanced Imaging, The University of Queensland, Brisbane, Australia, 2Medical Imaging Department, The Hashemite University, Al-Zarqa, Jordan, 3ARC Training Centre for Innovation in Biomedical Imaging Technology, The University of Queensland, Brisbane, Australia, 4Royal Brisbane & Women's Hospital, Queensland University of Technology, Brisbane, Australia, 5School of Information Technology and Electrical Engineering, The University of Queensland, Brisbane, Australia
Synopsis
Quality assurance (QA) is mandatory to ensure the stable performance of MR scanners over time. Automated analysis of QA tests can be useful to increase operator efficiency and overcome the manual processing issues such as time constraints and human bias. In this paper, we compare the manual and automated analysis approaches of the QA image datasets that have been collected from 3T MRI scanners using the American College of Radiology (ACR) accreditation phantom. We found that the automated method can significantly reduce the QA analysis time and the results of both methods were in agreement with each other.
Introduction
The manual evaluation and analysis of the QA tests of the ACR phantom is time consuming and subject to human errors [1, 2]. Several studies have used different approaches in an attempt to automate QA tests of the ACR phantom [3-5]. Sun et. el. [6] developed an Open Source Automatic QA (OSAQA) software written in Matlab, which reduced the QA time from ~45 to 2 min and generates an immediate log file to review the results. In this work, we demonstrate the consistency of the results obtained from OSAQA software in comparison to the manual measurements on ACR phantom images generated from human 3T MRI scanner.Methods
Ten datasets of ACR phantom measurements were collected from a 3T whole body MR scanner (Siemens Magnetom PRISMA, Siemens Healthcare, Erlangen, Germany) using the product twenty-channel Siemens Direct Connect head coil. The scanning protocols for QA were organised according to the ACR Site Scanning Instruction [7], parameters specific to pulse sequences are presented in (Table 1). A vendor implemented "Prescan Normalise” filter was used for each scan to correct for the intensity inhomogeneity. Accurate and precise phantom positioning was done using ACR cradle (Siemens Healthcare) and spirit-level. The imaging protocol and coordinates for slice positioning were saved to simplify the scanning process and to ensure reproducible scans. The scans were repeated approximately in 1-2 week intervals.Seven phantom tests (Fig. 1) were performed on both T1 and T2 weighted series. The images were evaluated by one radiographer manually (visually) according to the ACR instructions [8] using a DICOM editor (Sante software, version 6.8.1). Then, the same images were evaluated automatically using OSAQA software [6]. The extracted measurements values obtained from both methods were compared with the recommended acceptance values of ACR for the 3T scanners and analysed using GraphPad Prism. Student’s t test was used for comparing manual and automated measurements. Results with a p < 0.05 were considered to be statistically significant.
Results
The acquired ACR images and the individual tests can be seen in Figure 1. For the geometric accuracy test (Fig. 1a), the mean phantom diameter was calculated from slices 1 and 5 which complied with the ACR criterion (190 mm ± 2 mm) for both methods (Fig. 2a). The measurements of slice thickness accuracy test (Fig. 1b) agreed with the ACR criterion (5 ± 0.7 mm) for both methods (Fig. 2b). Slice position accuracy test (Fig. 1d) measures the bar length difference on slice 1 and slice 11. The results are assigned a positive value if the right bar is longer than left one and vice versa. Therefore, in order to have a consistent result, the measurements of both methods need to be within the criterion value (± 5 mm) and should have the same sign. Both methods produced slice position results within the criterion boundary (Fig. 2c).The measurement of image intensity uniformity (PIU) and Percent Signal ghosting tests were performed on Slice 7 (Fig. 1e & 1F), the ACR criterion is PIU ≥ 82 %, PSG < 2.5 %. (Fig. 2d) shows PIU results for both methods, the first two measurements didn’t pass the acceptance criterion while 3rd through 10th measurements passed. PSG measurements for both methods are shown in (Fig. 2e) and were within the ACR criterion value (<2.5%).
The resolution portion of the phantom contains three matrices of holes with diameter of 1.1 mm, 1.0 mm, and 0.9 mm (Fig. 1c). For both methods, the size of the smallest holes that were resolved was 0.9 mm, which agreed with the ACR criterion (≤ 1.0 mm). In OSAQA software, a method was developed to perform the contrast QA test visually in a similar way as the manual method [6]. The low contrast object detectability (LCOD) measurements were obtained from the slices 8 through 11 by counting the number of complete spoke in each slice. LCOD measurements are shown in (Fig. 2f) and agreed with the ACR criterion (sum of spokes ≥ 37).
The results obtained from automated OSAQA software were in agreement with the manual method results for all phantom tests (p > 0.05) except for the geometric accuracy and the PIU results (p < 0.05). However, both set of measurements were agreed with ACR acceptance values.
Discussion and Conclusion
In this study it was found that the human error introduced by manual (visual) assessment is a possible reason for the geometric accuracy and PIU results to be significantly different between the manual method and OSAQA software [2].The first two measurements of PIU test that didn’t pass the acceptance criterion were performed without phantom cradle. The cradle was used for phantom positioning for the rest of the PIU tests, where the results were found to be within the accepted range. This observation emphasizes the benefit of using phantom cradles for avoiding poor phantom positioning, which can potentially result in uneven image intensity and unnecessary scanning delays.
Results obtained in this study have demonstrated that OSAQA software can significantly reduce the QA time without sacrificing accuracy of the test results and thus could potentially replace the manual method and improve department efficiency.
Acknowledgements
H.A acknowledges the Hashemite University PhD scholarship and the partially fund by the Australian Research Council (project number IC170100035). The authors are very grateful to the facility members of the National Imaging Facility; Aiman Al Najjar and Nicole Atcheson, at Centre for Advanced Imaging, The University of Queensland, for help with scanning. .References
1. Ihalainen, T.M., et al., MRI quality assurance using the ACR phantom in a multi-unit imaging center. Acta oncologica, 2011. 50(6): p. 966-972.
2. Panych, L.P., et al., On replacing the manual measurement of ACR phantom images performed by MRI technologists with an automated measurement approach. Journal of Magnetic Resonance Imaging, 2016. 43(4): p. 843-852.
3. Huff, S.J., Software development and automation of the American College of Radiology MR phantom testing accreditation criteria for the general electric magnetic resonance imaging whole body scanner. 2003, Milwaukee School of Engineering.
4. Panych, L., L. Bussolari, and R. Mulkern. Automated analysis of ACR phantom data as an adjunct to a regular MR quality assurance program. in Int Soc Magn Reson Med. 2010.
5. Davids, M., et al., Fully-automated quality assurance in multi-center studies using MRI phantom measurements. Magnetic resonance imaging, 2014. 32(6): p. 771-780.
6. Sun, J., et al., An open source automatic quality assurance (OSAQA) tool for the ACR MRI phantom. Australasian physical & engineering sciences in medicine, 2015. 38(1): p. 39-46.
7. Radiology, A.C.o., Site Scanning Instructions for Use of the MR Phantom for the ACRTM MRI Accreditation Program, 2002.
8. ACo, R., Phantom test guidance for the ACR MRI Accreditation Program. Reston, Va: ACR, 2005.
Figures
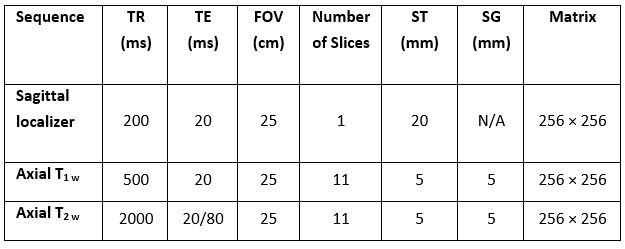
Table 1 Spin Echo Pulse sequence parameters
TR= Repetition Time, TE = Echo Time, ST = Slice Thickness, and SG = Slice Gap
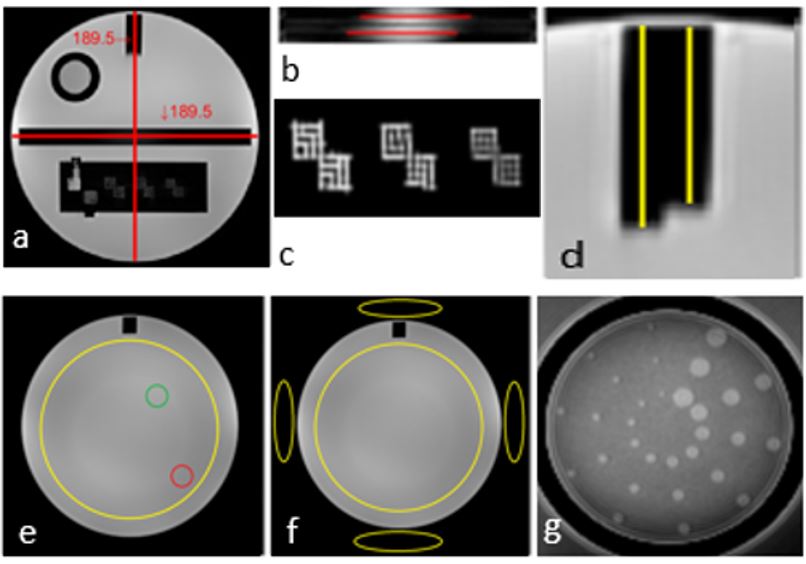
Fig 1 Illustration of ACR Phantom QA Tests:
a) Geometric Distortion, b) Slice Thickness accuracy, c) High contrast Spatial Resolution, d) Slice Position Accuracy, e) Percent Integral Uniformity (PIU), f) Percent Signal Ghosting (PSG) and g) Low Contrast Object Detectability.
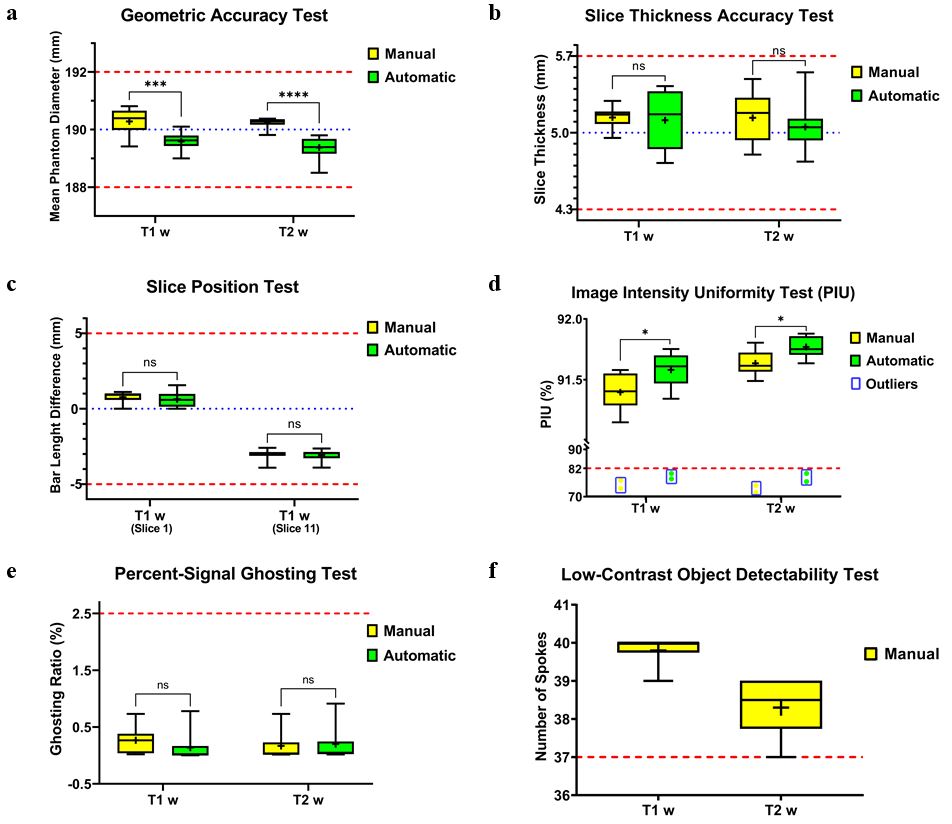
Fig 2 The results obtained by manual and OSAQA methods:
a) Geometric Test, b) Slice Thickness Accuracy Test, c) Slice Position Test, d) Intensity Uniformity Test, e) PSG Test, f) LCOD Test. All data are presented as mean ± SD. ACR acceptance levels: dashed red lines, Ideal values (where applicable): blue line. Student’s t test was used for comparing the results of both methods (*, P ≤ 0.05, ***, p ≤ 0.001, ****, p ≤ 0.0001). The outliers in Fig. 2d represents the data from the first two measurements without using the phantom cradle.