3420
Scrambled readout polarities in 3D-encoded EPI markedly reduce the coherence of N/2 ghosts1Radiology, Perelman School of Medicine, University of Pennsylvania, Philadelphia, PA, United States
Synopsis
N/2 ghosts in EPI result from consistent discrepancies between readouts with positive and negative polarities. We present 3D EPI with scrambled readout polarities as a strategy to reduce the coherence of N/2 ghosts in 4D x-f space and reduce their impact on quantitative analyses (e.g., motion tracking or resting state fMRI). We demonstrate that the method can produce either individual volumes with N/2 ghost energy spread out in the partition direction, or complete 4D x-f data with ghosts spread in both partition and frequency directions.
Introduction
N/2 ghosts in EPI result from consistent discrepancies between readouts with positive and negative polarities. A variety of methods have been proposed to correct these imperfections, using calibration measurements [1,2] or image-driven approaches [3]. While these methods substantially reduce the artifact, in the context of quantitative time-series analyses the existence of even weak ghosts can induce correlations between voxels at a distance. Additionally, because the artifacts appear as image-copies in the phase-encode direction, they induce non-rigid effects even when objects move rigidly, and can thus interfere with image registration methods used to retrospectively correct head motion.3D-encoded EPI, with acquisition segmented in the partition direction, has the benefit of substantially reduced spin-history effects when subjects move, due to the use of non-selective pulses. To that end, 3D EPI volumes have been demonstrated as a high-speed navigator to track subject motion in longer scans [4-6]. In this work we present a strategy to reduce the coherence of N/2 ghosts in 4D $$$x-f$$$ space (the Fourier-pair of $$$k-t$$$ space). By reducing the coherence of the ghosts, we aim to make them easier to filter out, and reduce their effects on subsequent quantitative analyses.
Methods
A 3D-encoded EPI sequence was modified to randomly flip the readout polarity of each partition segment. One extra partition was added to each volume, acquired without phase- or partition-encoding gradients, which can provide calibration data for readout imperfections. A phantom was imaged on a 3T scanner (Prisma, Siemens Healthineers, Erlangen, Germany) using the 16 head elements of the vendor’s 20-channel head/neck coil. Two scans were acquired: 1) conventional fixed RO polarity for all partitions, and 2) randomly shuffled RO polarity for each partition. All scans had 40 volumes, 4 mm isotropic resolution, FOV 256 x 256 x 208 mm3, 63 phase-encoding steps, 52 partitions, 18 ms TE, 37 ms TR, 2604 Hz/px bandwidth, and 490 µs echo-spacing.Raw data was copied from the scanner and analyzed using custom C++ and Mathematica code. Each reference partition was used to estimate the effective delay at each spatial frequency via
$$ P(x, k_y) = \frac{R_-(x, k_y)^* R_+(x, k_y)}{\left| R_-(x, k_y) R_+(x, k_y) \right|} $$
where we combine pairs of opposite-polarity reference readouts ($$$R_+$$$ and $$$R_-$$$) that are neighbors in the $$$k_y$$$ direction, Fourier transformed along the $$$k_x$$$ direction, to estimate the needed correction phase $$$P(x, k_y)$$$. Treating $$$\sqrt{P(x, k_y)}$$$ and $$$\sqrt{P(x, k_y)}^*$$$ as symmetric transforms to the half-way-space between the positive and negative polarity errors, we can use $$$P(x, k_y)$$$ to correct data at each $$$k_y$$$ line regardless of its polarity. Each volume’s data was corrected using the $$$P(x, k_y)$$$ estimate from its associated reference partition.
Data from each receive channel was a) 3D Fourier transformed over the spatial dimensions to produce an $$$x-t$$$ space (we will call this the “Magnitude Volume” pipeline); and b) 4D Fourier transformed to produce a direct $$$x-f$$$ space (we will call this the “Direct 4D” pipeline). Taking the RMS combination across the channels in each of these spaces allows us to explore the coherence of the N/2 ghosts in these acquisitions.
Results
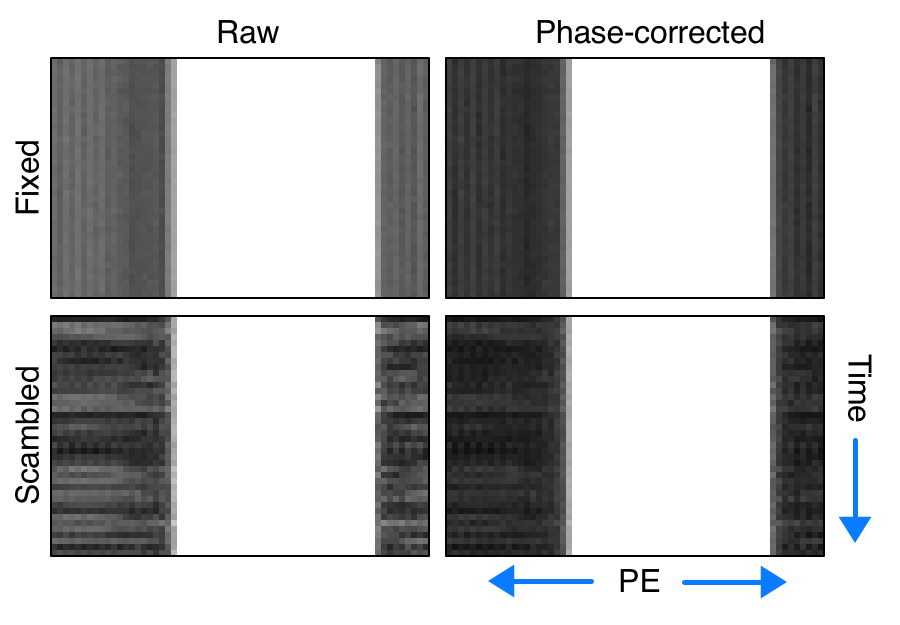
Figures 1 and 2 illustrate the spatial and temporal distributions (respectively) of N/2 ghost energy that results from fixed- and scrambled-polarity readouts when the phantom is still. These images were taken from $$$x-t$$$ space data (i.e., “Magnitude Volume” reconstructions).Figure 3 illustrates the temporal-frequency distribution of N/2 ghost energy that results from scrambled-polarity readouts when the phantom is still. Here we compare 1) data from the “Magnitude Volume” which pipeline which is then Fourier transformed in the time direction (as is normally done in resting state fMRI studies) with 2) using the “Direct 4D” Fourier transform to produce complex-valued $$$x-f$$$ spectral data.
Discussion
Our results in Figures 1, 2, and 3 show that scrambling the polarities of the readouts causes the energy of N/2 ghost to spread out in both the partition and frequency directions, making it less coherent and less correlated with the ‘true’ signal. We further demonstrate that this scrambling is compatible with online corrections to readout imperfections, and that together these jointly reduce the power and coherence of the N/2 ghost.Figure 3 highlights that care is needed in the reconstruction to render the ghost artifact maximally incoherent: doing time-series analysis on magnitude volumes causes the ghost artifact to become more coherent (large DC term), as the phase-scrambling of the ghosts across volumes is lost. However, the "Direct 4D" Fourier analysis is sensitive to phase instabilities giving rise to additional signal contributions at all frequencies.
Conclusion
We have presented scrambled RO polarity 3D EPI as a method to reduce N/2 ghost coherence. The resulting data can be reconstructed volume-by-volume to make magnitude images with N/2 ghosts spread incoherently in the partition direction, reducing artifacts in motion navigators or magnitude-based fMRI pipelines. If the 4D $$$x-f$$$ space is obtained directly via 4D Fourier transform, the N/2 ghosts are additionally spread incoherently in the frequency dimension.Future work will include 1) evaluating whether the partition-blurring improves motion tracking in volumetric navigators, and 2) combining this work with phase-stabilization methods to further improve the "Direct 4D" spectral resolution.
Acknowledgements
We would like to acknowledge NIH awards R00HD074649 and R34DA050297.References
[1] Bruder, H., Fischer, H., Reinfelder, H.-E., Schmitt, F., 1992. Image reconstruction for echo planar imaging with nonequidistantk-space sampling. Magnetic Resonance in Medicine 23, 311–323.
[2] Vannesjo, S.J., Graedel, N.N., Kasper, L., Gross, S., Busch, J., Haeberlin, M., Barmet, C., Pruessmann, K.P., 2016. Image reconstruction using a gradient impulse response model for trajectory prediction: GIRF-Based Image Reconstruction. Magnetic Resonance in Medicine 76, 45–58.
[3] Buonocore, M.H., Gao, L., 1997. Ghost artifact reduction for echo planar imaging using image phase correction. Magnetic Resonance in Medicine 38, 89–100.
[4] Hess, A.T., Tisdall, M.D., Andronesi, O.C., Meintjes, E.M., van der Kouwe, A.J.W., 2011. Real-time motion and B0 corrected single voxel spectroscopy using volumetric navigators. Magn. Reson. Med. 66, 314–323.
[5] Tisdall, M.D., Hess, A.T., Reuter, M., Meintjes, E.M., Fischl, B., van der Kouwe, A.J.W., 2012. Volumetric navigators for prospective motion correction and selective reacquisition in neuroanatomical MRI. Magnetic Resonance Medicine 68, 389–399.
[6] Andersen, M., Björkman-Burtscher, I.M., Marsman, A., Petersen, E.T., Boer, V.O., 2019. Improvement in diagnostic quality of structural and angiographic MRI of the brain using motion correction with interleaved, volumetric navigators. PLOS ONE 14, e0217145.
Figures