3412
MRI Near Metal Using Multi-Spectral 3D Variable Flip-Angle TSE1Department of Physics, University of Virginia, Charlottesville, VA, United States, 2Department of Radiology and Medical Imaging, University of Virginia, Charlottesville, VA, United States, 3Department of Biomedical Engineering, University of Virginia, Charlottesville, VA, United States
Synopsis
Multi-spectral imaging techniques such as MAVRIC, SEMAC, and MAVRIC SL based on 3D TSE sequence significantly reduce metal artifacts. MAVRIC and MAVRIC-SL techniques traditionally employ Gaussian RF pulses to achieve an optimal sum of squares composite image while SEMAC uses windowed-sinc RF pulses. In this work, we implement multi-spectral acquisition into the variable flip-angle TSE with hard RF pulses which yields a desirable sum of squares composite image while achieving high turbo-factor and minimal echo spacing in imaging near metallic screws in phantom and an ex vivo lamb leg.
Introduction
MAVRIC [1], SEMAC [2], and their combination MAVRIC-SL [3] are multi-spectral imaging (MSI) techniques that significantly reduce metal artifacts in imaging near metallic objects. For optimal image combination using sum of squares, MAVRIC and MAVRIC-SL implement Gaussian pulses which yield a composite image with minimal bandings or ripples. SEMAC uses windowed sinc to combine the multi-spectral images. Although Gaussian and sinc pulses are optimal for image combination, they are rather time-consuming, even when truncated. Typical range of turbo factor and echo spacing for MSI sequences based on MAVRIC, MAVRIC-SL, and SEMAC are roughly 8-20 and 7 ms [4-7], respectively.The variable flip-angle TSE [8] incorporates hard RF pulses with the benefit of high turbo factor and short echo spacing which helps prolong the signal for T2 contrast. In this work, we implement the main principles of MSI in the 3D variable flip-angle TSE and show composite image obtained from sum of squares of 29 overlapping spectral-bin images with minimal artifact and desirable T2 contrast near metallic screws in phantom and ex-vivo imaging of a lamb leg. A comparison between 2D VAT-TSE and 3D multi-spectral variable flip-angle TSE is presented.
Methods
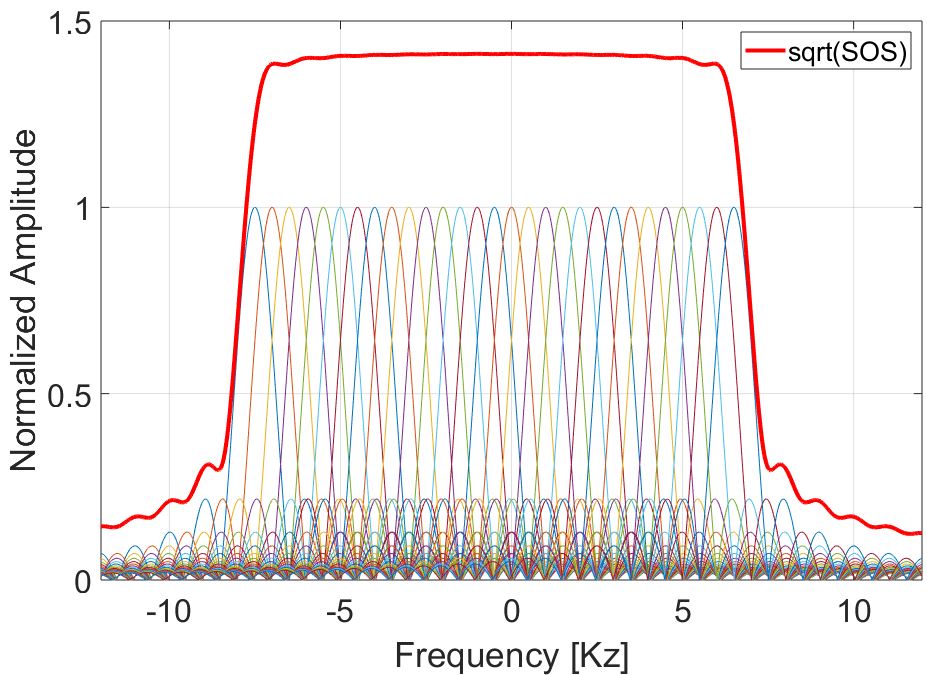
Images were acquired using a Siemens Magnetom Avanto clinical 1.5 Tesla scanner (Siemens AG, Erlangen). Titanium, 316 stainless steel, and nylon rods vertically positioned in water were used as the phantom. For ex-vivo imaging, three screws (One 316 stainless steel, one titanium, and one aluminum for reference) were tapped into the bone of a leg of lamb submerged in water. The standard 3D variable flip-angle TSE sequence was modified to incorporate the multi-spectral acquisition scheme and was used to acquire the images. Based on an initial spectral ping which demonstrated presence of off-resonance frequencies contained within ± 7 kHz, images from 29 spectral bins with 500 Hz central frequency spacing were acquired. Figure 1 shows the optimal spacing (500 Hz) between sinc-frequnecy pulses to yield a flat top frequency response with minor ripples. Following are the imaging parameters: coronal orientation, matrix size: 256x128, FOV: 13 - 26 cm, slice thickness: 3 mm, turbo factor: 91, echo spacing: 3.14 ms, TE/TR = 150/3000 ms, RBW = 1184 Hz/pxl, RF pulses: 1 ms rect, number of averages: 2, number of partitions 20. The multi-spectral images were combined off-line in MATLAB (Mathworks, Natick, MA) by means of sum of squares. The 2D TSE sequence was acquired using the same parameters as the 3D variable flip-angle TSE as follows: 256x128, FOV: 13 - 26 cm, slice thickness: 3 mm, RBW = 1184 Hz/pxl, TE/TR = 150/6000 ms, WARP: VAT with 100 % slice-select gradient (same slice-select gradient as the readout gradient).Results
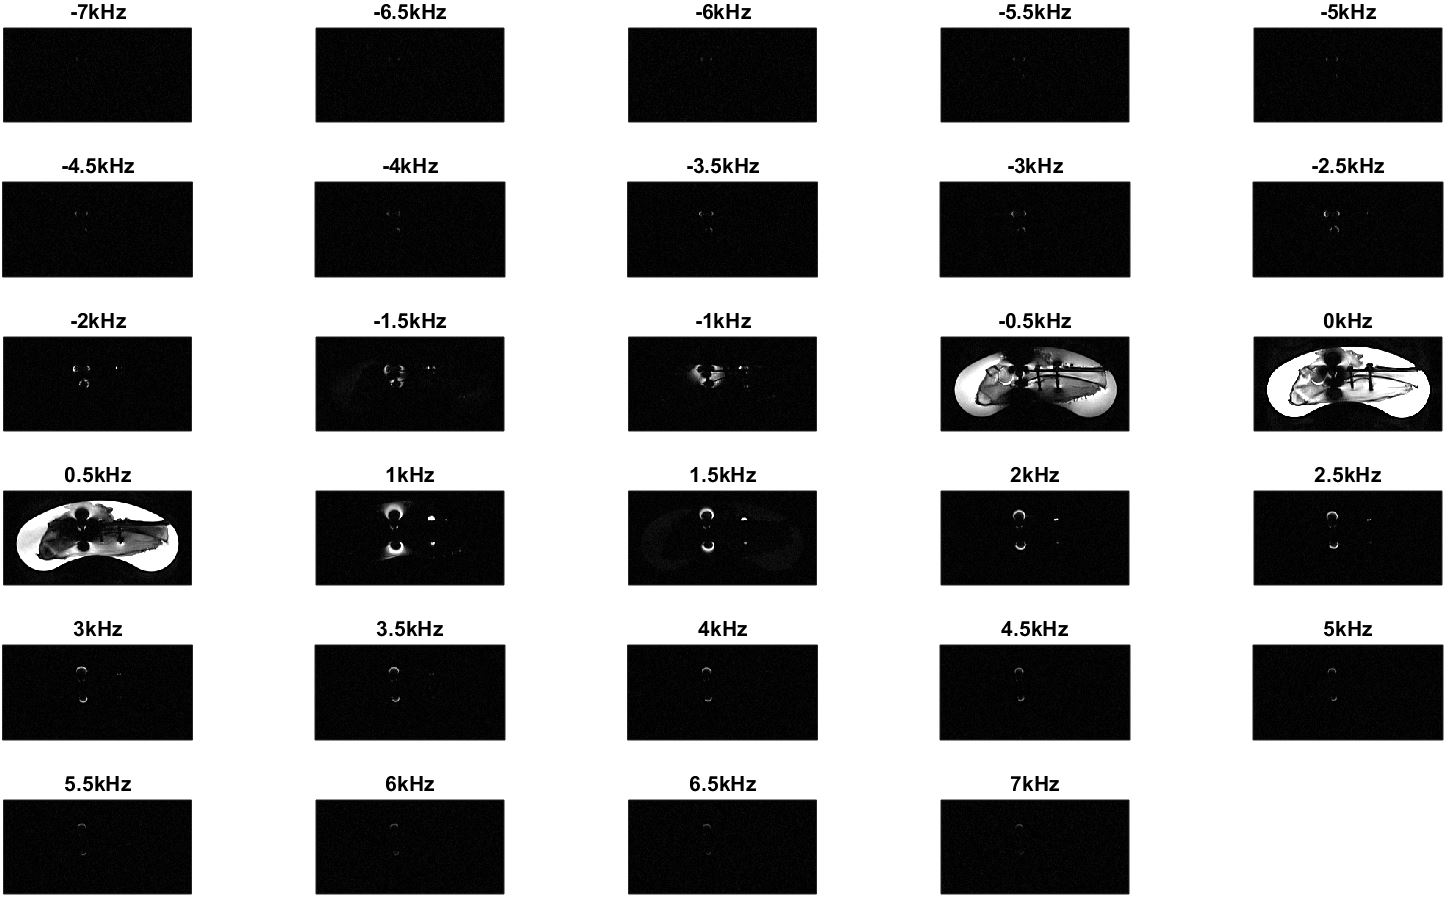
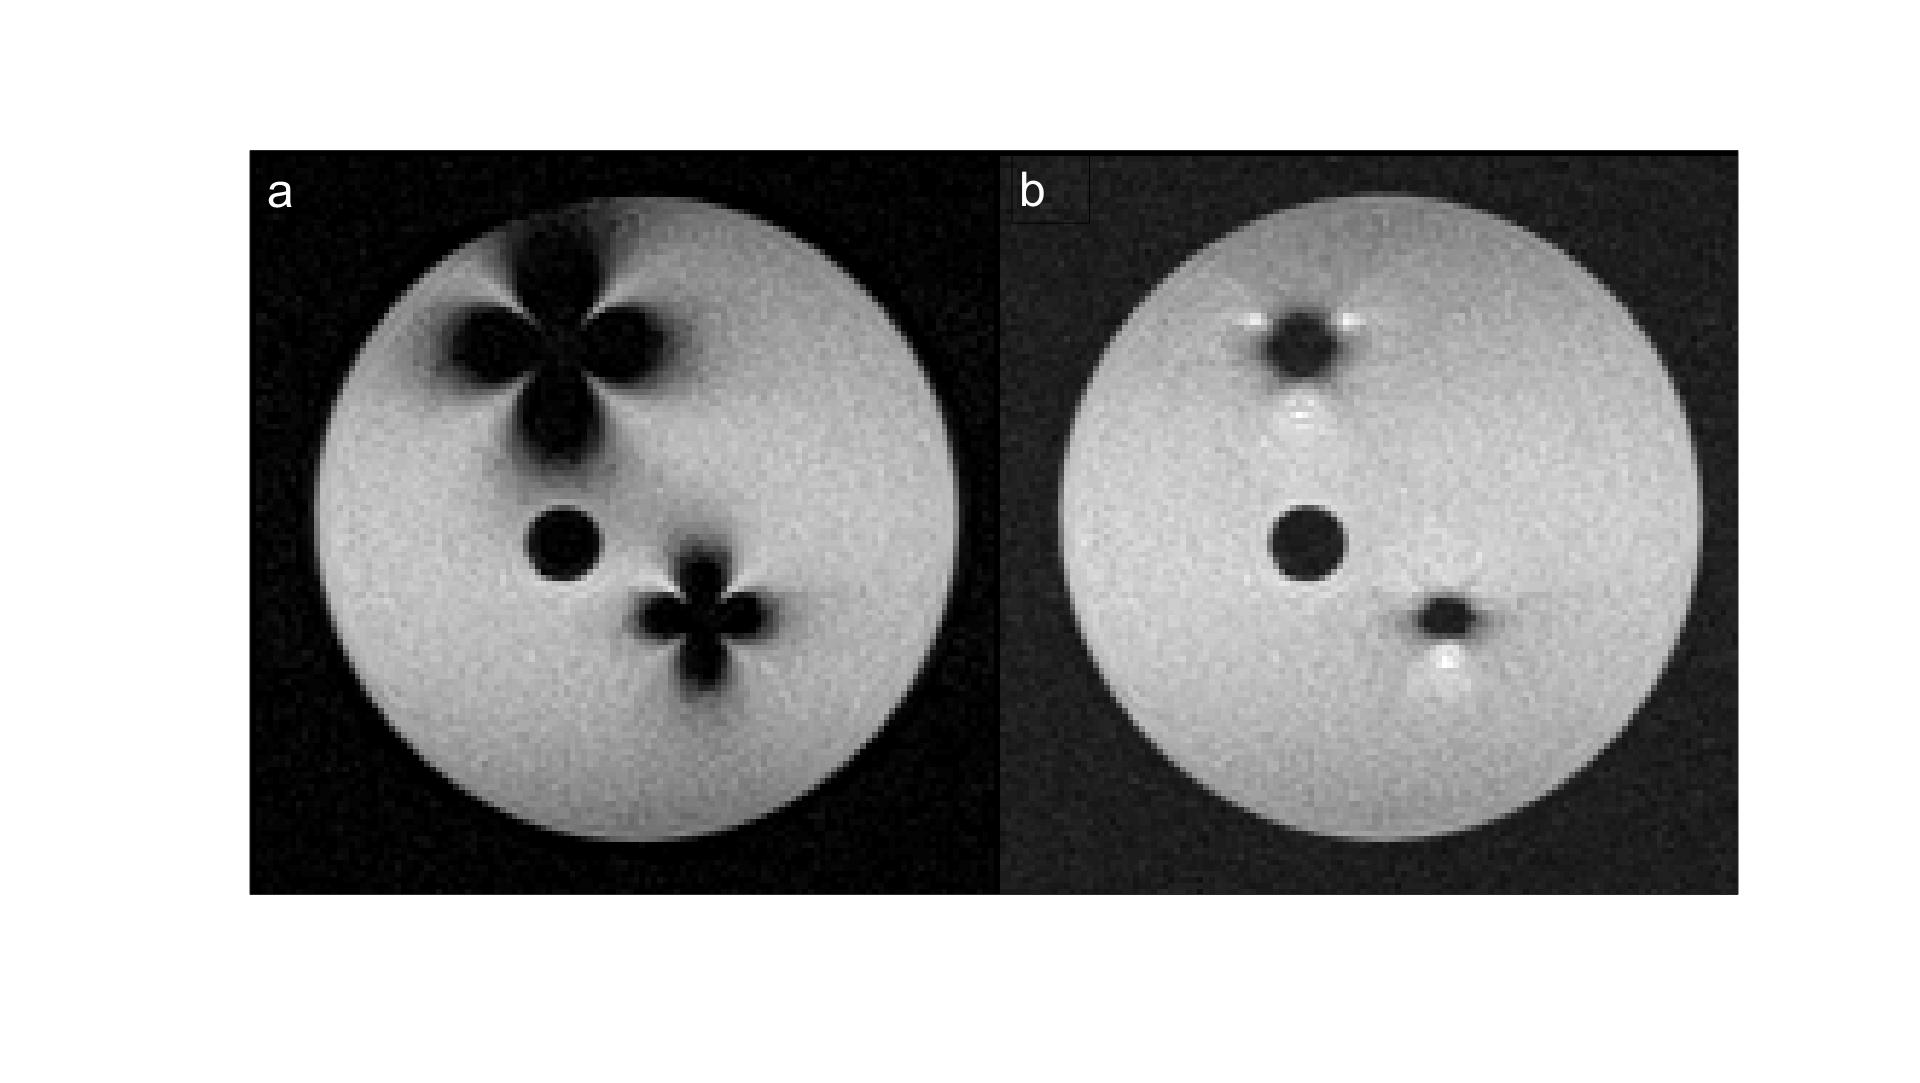
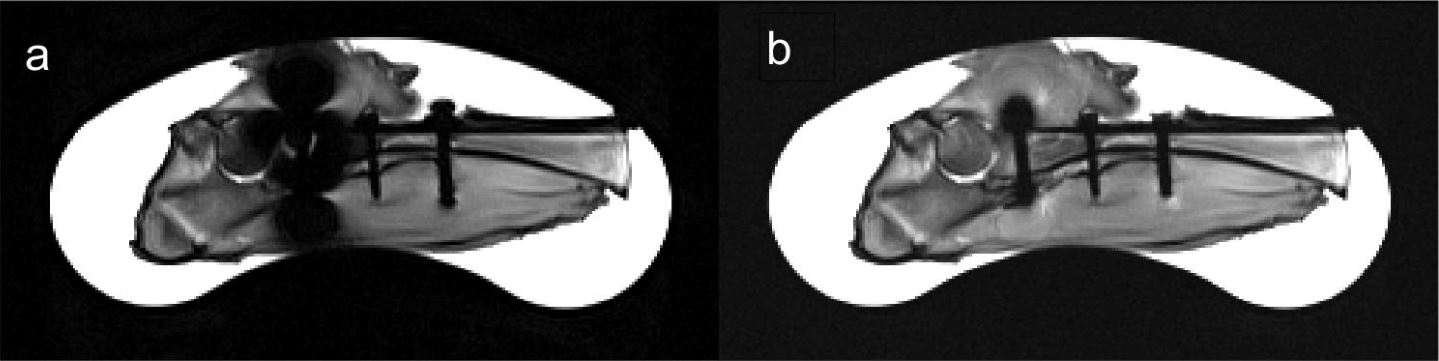
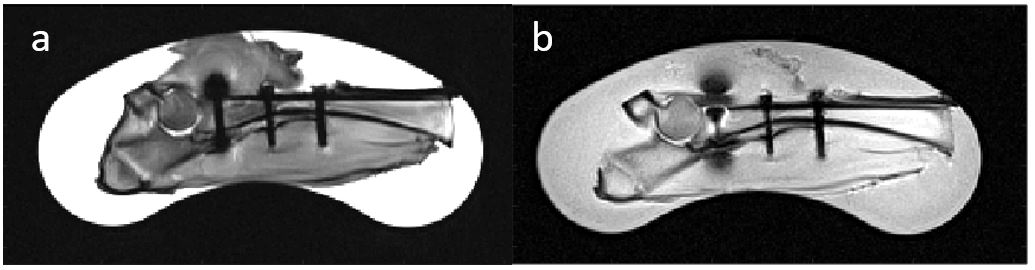
Figure 2 depicts the individual spectral-bin ex-vivo images spanning ± 7 kHz. Figure 3 shows a mid-coronal slice of the on-resonance image and the sum of squares composite image to demonstrate the relative size of the blowout caused by each metal. Figure 4a shows a mid-coronal slice from the on-resonance image (central frequency bin) showing large blow-outs near the stainless steel and the titanium screws, however since narrow RF BW was specifically chosen to limit frequency excitation, no distortion is visible in the image. Depicted in Figure 4b is the same mid-coronal slice of the composite image from the 29 images acquired at different frequency bins showing significant reduction in metal artifacts with desirable T2 contrast. Qualitatively, the artifacts originating from the titanium screw appear to be completely resolved. Figure 5 compares our composite image with one acquired using the standard 2D TSE-VAT image with the same imaging parameters.Discussion and Conclusion
Similar to MSI techniques based on 2D and 3D TSE sequences aforementioned here, the non-selective 3D multi-spectral variable flip-angle TSE sequence can substantially reduce metal artifacts with negligible ripples arising from the sum of squares combination. By application of non-selective hard RF pulses, a turbo factor higher than those typically used in MSI sequences is accomplished with short echo spacing. This can allow for a more efficient sampling scheme to prolong the signal at each excitation to achieve proper T2 weighting. Similar to other MSI sequences, the 3D multi-spectral variable flip-angle TSE is compatible with partial Fourier, parallel imaging, and in particular compressed sensing techniques given the sparsity of the off-resonance images as seen in Figure 2.Acknowledgements
This work was supported by the Virginia Biosciences Health Research Corporation and the Virginia Investment Fund.References
1. Koch KM et al., A Multispectral Three-Dimensional Acquisition Technique for Imaging Near Metal Implants, MRM 2009; 61: 381-390.
2. Lu W et al., SEMAC: Slice Encoding for Metal Artifact Correction in MRI, MRM 2009; 62(1): 66-76.
3. Koch Km et al., Imaging Near Metal with a MAVRIC-SEMAC Hybrid, MRM 2011; 65: 71-82. 4. Hargreaves BA et al., Accelerated Slice Encoding for Metal Artifact Correction, JMRI 2010; 31(4): 987-996.
5. Otazo R et al., Sparse-SEMAC: rapid and improved SEMAC metal implant imaging using SPARSE-SENSE acceleration, MRM 2018; 78(1): 79:87.
6. Smith MR et al., Accelerating Sequences in the Presence of Metal by Exploiting the Spatial Distribution of Off-Resonance, MRM 2014; 72(6): 1658–1667.
7. Quist B et al., Improved Field-Mapping and Artifact Correction in Multispectral Imaging, MRM 2017; 78(5): 2022–2034.
8. Mugler JP III et al., Practical Implementation of Optimized Tissue-Specific Prescribed Signal Evolutions for Improved Turbo-Spin-Echo Imaging, ISMRM 2003, p203;
Figures