3396
Noise Analysis for Simultaneous Transmission and Reception Enabled MRI Scanner1Department of Electrical and Electronics Engineering, Bilkent University, Ankara, Turkey, 2National Magnetic Resonance Research Center (UMRAM), Ankara, Turkey
Synopsis
In simultaneous transmission and reception (STAR), injection of noise and spurs stemming from transmit chain is a problem as well as the leak power. Investigation of noise and spurs are important in order to determine minimum necessary isolation to achieve similar noise levels compared to conventional imaging. Noise sources during STAR are investigated and compared with experiments. It has been shown that using an active cancellation method where dominant noise source is transmit chain, with combination of passive cancellation can reduce noise and spurs. Necessary isolation is shown to depend on input noise and total gain in transmit chain.
Introduction
In standard MRI, excitation and acquisition is interleaved which eliminates necessity of electrical isolation between receive and transmit coil. Ability of simultaneous transmission and reception (STAR) on the other hand, requires high isolation (>100 dB) due to small MR signal amplitude, but it has several benefits such as signal acquisition from short T2 materials and less RF power consumption1. However, this method introduces additional considerations that need to be taken care of, mostly originating from transmit interference to receive chain, such as dynamic range of receive chain, injected noise from transmit chain to receive chain and bandwidth of decoupling. Many works have been done to tackle some of these issues, particularly focused around active and passive cancellation of interference2,3. Although it is possible to reach isolation values more than 85 dB, this metric alone may not be the only factor that affects image quality. Previous studies so far have not investigated how much isolation is enough and what other parameters are of importance in order to get similar image quality and SNR as in conventional imaging. In this work, these considerations are analyzed with a high emphasis on noise, to determine necessary hardware specifications and parameters for a simultaneous transmit and receive enabled MRI scanner.Methods
System is modeled in terms of gain and noise, considering each part separately as drawn in Figure 1. 10 ms RF pulses with known amplitudes are applied and output is measured with scanner when different combinations of components are connected, in order to determine gain and noise contribution coming from each module. To demonstrate effect of transmit amplifier parameters on the noise, three different setups are used. First setup referenced as PA1, is a custom PLNA (GRF5020), second setup PA2 is the cascade of these two amplifiers and last setup PA3 is the system’s own amplifier(Analogic AN8135). Measured gains and noise contributions of these amplifiers, as well as the other components are given in Figure 2.Thermal noise is measured by setting RF input as 0 V and computing the Power Spectral Density (PSD) of the output. Measurements are compared with theoretical expectations calculated from the formula $$$P_{noise} (dBm/Hz) = -174 + G_{sys} + NF_{sys}$$$ . Output referred noise power ($$$Na$$$) of the each device is also calculated and used in power calculations. In addition to thermal noise, phase noise, non-linear distortions and spurs coming from transmit are also investigated4,5,6.
Signal/noise power is investigated with passive decoupling only and with the combination of passive and active decoupling. For active decoupling, recently proposed method7 is used. Sampling rate is 200 kHz and total acquisition time is 1.7 seconds. Receive chain noise figure is neglected since it is known to be small (~1 dB) and LNA noise figure will be the determining factor.
Results
A summary of experiments and associated thermal noise measurements with PA1 setup can be seen in Figure. 3. Minimum achievable noise power is calculated as -144 dBm/Hz, which is in agreement with experiment result in Figure 3.1. With the combination of active and passive cancellation, noise floor can be reduced down to the minimum achievable case.In Figure 4, effect of cancellation can be seen when RF power is present. It is clear from Figure 4.c., bandwidth of the cancellation plays an important role in determining imaging bandwidth in which there is no significant SNR loss. Bandwidth of the active cancellation and an image acquired within feasible bandwidth is given in Figure 5.
Discussion
Experiments show that when proposed active and passive cancellation combined, not only noise level is reduced, also non-linearities and spurs are eliminated, as long as the noise source is transmit chain. From these results, to determine how much decoupling is adequate, important parameter is the transmit gain, along with imaging bandwidth. To use a higher gain and noise figure amplifier, one must either increase isolation, or decrease imaging bandwidth, which has a similar effect due to band-stop filter nature of the active cancellation.Decrease in thermal noise level was not on par with decrease in leak signal, phase noise and spurs. One reason can be an external noise source stems from the transmit chain picked up by coil. Additional experiment suggests the presence of such a noise source, however investigation and elimination of the source requires further experiments.
It is possible to use commercial amplifiers bundled with MRI scanners for STAR, given that necessary isolation is achieved in the imaging band, to preserve SNR. For most cases, gain of amplifier is the dominant factor.
Considering most commercial amplifiers have more than 60dB gain, bandwidth limitation decreases available imaging bandwidth well below 70 kHz for our method. In this extent, increasing isolation bandwidth can be the next improvement.
Conclusion
It is shown that there is a trade-off between these four parameters; transmit amplifier gain, total isolation, isolation bandwidth and imaging bandwidth, to get the same SNR. As long as the transmit noise is eliminated in imaging band, remaining leak signal can be removed with digital subtraction. This trade-off holds for active cancellation, as long as the circuit itself does not generate significant noise and there is no independent noise source picked up by receiver.Acknowledgements
No acknowledgement found.References
1. D. J. Tyler, M. D. Robson, R. M. Henkelmann, I. R. Young, and G. M. Bydder, “Magnetic resonance imaging with ultrashort TE (UTE) PULSE sequences: Technical considerations,” J. Magn. Reson. Imaging, vol. 25, no. 2, pp. 279-289, Feb. 2007.
2. A. C. Özen, E. Atalar, J. G. Korvink, and M. Bock, “In vivo MRI with Concurrent Excitation and Acquisition using Automated Active Analog Cancellation,” p. 3.
3. S.-M. Sohn, J. T. Vaughan, R. L. Lagore, M. Garwood, and D. Idiyatullin, “In vivo MR imaging with simultaneous RF transmission and reception,” Magn Reson Med, vol. 76, no. 6, pp. 1932–1938, 2016.
4. C. D. Motchenbacher and J. A. Connelly, Low-Noise Electronic System Design. 1993.
5. J. Phillips and K. Kundert, “Noise in mixers, oscillators, samplers, and logic an introduction to cyclostationary noise,” in Proceedings of the IEEE 2000 Custom Integrated Circuits Conference (Cat. No.00CH37044), Orlando, FL, USA, 2000, pp. 431–438.
6. M. J. Flanagan and G. A. Zirnmerman, “Spur-Reduced Digital Sinusoid Synthesis,” p. 14, Nov. 1993.
7. Tasdelen, Bilal, et al. "Dynamic Decoupling for Simultaneous Transmission and Acquisition in MRI" Proc. Intl. Soc. Mag. Reson. Med. Vol. 27, 2019.
8. D. Idiyatullin, S. Suddarth, C. A. Corum, G. Adriany, and M. Garwood, “Continuous SWIFT,” Journal of Magnetic Resonance, vol. 220, pp. 26–31, Jul. 2012.
Figures

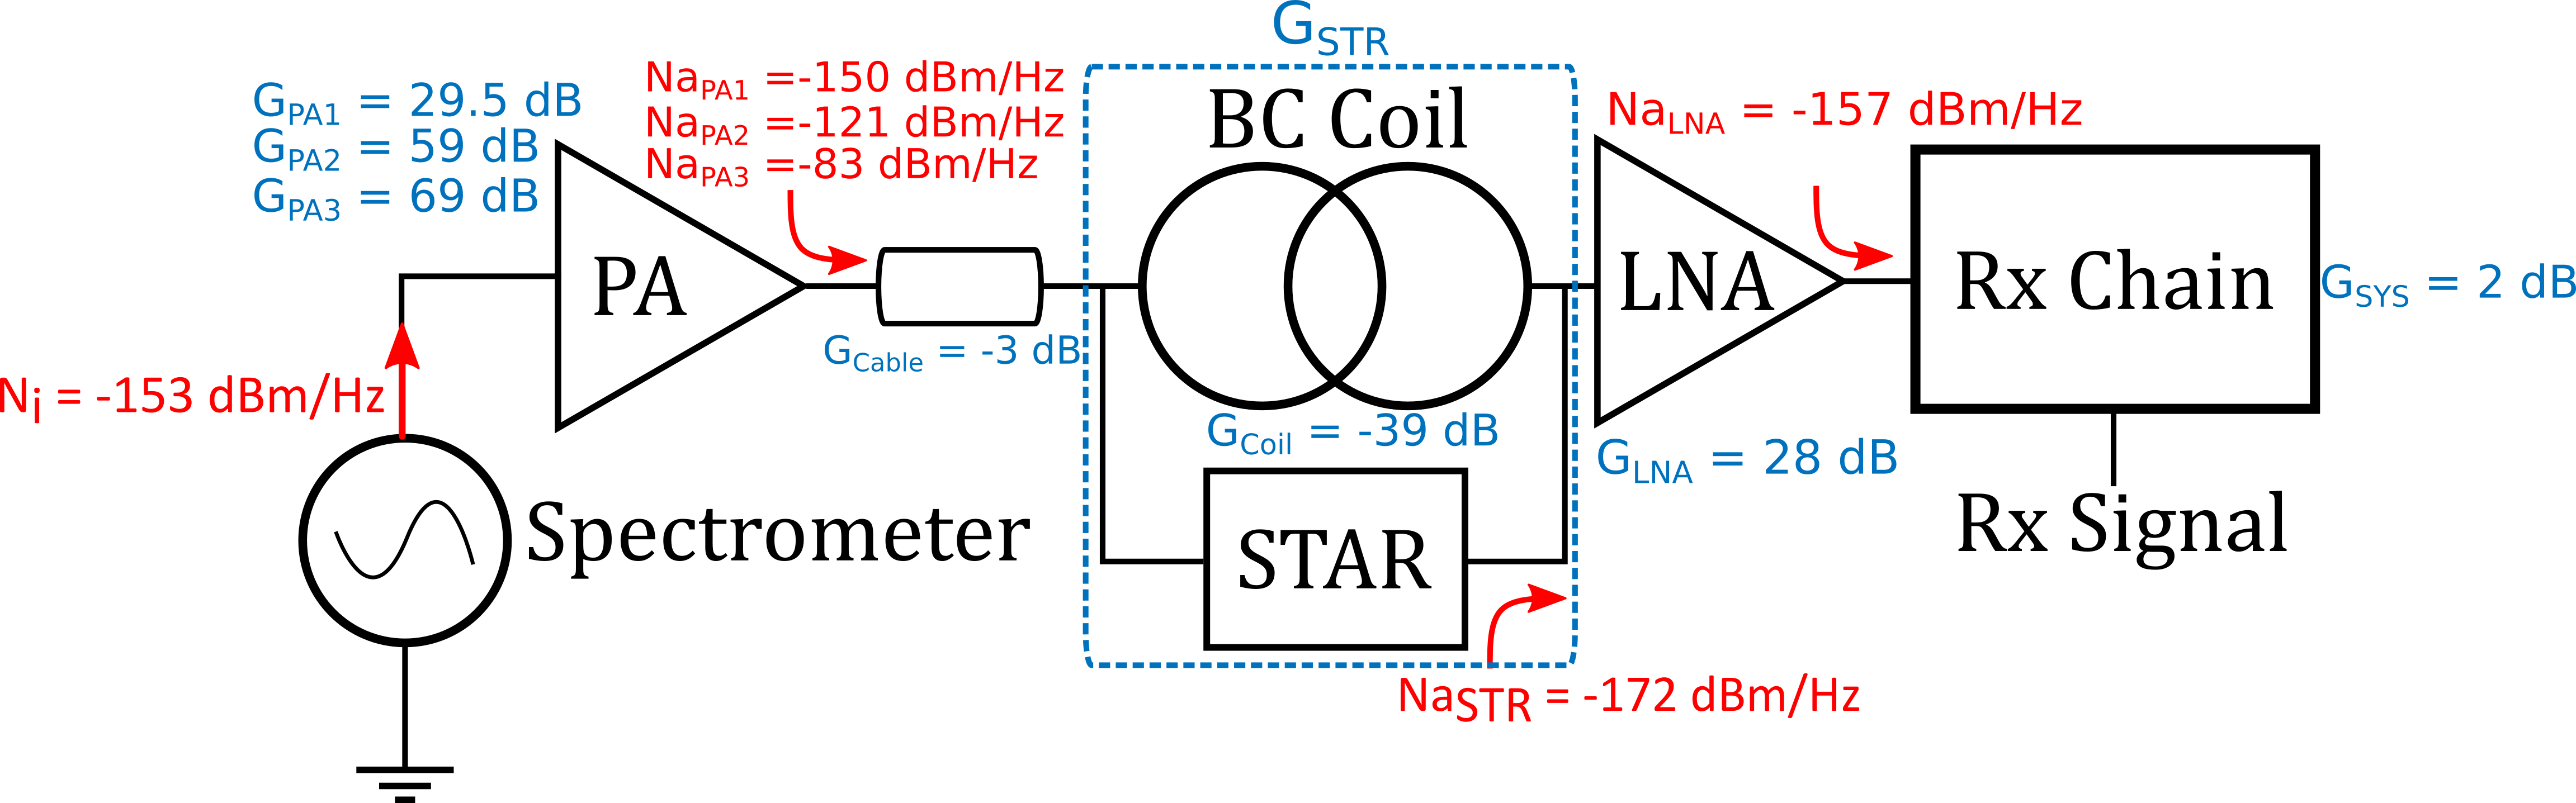
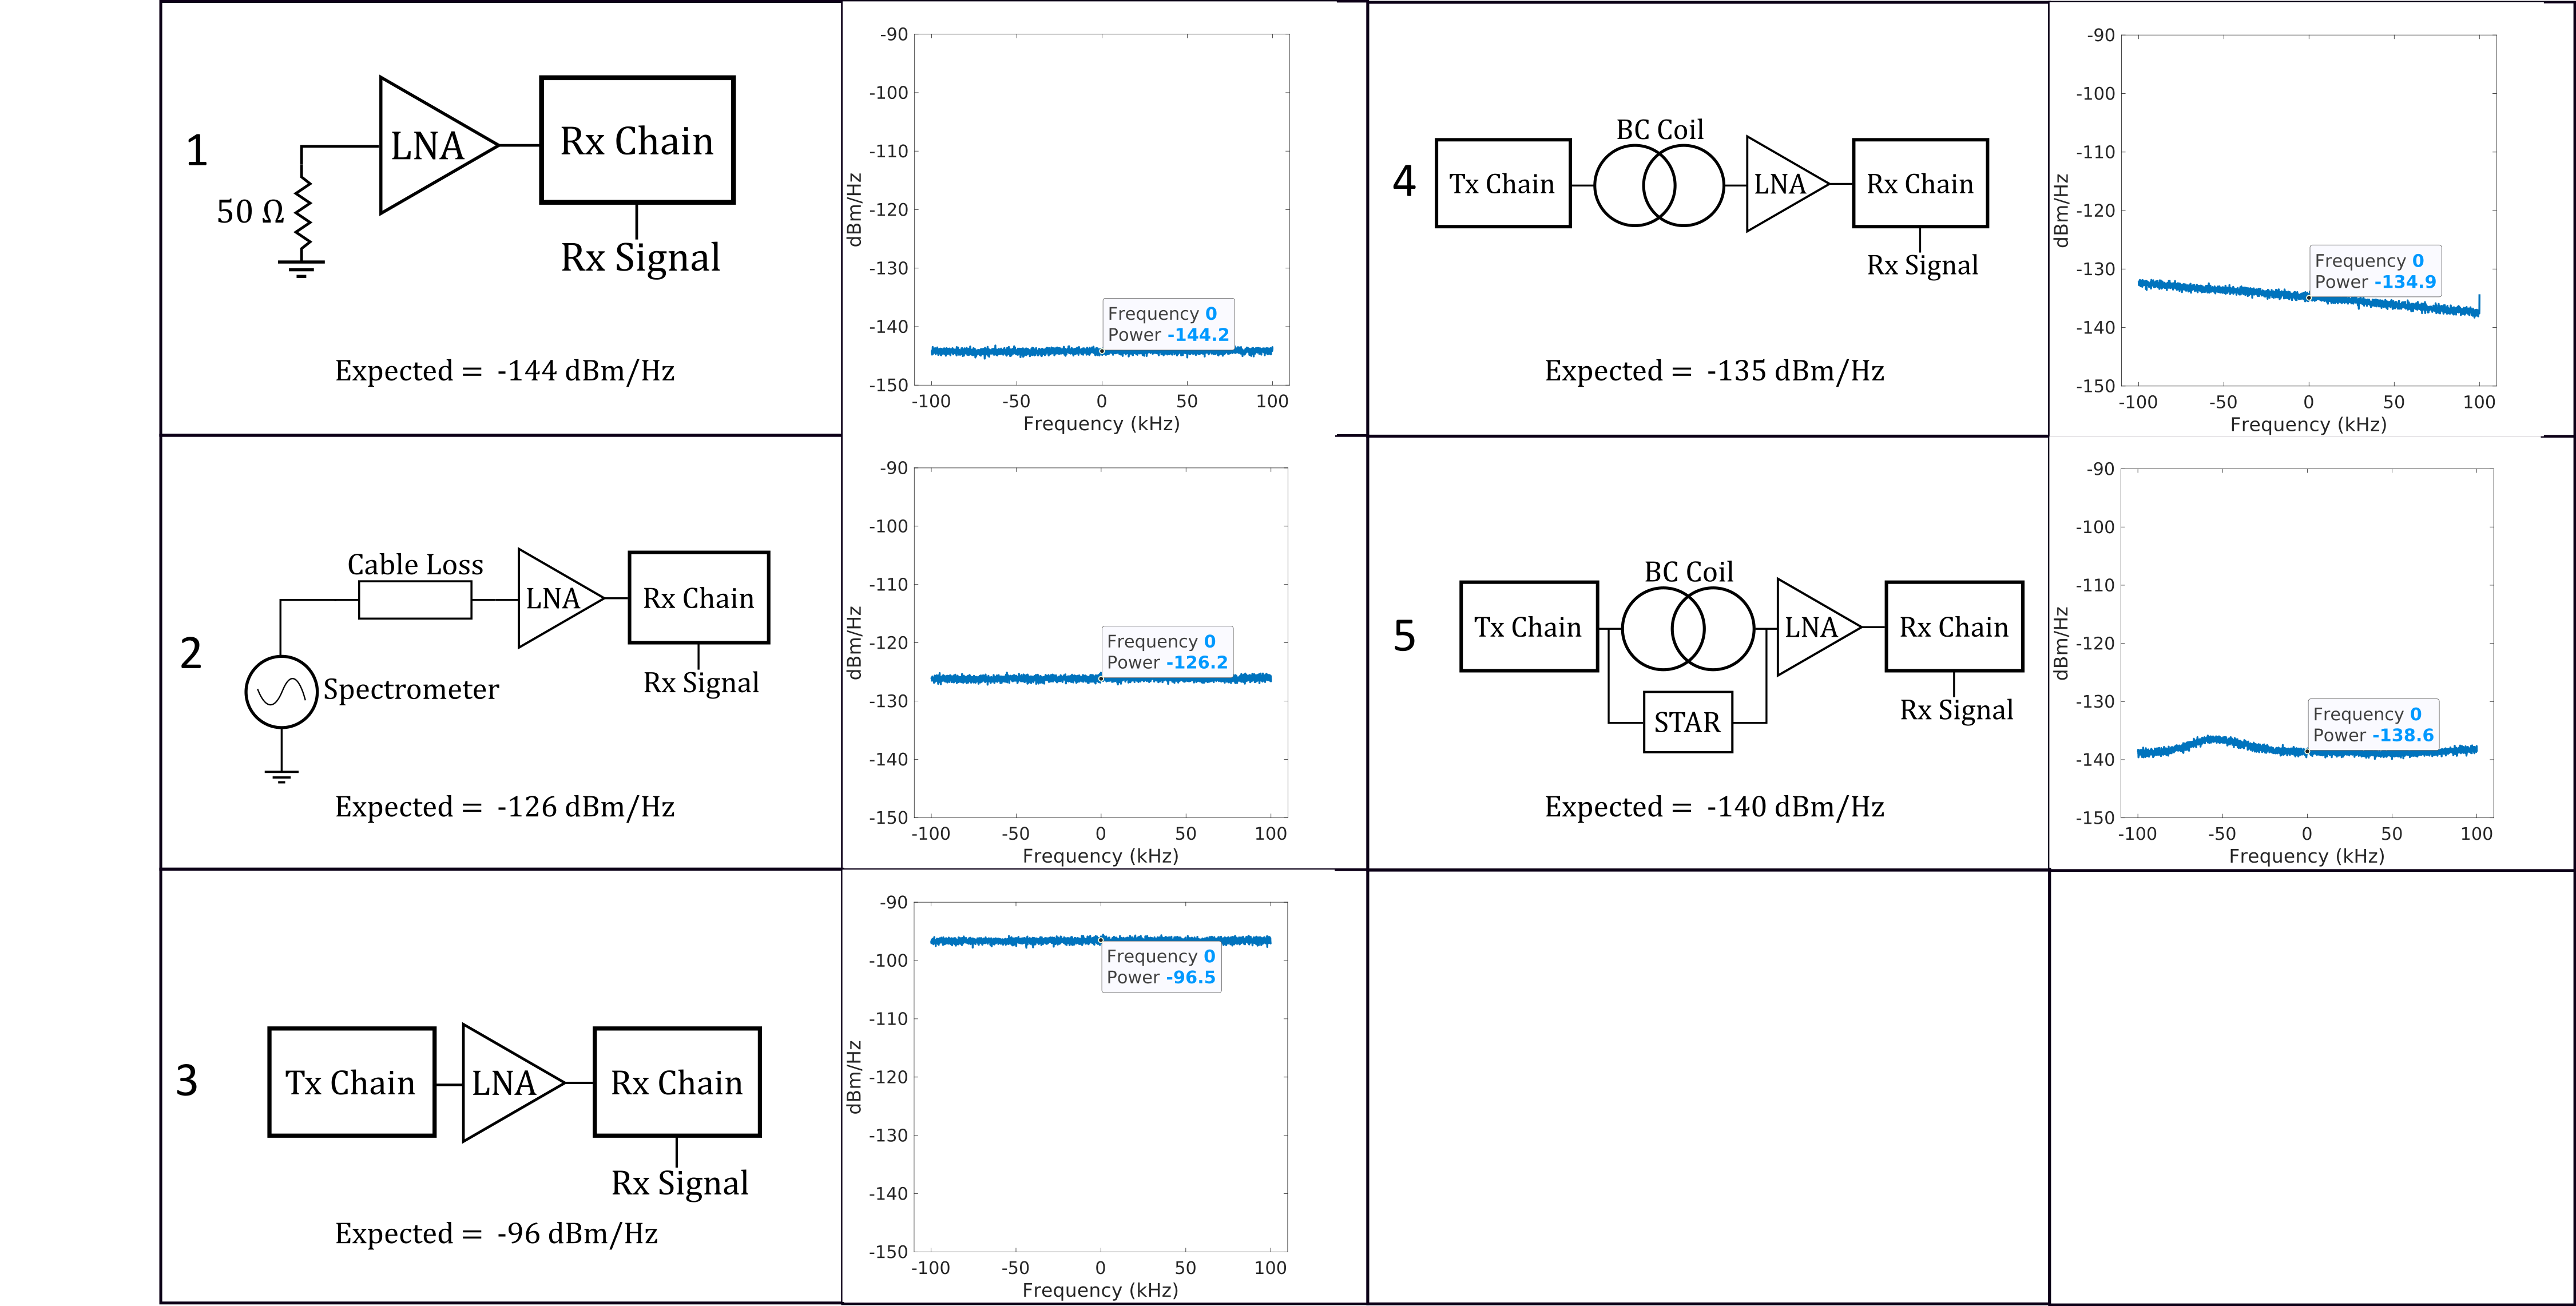
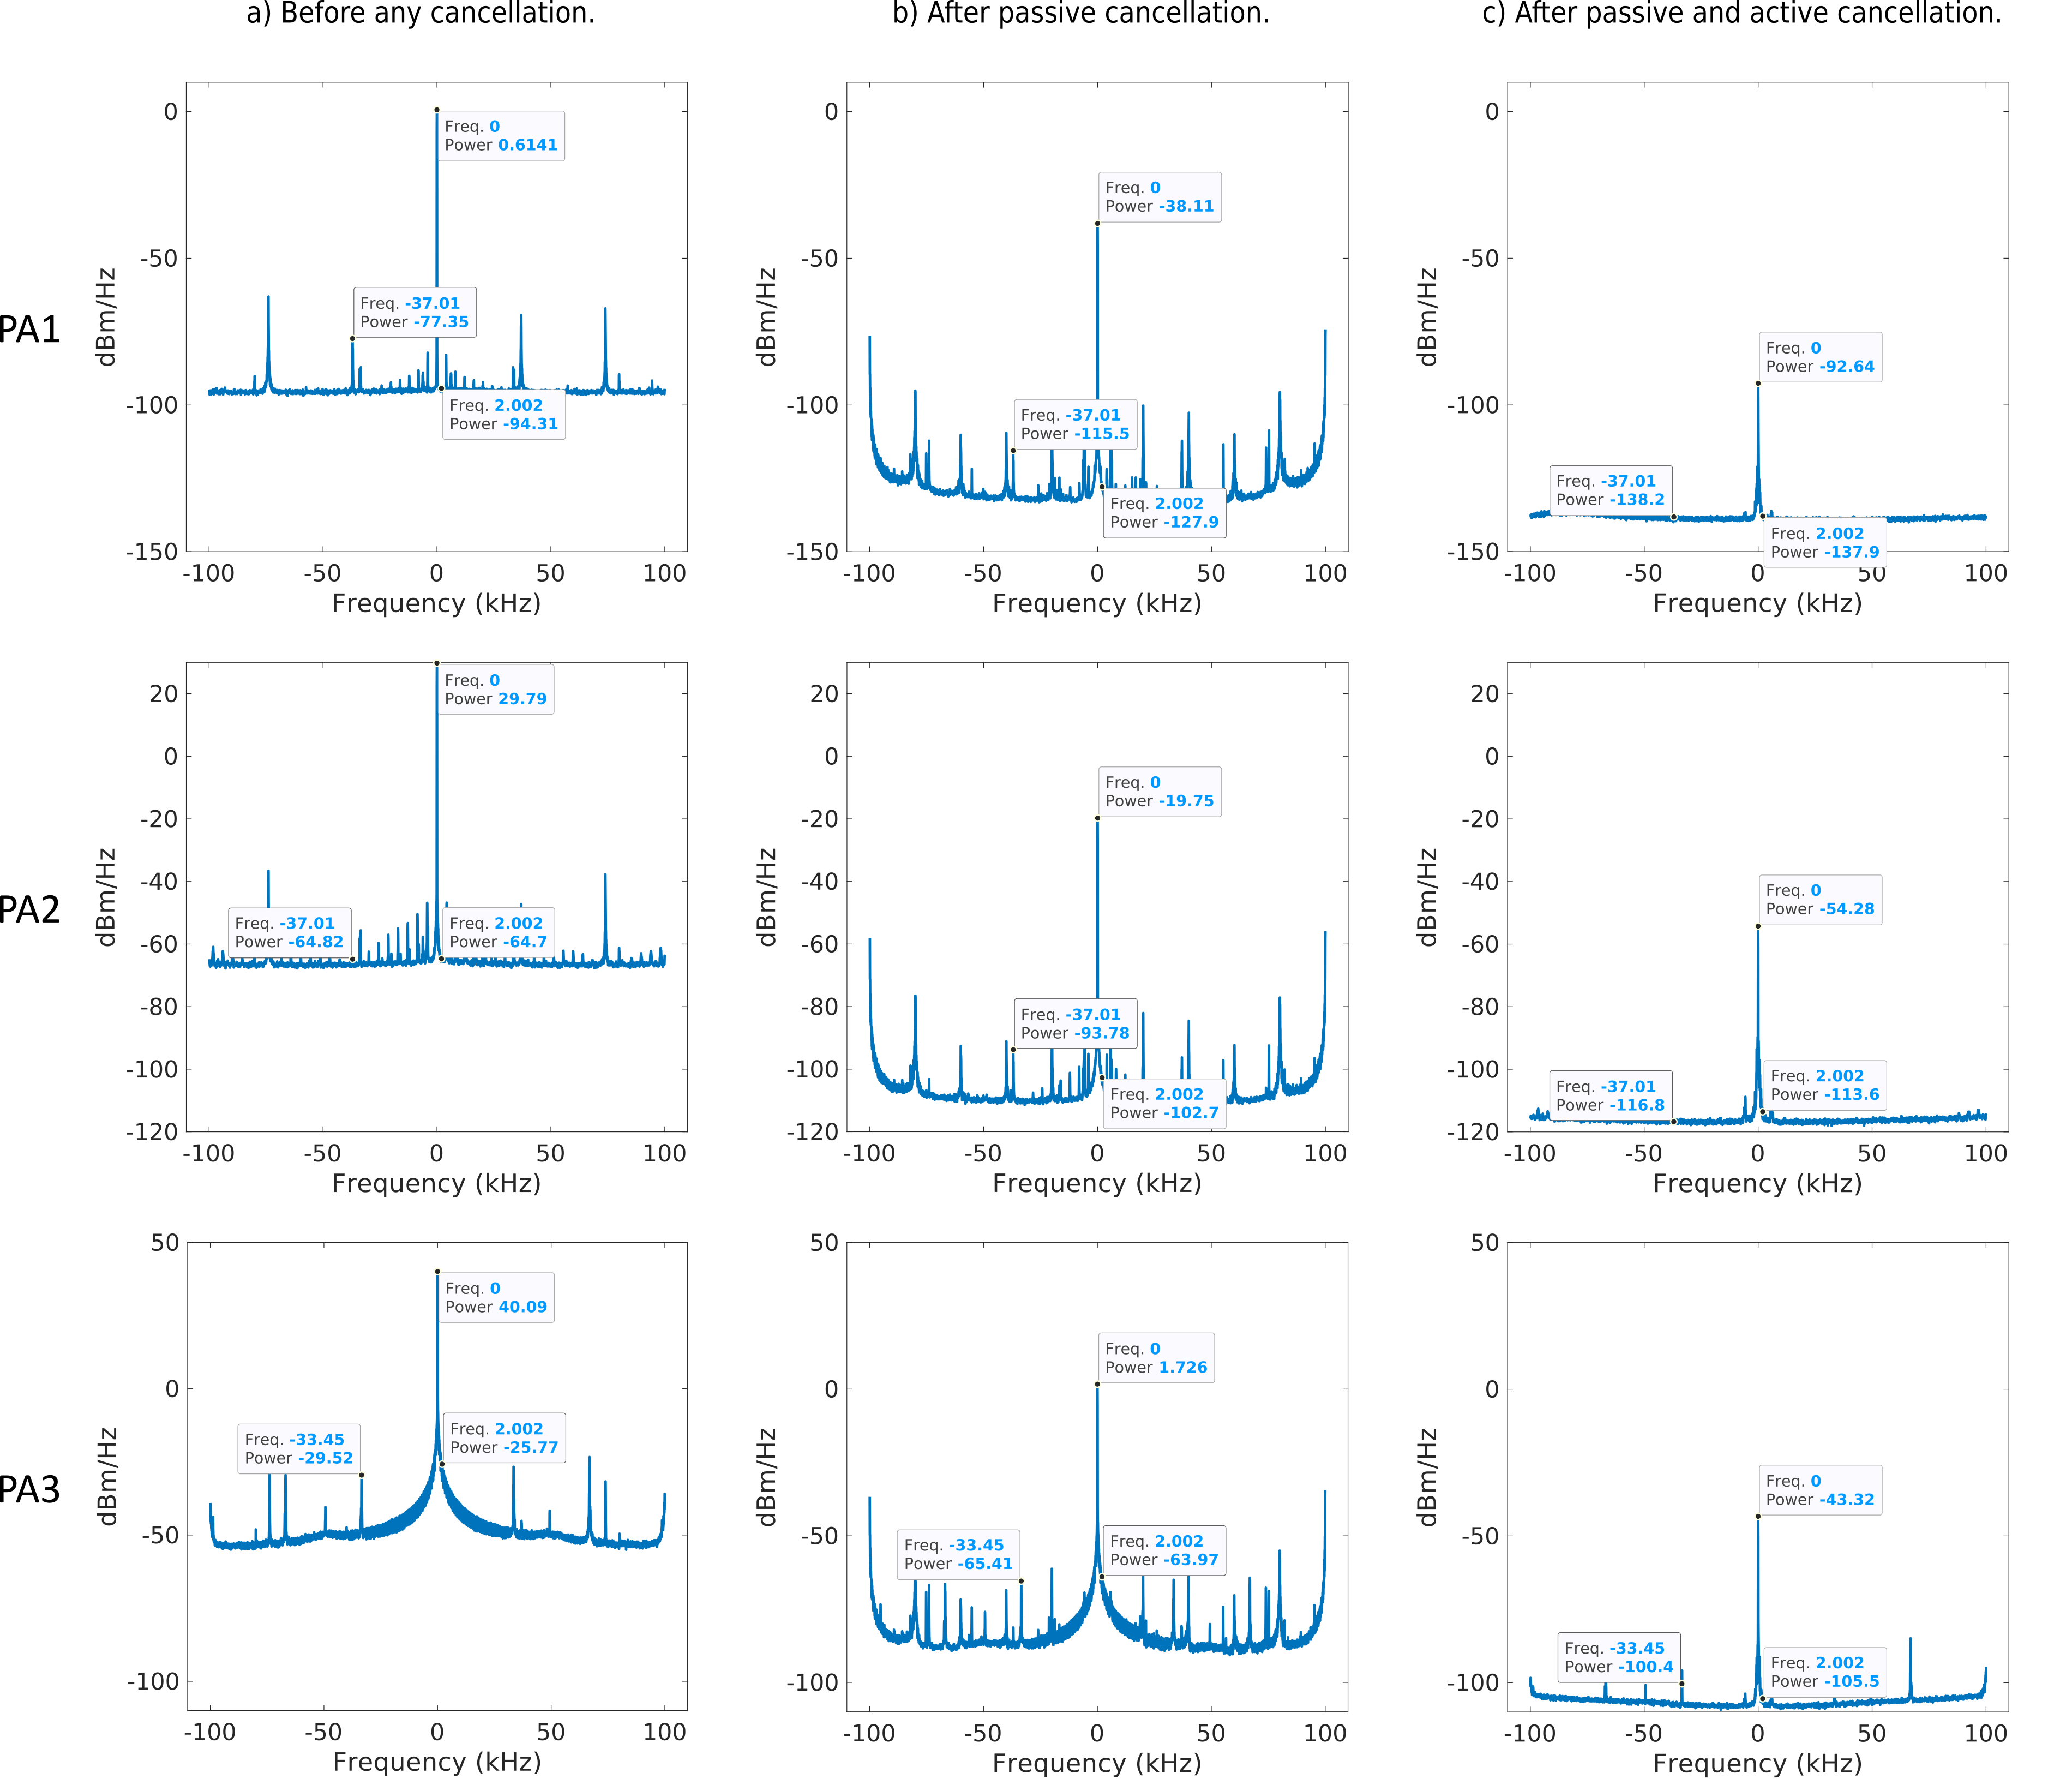
Figure 4 Effect of cancellation on PSD in the presence of RF. (a) Without cancellation, high noise power and spur power are observed. (b) Passive isolation of the coil decreased the thermal noise level and spurs. (c) With the combination of active and passive cancellation, most of the noise and spurs coming from transmit are diminished. Even when the noise level is not reduced down to minimum achievable case, spectrum is substantially cleaned off spurs that would create image artifacts.
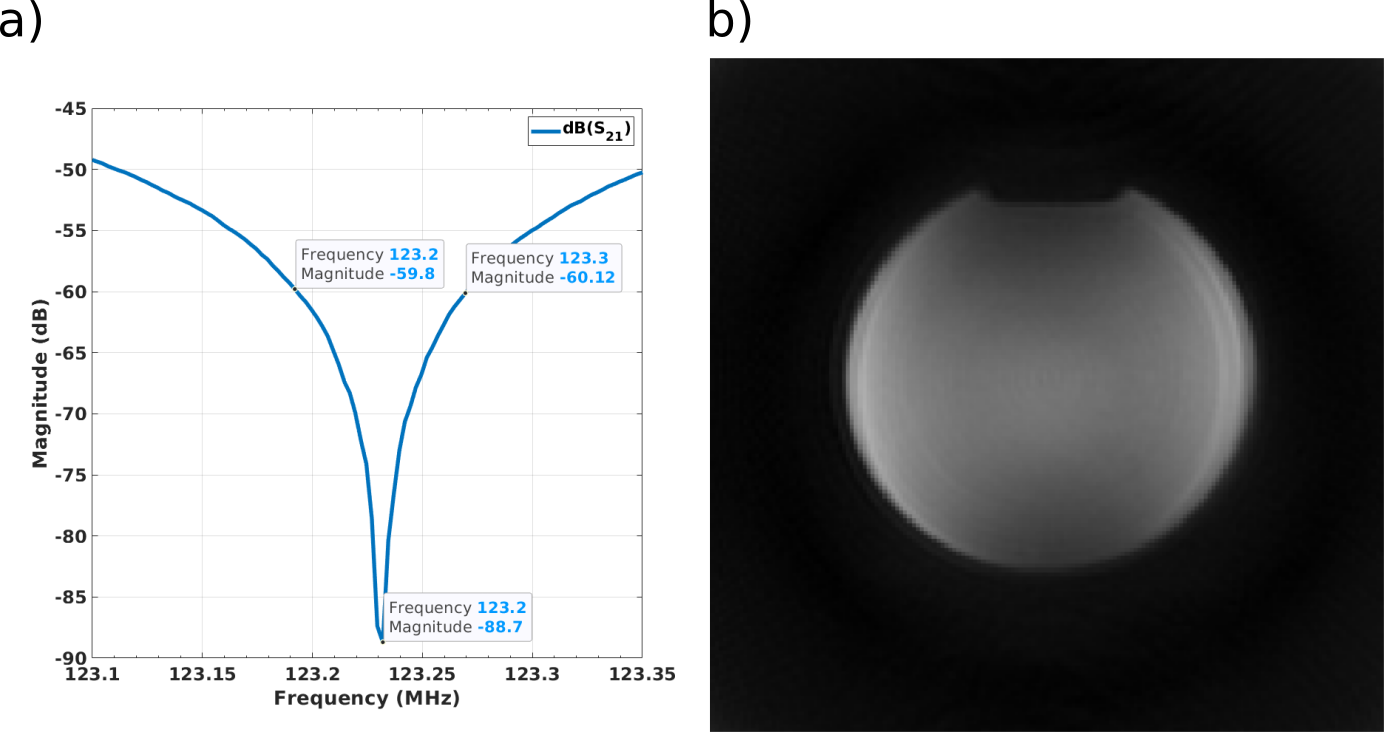
Figure 5 Frequency response of STAR circuit and acquired image within -85 dB bandwidth. (a) Isolation drops to 80 dB in less than 7 kHz and to 60 dB in less than 77 kHz. Note that to get rid of additive noises from PA2 and PA3, more than 60 dB and 90 dB isolation is required respectively. (b) A slice of 3D, 32768 spoke cSWIFT8 image acquired with PA1. Acquisition bandwidth is 2.5 kHz. Reconstruction is done using gridding and backprojection methods. Image shows high SNR and is free from artifacts that might arise from spurs. No digital subtraction is used for post-processing.