3381
Filter-pipeline based algorithm to find the AIF in DCE-MRI images for perfusion calculation of rectal cancer.1Computer Assisted Clinical Medicine, Mannheim Institute for Intelligent Systems in Medicine, Medical Faculty Mannheim, Heidelberg University, Mannheim, Germany, 2Institute of Clinical Radiology and Nuclear Medicine, Medical Faculty Mannheim, Heidelberg University, Mannheim, Germany
Synopsis
Perfusion calculation is highly dependent on the expertise and input of the physician and therefore reproduction of the results is difficult. A filter pipeline based algorithm for selecting the AIF ROI was implemented and evaluated. Our results show that such an algorithm can be used to determine the AIF ROI for perfusion calculation in dynamic contrast enhanced MRI images with a high accuracy. A fully automatic and deterministic algorithm removes the need for manual interaction and standardizes clinical perfusion measurements while simultaneously reducing the time requirement for the ROI determination by 86%.
Introduction
Quantitative perfusion imaging plays an important role in assessing the result of a tumor treatment [1]. However, models describing haemodynamic parameters depend on annotations of the tumor-supplying main artery (i.e. the arterial input function) and the tumor [2]. In the current clinical practice, the radiologist annotates the structures manually, but manual annotations are known to suffer from high intra- and inter-user variability. Additionally, the arteries and tumors are often only annotated on a single slice and the AIF is selected uninformed either from the left or right iliac artery [2] to save time. Therefore, the results of a perfusion calculation are hard to reproduce [3]. An algorithmic and deterministic approach would remove the human variance and improve the comparability of perfusion parameters.Materials and Methods
In this retrospective study 40 patiens with colorectal cancer were included. All patients received a DCE-MRI at 3T-(Magnetom Trio or Magnetom Skyra, Siemens Healthineers, Erlangen, Germany)[2]. DCE-MRI was performed using a TWIST sequence with parameters TR/TE/FA = 3.6 ms/1.44 ms/15°, matrix size = 192 × 144, FOV = 260 × 158 mm², slice thickness = 3.6 mm and parallel imaging with a GRAPPA factor of 2.All images were acquired in transversal orientation. 3–18 ml (0.1 to 0.15 ml per kg body weight) of agadolinium-based contrast agent (CA) (Dotarem, Guerbet, France or Gadovist, Schering AG, Germany) followed by 40 ml saline were administered intravenously with a flow velocity of 1.5 ml/s.The tumor and both arteries were manually segmegmented in 3D and in consensus with an experienced radiologist. Tumor segmentation took 5 minutes on average while for each artery the annotation required 2.5 minutes.
For the algorithm we defined several criteria. It should be deterministic and find both iliac arteries, but not small branches. Furthermore, arteries are considered as tubes that stretch through the whole image volume along the longitudinal axis. Therefore, arteries have a circular shape on axial planes.
For arteries their blood flow and the physiological properties are known [5]. The concentration of tracer agent in the blood and the measured intensity over time are similar to a gamma variate function. A steep increase is followed by a slower fall. Lastly, the tracer agent will appear in the arteries first, so the first increase in intensity marks the time point when the tracer agent arrives in the artery.
Based on these properties we developed several filter steps for a filter pipeline:
1. Selection of the 1% of the brightest voxel in the first 15 time points.
2. Performance of the morphological operation binary opening.
3. Search for the time step with the most peaks in intensity.
4. Check all remaining structures, if they have a circular shape on the axial plane, which forms a tube in the longitudinal direction.
5. Search for the time step with the most peaks, again. Then the time point is compared with the one found in the third step. The earliest of the two time point is selected, but only if it is after the 5th time step.
6. Fit of the gamma variate function separately for the average intensity curves of every structure. The upper and lower bounds for the parameter α are taken from Zhu et al. [6]
$$α_{lower} = \frac{\log{ \frac{c(t_{last})}{c(t_{peak})}}}{1 + \log{ \frac{t_{last}-t_{0}}{t_{peak}-t_{0}} } - \frac{t_{last}-t_{0}}{t_{peak}-t_{0}} }$$
$$α_{upper} = t_{peak}-t_{0}$$
7. Use of the morphological operations erosion and dilation to remove small structures.
8. Region growing on every structure to refine the boundaries.
9. Selection of the biggest structure on the right side and left side. This is the ROI for the AIF.
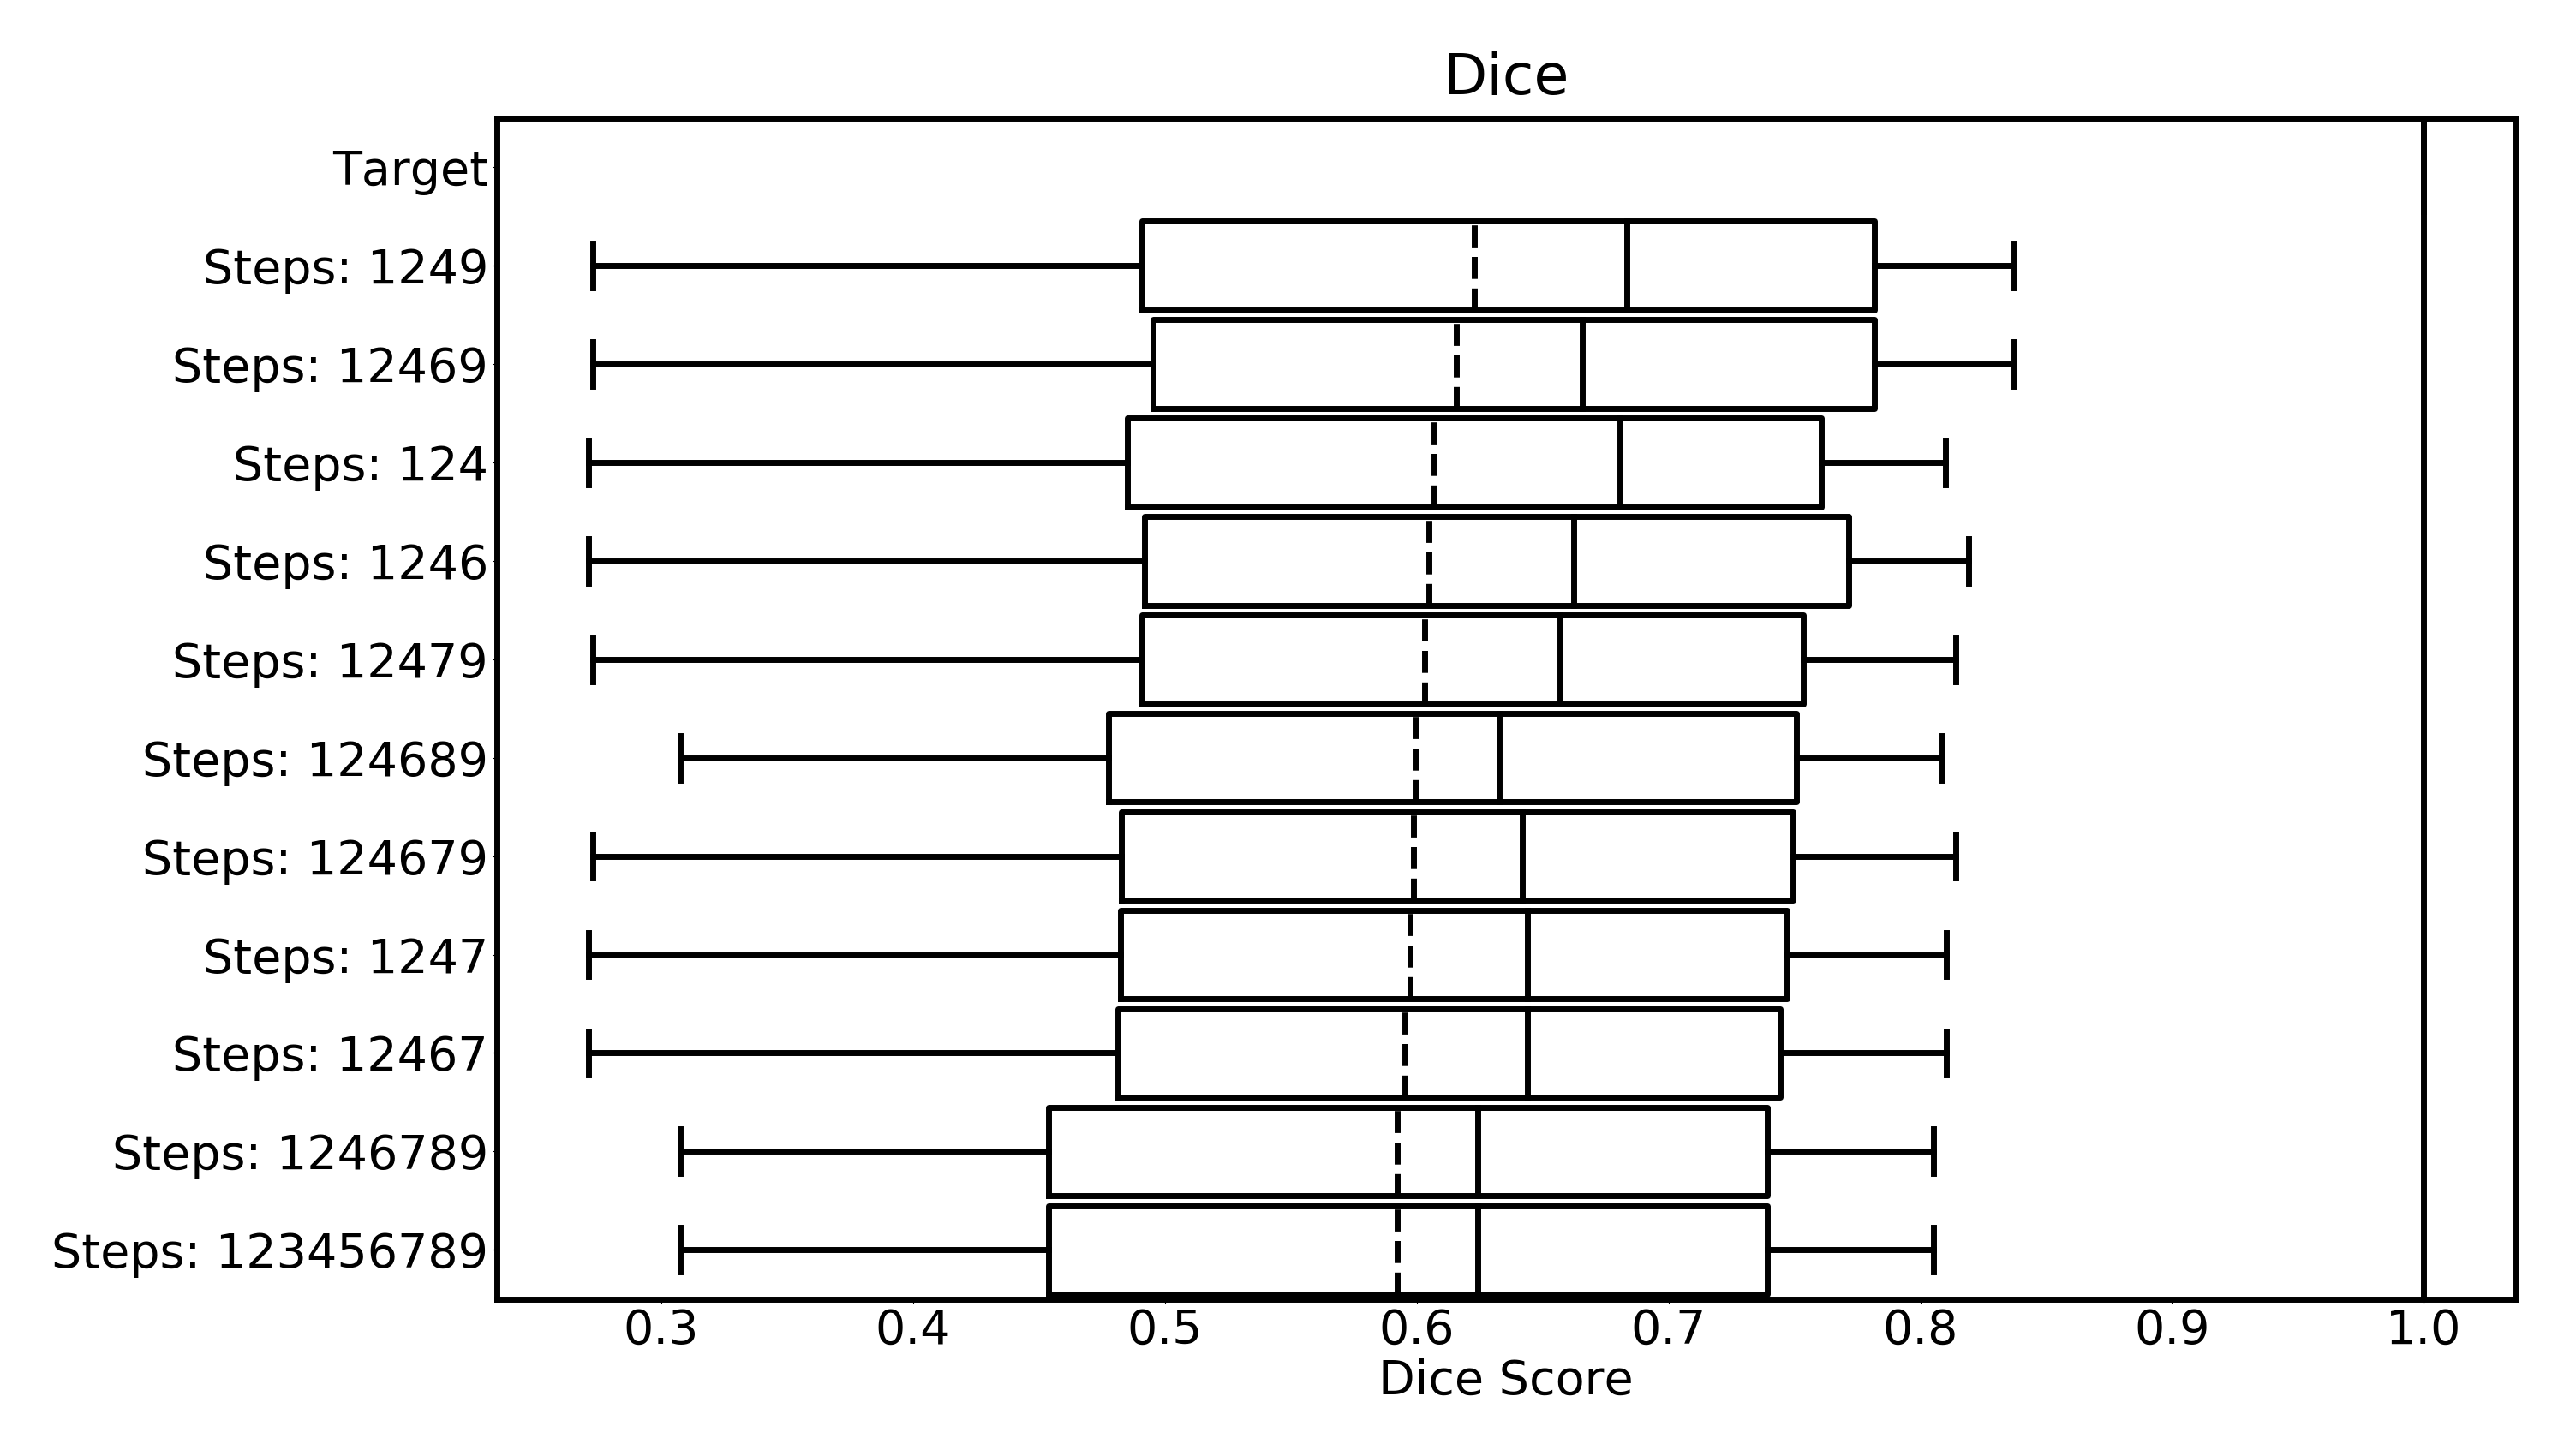
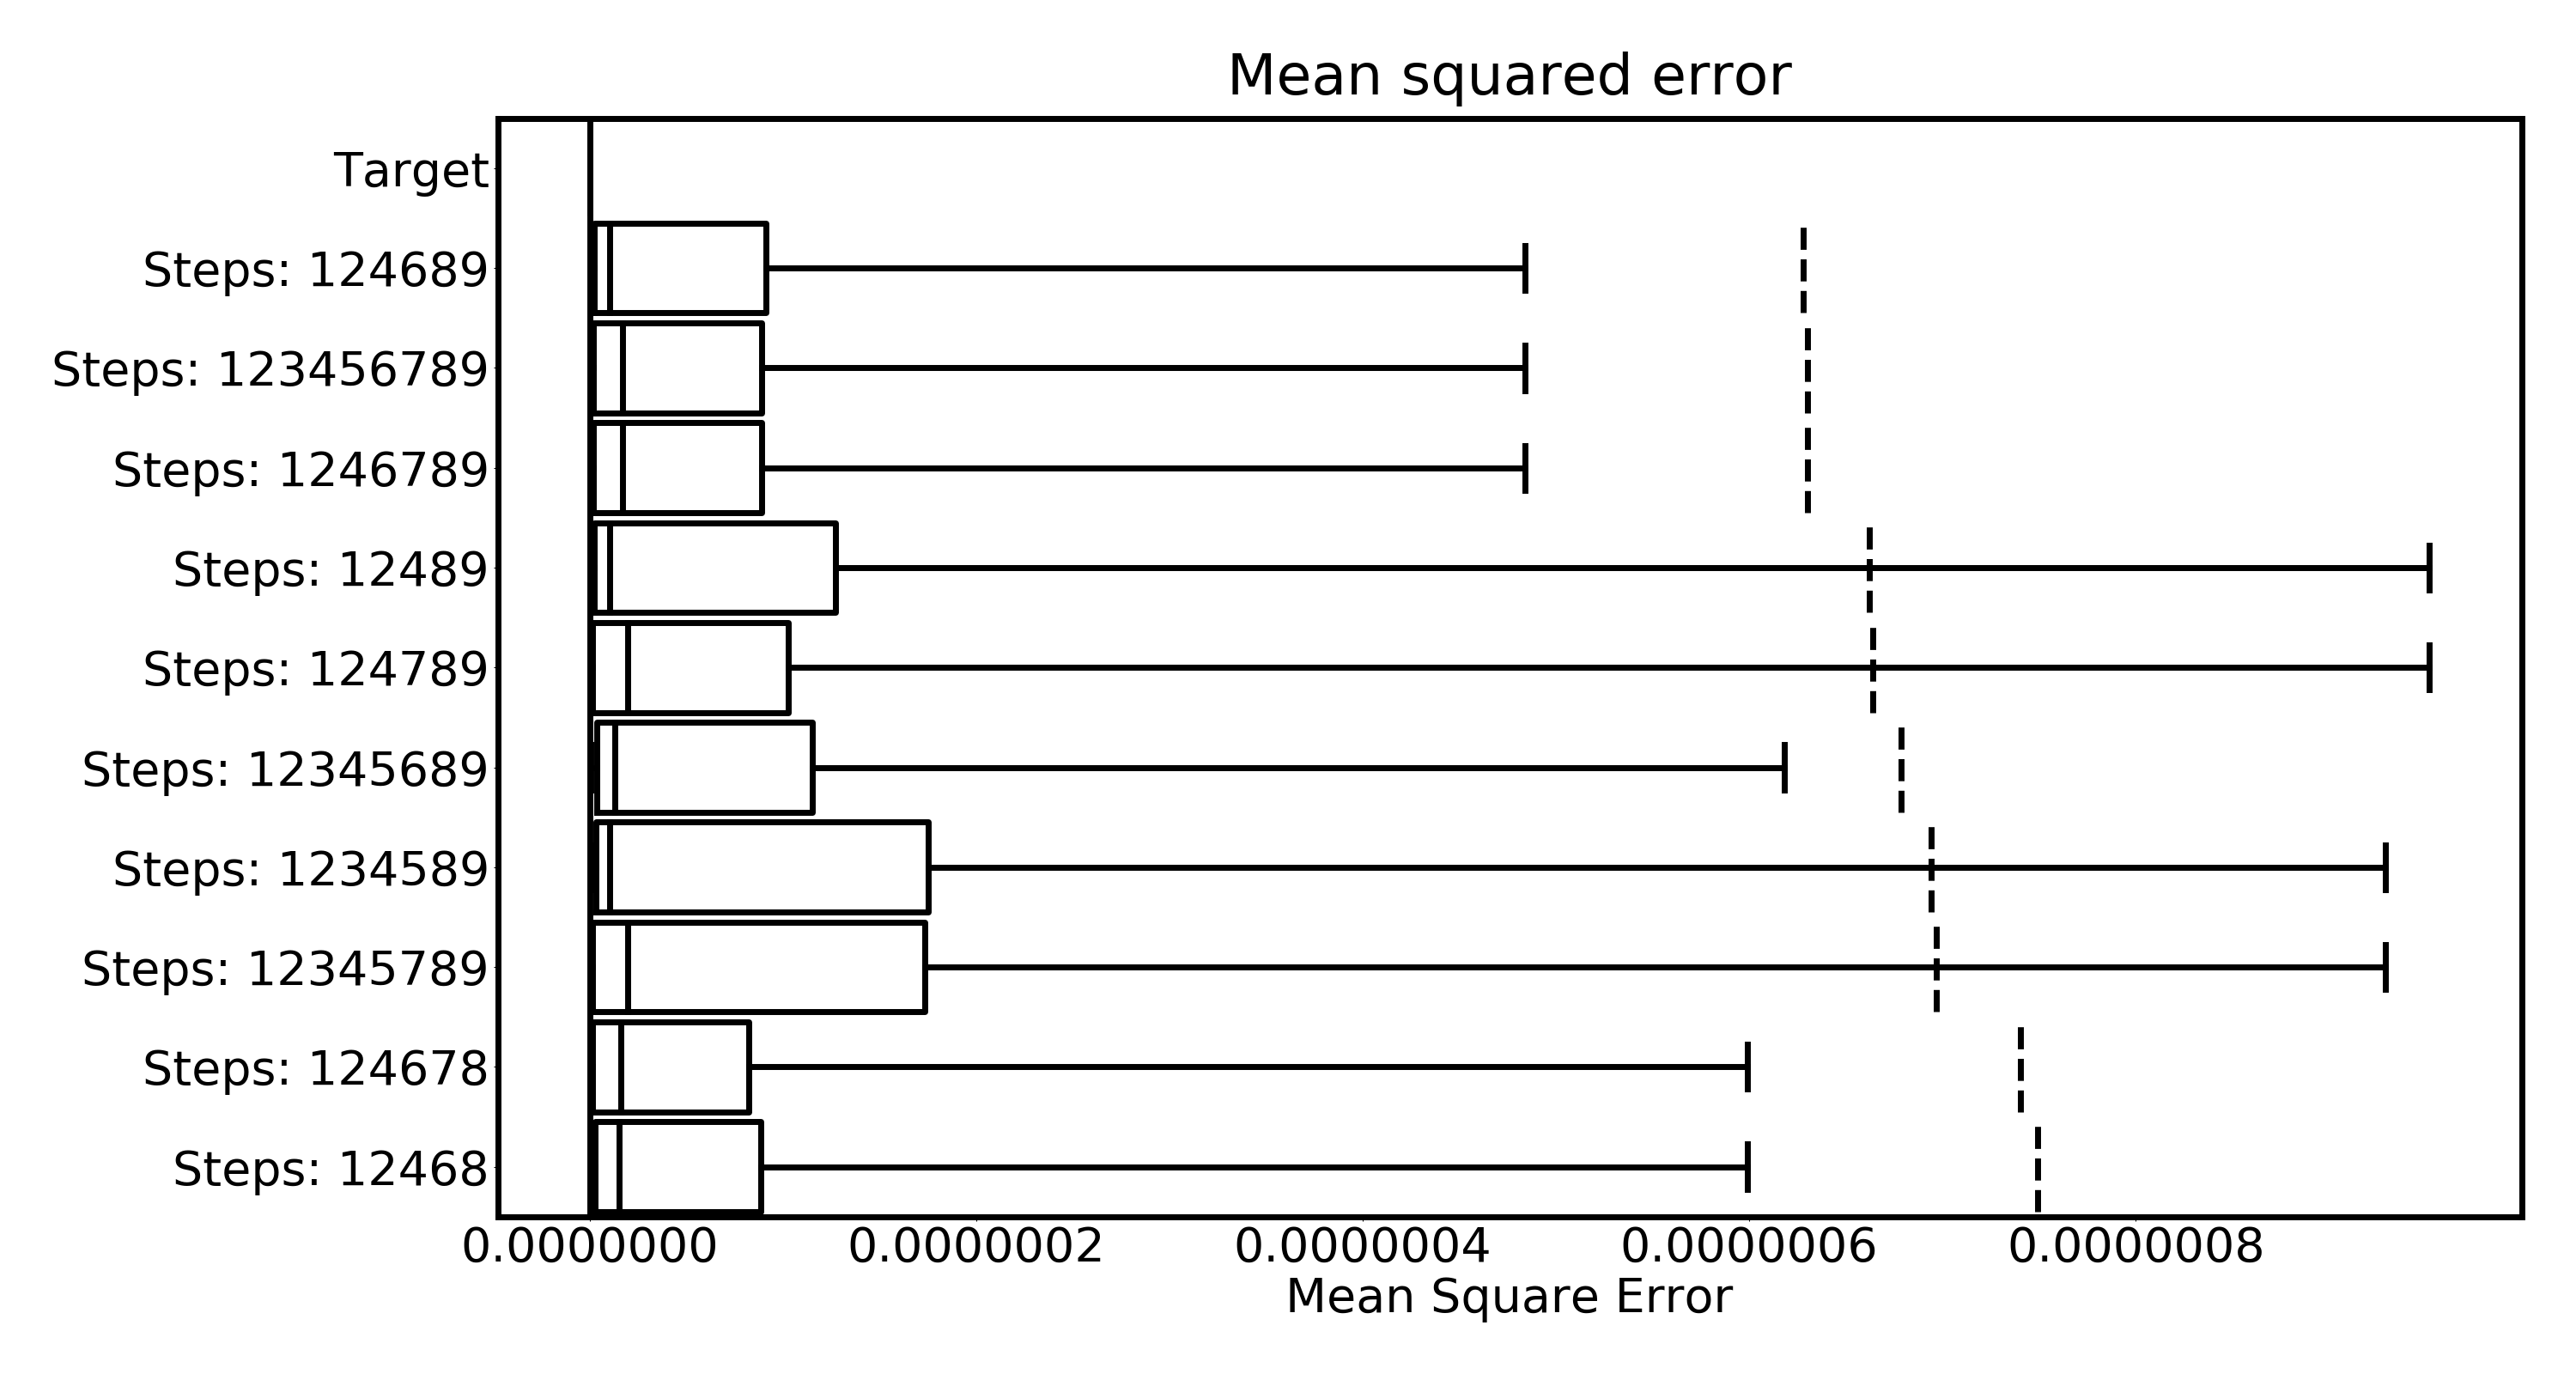
To further optimize our algorithm every combination, but not permutation, of above steps was evaluated to select those contributing most towards automated AIF segmentation. Metrics for the evaluation were the Sørensen-Dice Coefficient to compare the AIF ROI to the manual annotation and the mean squared error sum for comparing the mean AIF curve derived from the AIF ROI and segmentation respectively.
Results
Figure 1 shows the ten best combinations concerning the Dice-Coefficients and Figure 2 shows the top ten combinations when considering the mean squared error.Only three combinations are in both top ten lists. These are:
{124689}, {1246789}, {123456789}
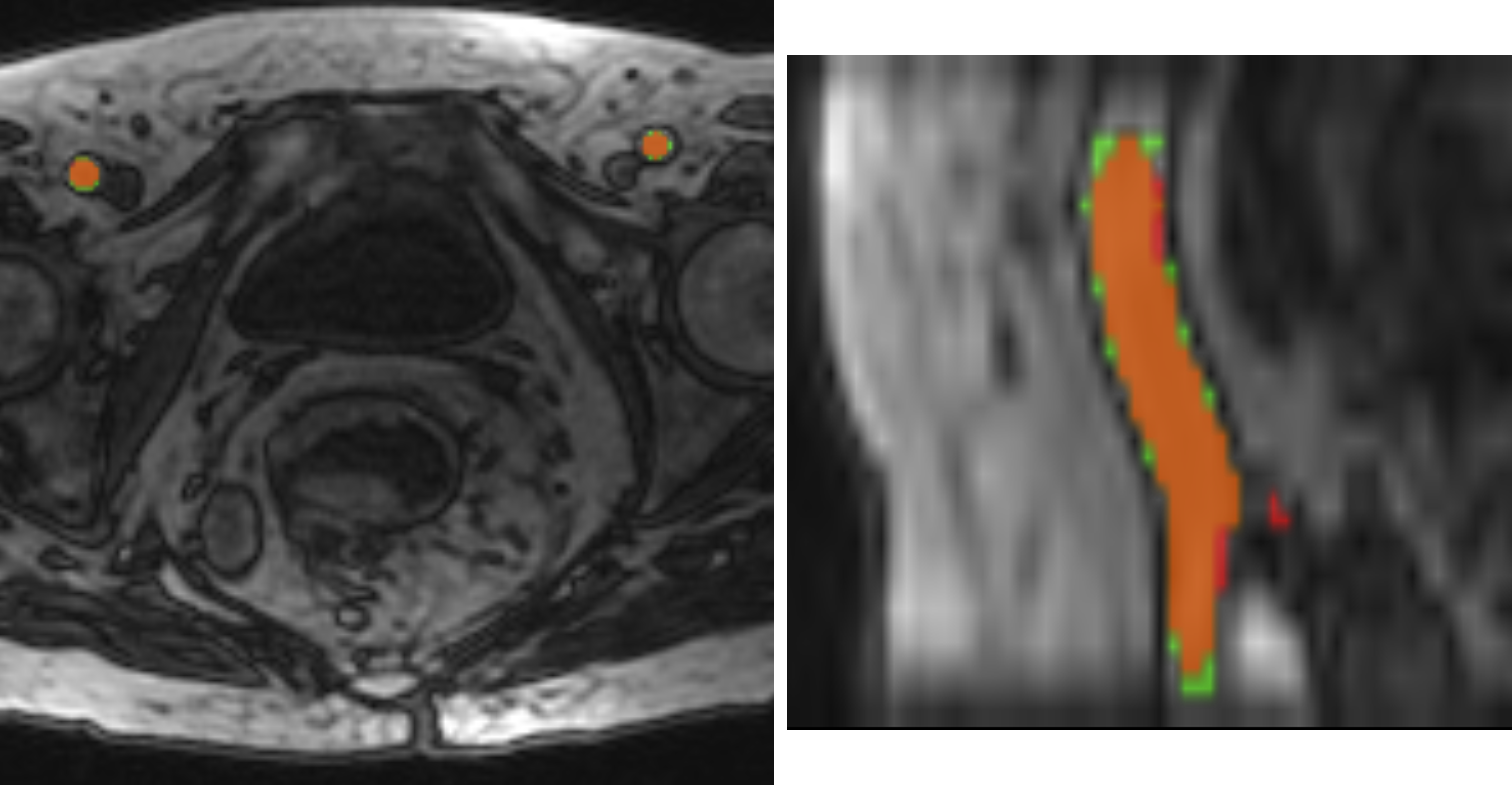
Of these the algorithms {1,2,4,6,8,9} has the best Dice and Error, additionally it is the fastest. It needs on average only 22.77 seconds for the processing of a volume. A flowchart depicting this combination of steps is shown in Figure 3. The resulting artery segmentation for one patient is shown in Figure 4.
Discussion & Conclusion
Based on our experiments the optimal steps for an algorithm to find the AIF ROI are to first select the 1% of the brightest pixel, perform a binary opening, a blob & tube filter to find vessel structures, a gamma variate filter, a flood fill and then select the largest structures.The pipeline design allows for an easy replacement and addition of steps. Further optimization of the pipeline and evaluation of alternative steps will be investigated in the future. Our results indicate that the presented algorithm can determine the AIF ROI with a high accuracy while only needing an average computation time of 23 second. Furthermore, it fulfills the criteria we previously defined.
Acknowledgements
This research project is partly supported of the Research Campus M2OLIE funded by the German Federal Ministry of Education and Research (BMBF) within the Framework “Forschungscampus: public-private partnership for Innovations” under the funding code 13GW0388A.References
[1] U. I. Attenberger, M. M. Ong, N. Rathmann, F. Doyon, P. Kienle, R.-D. Hofheinz, L. R. Pilz, D. J. Dinter, S. O. Schoenberg, and D. Hausmann, “Mmri at 3.0 t as an evaluation tool of therapeutic response to neoadjuvant crt in patients with advanced-stage rectal cancer”, Anticancer Research, vol. 37, no. 1, pp. 215–222, 2017.
[2] T. Gaa, W. Neumann, S. Sudarski, U. I. Attenberger, S. O. Schönberg, L. R. Schad, and F. G. Zöllner, “Comparison of perfusion models for quantitative T1 weighted DCE-MRI of rectal cancer”, Scientific Reports, 2017.
[3] M. Cutajar, I. Mendichovszky, P. Tofts, and I. Gordon, “The importance of AIF ROI selection in DCE-MRI renography: Reproducibility and variability of renal perfusion and filtration”, European Journal of Radiology, vol. 74, e154–60, Jun. 2009.
[4] T. Gaa, W. Neumann, S. Sudarski, U. I. Attenberger, S. O. Schönberg, L. R. Schad, and F. G. Zöllner, “Comparison of perfusion models for quantitative T1 weighted DCE-MRI of rectal cancer” [dataset], 2017. doi: 10.11588/data/NULJJR. [Online].Available: https://doi.org/10.11588/data/NULJJR.
[5] F. Calamante, “Arterial input function in perfusion MRI: A comprehensive review”, Progress in Nuclear Magnetic Resonance Spectroscopy, vol. 74, pp. 1–32, 2013. doi: https://doi.org/10.1016/j.pnmrs.2013.04.002. [6] Y. Zhu, M.-C. Chang, S. N. Gupta, “Automated determination of arterial input function for DCE-MRI of the prostate”, in Proc.SPIE, Proc.SPIE, Ed., vol. 7963, 2011, pp. 7963 - 7963 –8. doi: 10.1117/12.878213.
Figures