3379
Hyperpolarized 13C imaging with multi-shot multi-echo echo planar imaging
Kofi Deh1, Kristin Granlund1, Roozbeh Eskandari1, Arsen Mamakhanyan1, Nathaniel Kim1, and Kayvan Keshari,1
1Memorial Sloan Kettering Cancer Center, New York, NY, United States
1Memorial Sloan Kettering Cancer Center, New York, NY, United States
Synopsis
We demonstrate the use of a use of a broadband RF excitation with a multi-shot EPI readout for robust separation of metabolites in hyperpolarized 13C imaging. The approach places less demands on scanner hardware and compensates for local B0 inhomogeneity, making it possible to obtain high resolution time-resolved multi-slice imaging over a large region of interest which can be reformatted into 3D volumetric images to facilitate the study diseases such as cancer metastasis using HP probes.
Introduction
Various approaches to hyperpolarized (HP) magnetic resonance imaging (MRI) are currently in use, ranging from spectroscopy-based techniques such as chemical shift imaging (CSI) to sophisticated imaging methods such as spectral-spatial (SPSP) echo planar imaging (EPI). While the acquisition of a complete spectrum at each voxel makes the former the most robust technique, its use of one RF excitation per voxel necessitates the use of low flip angles and makes it unsuitable for dynamic imaging. The latter, on the other hand, is able to conserve magnetization by using lower flip angles for the products, but SPSP pulses are long, have limitations on achievable slice thickness, and require accurate frequency calibration. A middle ground between these two extremes is to a limited number of broadband RF pulses per repetition time, thus allowing for higher flip angles and more time points than obtained by CSI methods, without the added complexity required by the use of spectral-spatial pulses. In this study we use a multi-shot EPI sequence to achieve shorter echo spacing than obtained for our previously reported use of a single-shot sequence, resulting in a more optimal sampling rate for resolving chemical shifts which improves the robustness of decomposition of the multi-echo EPI images into metabolite maps.Methods
All experiments were performed on a preclinical Bruker Biospec 3T scanner (maximum gradient strength = 959 mT/m, maximum slew rate = 6393 T/m/s), using a dual-tuned transmit/receive 1H/13C birdcage coil and a 4-shot gradient echo echo-planar imaging (EPI) sequence (Figure 1). Images of enriched carbon phantoms, one containing 4 M [1-13C]Acetate and the other consisting of 1.5 M [1-13C]Acetate and 1.8 M [1-13C]Alanine, were acquired using the following parameters:TE1=11.5ms, ΔTE=3.7 ms, TR = 1 second, matrix size=32×32, FOV=40× 40×40 mm, excitation=90°, 10 averages and 1 slice. Nude mouse (n = 3) imaging was performed using TE1 = 3.98 ms, ΔTE = 1.51 ms, TR = 3 seconds, matrix size = 20 × 20, FOV = 60 × 60 × 5 mm, flip angle = 20°, receiver bandwidth = 100 kHz, 1 average and 10 slices. Axial T1-weighted images of the phantom or mouse were acquired with the same field of view and a matrix size of 80 × 80. Dissolution dynamic nuclear polarization (DNP) was performed using a 5 T SpinLab Hyperpolarizer (GE Healthcare). 35μl of a mixture of 14.2 M [1-13C] pyruvic acid and 15 mM trityl radical (General Electric) was polarized for 2 hours (at 94.094 Ghz) to achieve spin polarizations of approximately 10%. The mixture was dissolved with 10 mL of buffer into a flask containing a stoichiometric amount of NaOH. For animal experiments, 200 μL of HP pyruvate were injected over approximately 10 s. EPI imaging began approximately at the end of injection. Complex DICOM images were exported from the MRI scanner and processed into metabolite maps offline in MATLAB using code based on the ISMRM Water-Fat Toolbox[1] and the IDEAL model[2, 3]. Metabolite maps were corrected for chemical shift and ghosting artifacts (Figure 1), and overlaid on T1-weighted proton images for display. ROIs were prescribed on the first acquisition timepoint (Figure 4) to quantify the area under curve (A.U.C.) values for pyruvate, lactate and bicarbonate in the kidneys, liver and heart.Discussion
We validated the performance of the IDEAL decomposition of multi-shot multi-echo gradient-echo EPI images in vitro by reconstructing [1-13C]-acetate, [1-13C]-urea and [1-13C]-alanine maps from a 4 shot multi-echo gradient-echo EPI images. We also reconstructed maps of pyruvate, lactate, bicarbonate and alanine maps from a mouse injected with hyperpolarized pyruvate, demonstrating conversion to these metabolites in vivo as expect but with high temporal resolution in 3D. The 4 shot sequence with minimal echo spacing resulted in a robust separation by IDEAL, as compared to previous reports using single-shot acquisitions.Results
In the phantom experiment, multi-echo EPI images of enriched carbon chemicals were decomposed into maps showing the correct spatial distribution of urea, alanine and acetate, verified by a 2D EPSI scan. The ratio mean voxel intensity in a region-of-interest (ROI) drawn were 1:1.2:3.9 in decent agreement with the ratio of 1:1.25:3.89 obtained by integrating peaks in the spectrum acquired with a non-localized spectroscopy(Figure 2). For in-vivo experiments, axial maps of pyruvate, alanine, bicarbonate and lactate, were generated using IDEAL. Figure 3 shows the sum of intensities over time of the middle axial slice of a mouse and a coronal reformat obtained using all the 10 acquired axial slices. The ROIs prescribed using Figure 4 yielded average A.U.C. ratios ranging from the highest of 0.4 in the heart for lactate to 0.2 in the liver for alanine.Conclusion
The use of a broadband RF excitation with a multi-shot EPI readout places less demands on scanner hardware and compensates for local B0 inhomogeneity, making it possible to obtain high resolution time-resolved multi-slice imaging over a large region of interest which can be reformatted into 3D volumetric images to facilitate the study diseases such as cancer metastasis using HP probes. A multi-shot acquisition does not only allow for shorter echo spacing which leads to more robust separation, it helps to reduce image distortion and blurring, all of which are desirable in clinical applications.Acknowledgements
- NIH R00 EB014328, S10 OD016422, and RO1 CA195476
- The Center for Experimental Therapeutics
- Mr. William H. and Mrs. Alice Goodwin and the Commonwealth Foundation for Cancer Research
- The Pelican Foundation
References
[1] H. H. Hu et al., "ISMRM workshop on fat-water separation: insights, applications and progress in MRI," (in eng), Magnetic resonance in medicine, vol. 68, no. 2, pp. 378-388, 2012, doi: 10.1002/mrm.24369.[2] S. B. [2] Reeder et al., "Multicoil Dixon chemical species separation with an iterative least-squares estimation method," (in eng), Magn Reson Med, vol. 51, no. 1, pp. 35-45, Jan 2004, doi: 10.1002/mrm.10675.[3] S. B. Reeder, J. H. [3] Brittain, T. M. Grist, and Y. F. Yen, "Least-squares chemical shift separation for (13)C metabolic imaging," (in eng), J Magn Reson Imaging, vol. 26, no. 4, pp. 1145-52, Oct 2007, doi: 10.1002/jmri.21089.Figures
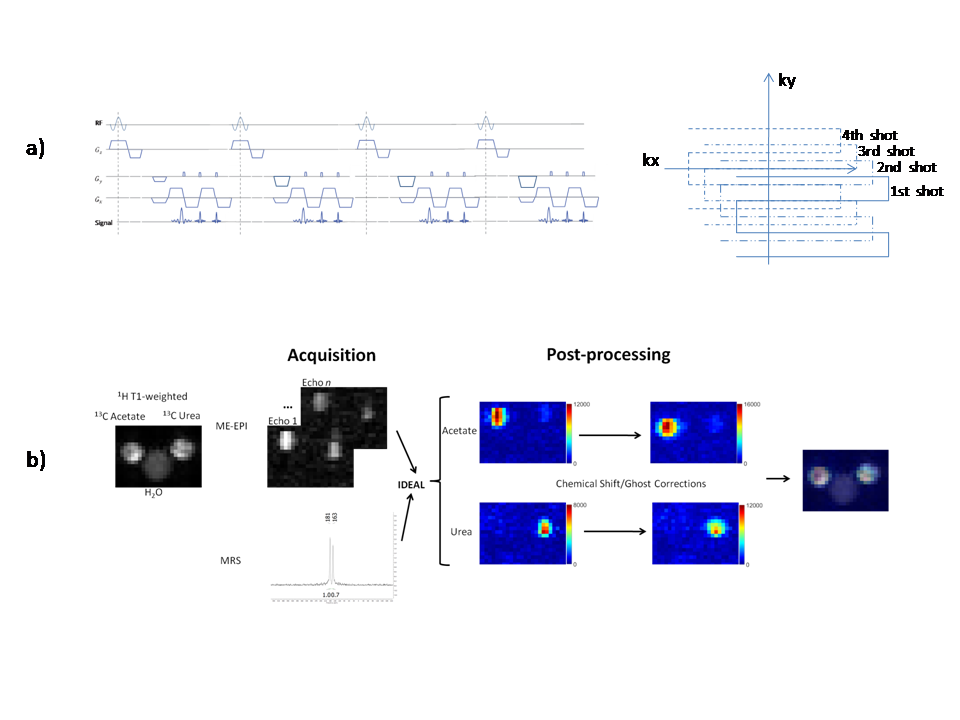
a) Pulse sequence and k-space diagram for a 4 shot interleaved EPI gradient echo multi-echo acquisition. b) Decomposition of acquired EPI dicom images into metabolite maps using IDEAL with chemical shift values from a non-localized spectroscopy scan. Corrections for chemical shift and ghosting artifacts are applied to the generated metabolite maps prior to overlay on a T1-weighted proton image.
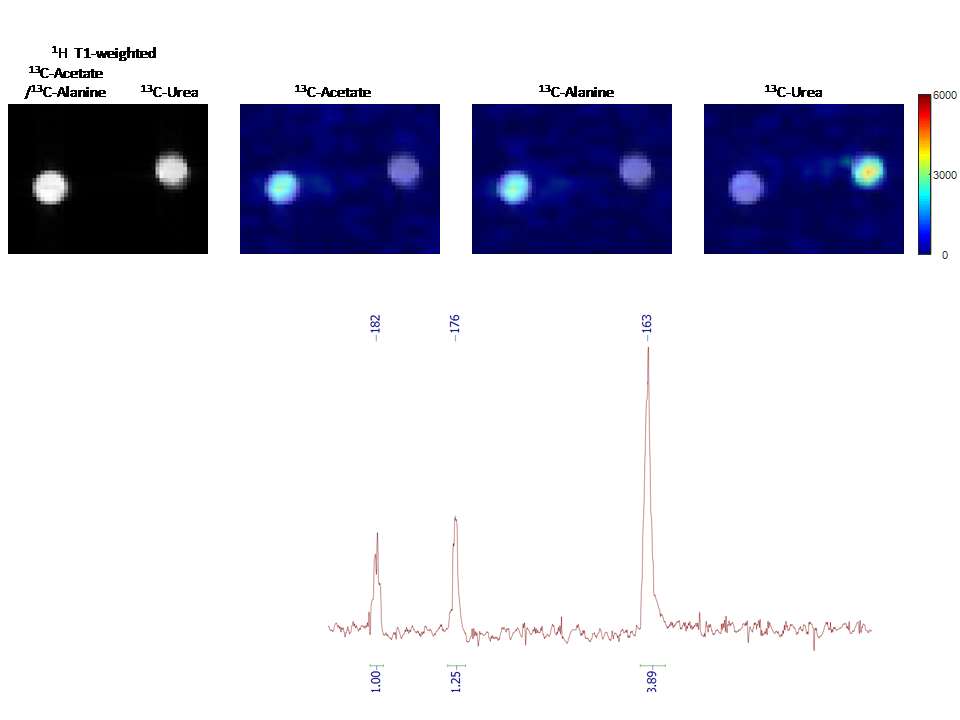
Magnitude images of two Eppendorf tubes containing approximately 1.5 M 1-13C]-Acetate and 1.8 M [ [1-13C]-Alanine (left) and 4M [1-13C]-Urea (right). The intensity maps of the chemicals are generated in approximately the correct quantitative ratios as verified by the non-localized spectroscopy scan (below).
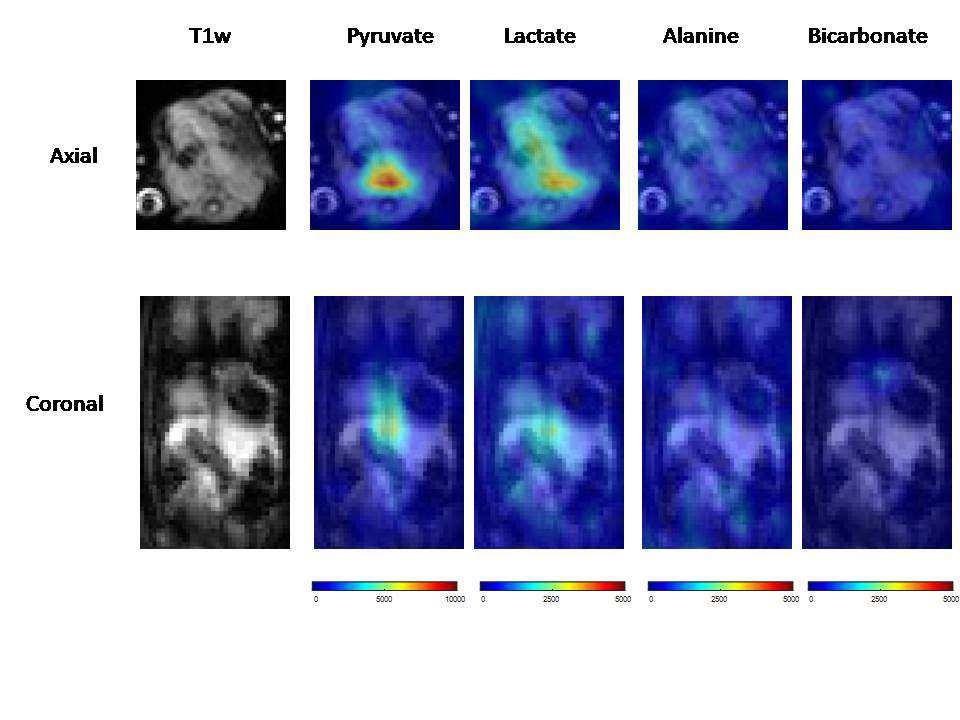
The sum of intensities for all time-points of
the middle axial slice of a mouse and a
coronal reformat obtained using all the 10 acquired axial slices, is shown for the pyruvate substrate and its metabolites. Axial and coronal anatomic images are shown for reference.
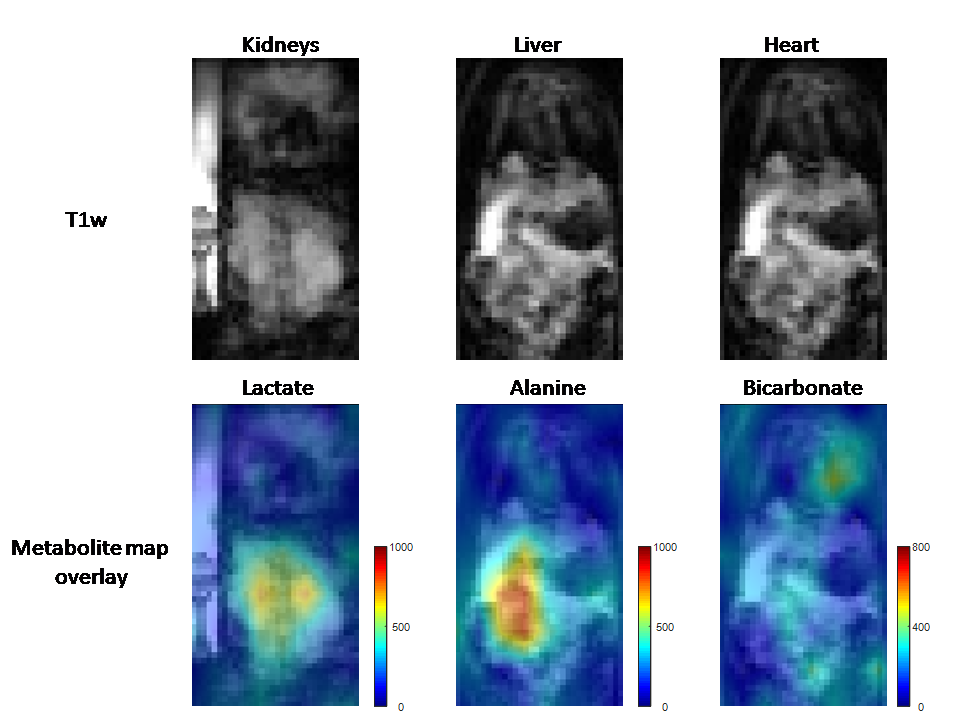
The spatial of lactate, alanine and bicarbonate are shown in the kidneys, liver and heart respectively. These distributions were used to prescribe regions of interest for quantifying the ratios of these metabolites
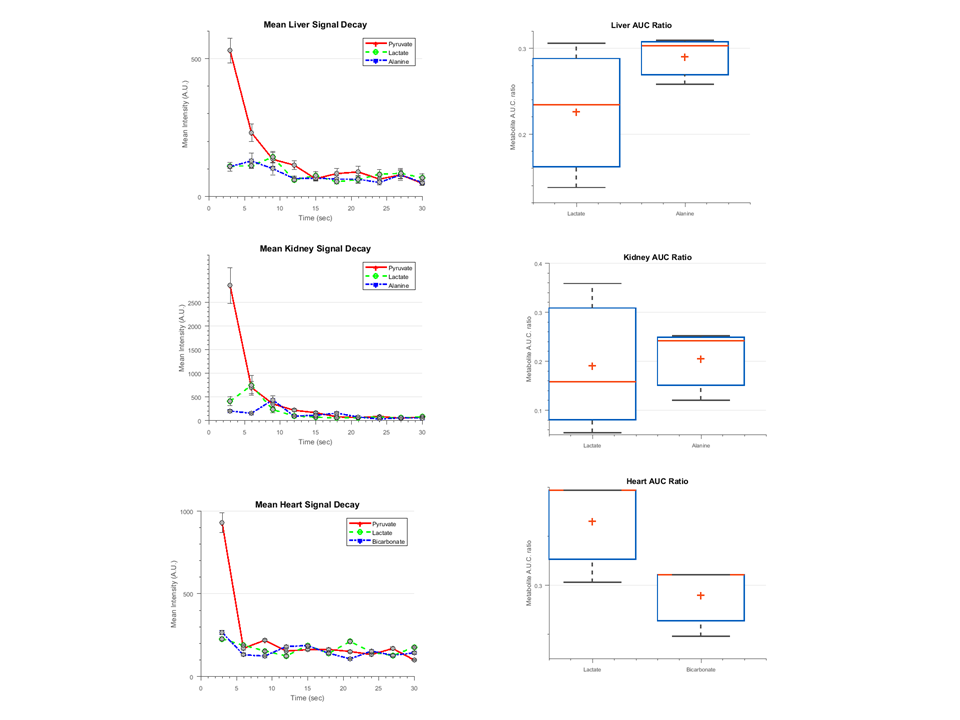
The variation of the mean intensity of the images in regions of interest prescribed in the liver, kidney, and heart are shown. Box and whisker plots for the average AUC ratio of lactate/(pyruvate+lactate+alanine) and alanine/(pyruvate+lactate+alanine) are shown for the liver and kidneys, while the average AUC ratio of bicabonate/(pyruvate+lactate+bicarbonate) is shown for the heart.