3378
Performance of Automatic Cerebral Arterial Segmentation of MRA Images Improves at Ultra-high Field.1Children's Hospital Los Angeles, University of Southern California, Los Angeles, CA, United States, 2Rudi Schulte Research Institute, Santa Barbara, CA, United States, 3Swanson School of Engineering and School of Medicine, University of Pittsburgh, Pittsburgh, PA, United States
Synopsis
Ultra-high field time of flight MRA can generate images with higher signal and resolution but image quality may suffer from increased field inhomogeneity. Because we would like to extract arteries for further analysis, we sought to evaluate automatic segmentation performance compared with standard field strength. Five segmentation algorithms were applied to two MRA images (one 3T, one 7T) and performance was measured against manually segmented ground truth data. We found that automatic segmentation performs better in 7T images but confounds in acquisition and image processing need to be further investigated.
Introduction
Time-of-flight magnetic resonance angiography (TOF MRA) enables examination of cerebral arterial morphology by creating contrast in vessels with faster-moving blood traveling perpendicular to the imaging plane.1 Radiological reviews of these images typically identify focal pathologies like aneurysm or stenosis, but computer-aided methods can analyze the entire segmented vasculature and generate global metrics of pathology. At higher field strengths, signal is increased at the cost of greater RF field and B0 field inhomogeneity.2 Because we would like to deploy vascular analysis tools in high-field TOF MRAs, we must first understand the accuracy of computational vessel segmentation compared with homogenous images from lower field strengths.Methods
The Committee on Clinical Investigation at Children’s Hospital Los Angeles (CHLA) approved the protocol to acquire 3T images; written informed consent and/or assent were obtained from all subjects (CCI#2011-0083). One MRA image was collected from the larger study. Each subject underwent an MRI study using a 3T Philips Achieva with an 8-element phased-array coil. TOF MRA was acquired with the following parameters: TR = 23ms, TE = 3.45ms, flip angle = 18°, FOV = 200mm × 200mm, resolution = 1.00mm × 1.00mm, 140 slices, slice thickness = 1.0mm, duration = 214 seconds. The 7T TOF MRA was acquired at University of Pittsburgh under the Small Vessel Disease Study (NIH#R01MH111265) using a 7T Siemens Magnetom and a custom RF coil with 16 Tic-Tac-Toe transmit channels and a 32-channel receive insert.3,4 Acquisition parameters: TR = 16ms, TE=4.5ms, FOV = 194 × 158mm, resolution = 0.38mm × 0.38mm, 338 slices, slice thickness = 0.38mm, duration = 770 seconds. The 7T image was bias-corrected and skull stripped using the SPM 12 package, and denoised by applying a variance stabilizing transformation combined with the BM4D denoising algorithm.5Ground truth datasets were generated by manually segmenting arteries in five MRA image slices from each patient to sample a variety of artery diameters and trajectories: (1) axial slice through the carotids and either the basilar or vertebral arteries, (2,3,4) three axial slices superior to the Circle of Willis, and (5) one coronal slice through the posterior communicating arteries. Artery classification involved a subjective determination based on all available information including intensity, location, surrounding voxel intensity, local morphology, and a neuroanatomical atlas. Manual segmentation was used to calculate signal-to-noise and contrast-to-noise.
Computer-based vascular segmentations were generated using MATLAB (Mathworks, Natick MA) which tested combinations of region-selection algorithms, and data-segmentation algorithms. Two region selection algorithms were used: (1) ‘global’, which selected the entire MRA volume, or (2) ‘local’, a vessel-trajectory estimation technique to iteratively define the region.6 Five data-segmentation algorithms were used: (1) Otsu’s method thresholding, (2) K-means clustering, (3) region growing, (4) active contours and (5) a modification of the minimum cost analysis algorithm proposed by Yi et al.6 Performance was quantified via Matthews correlation coefficient (MCC), which produces a balanced measure of binary classification quality despite a large difference between the number of artery and parenchyma voxels in our images. MCC ranges from 1 (perfect classification) through 0 (random guessing), to -1 (perfect disagreement).
Results
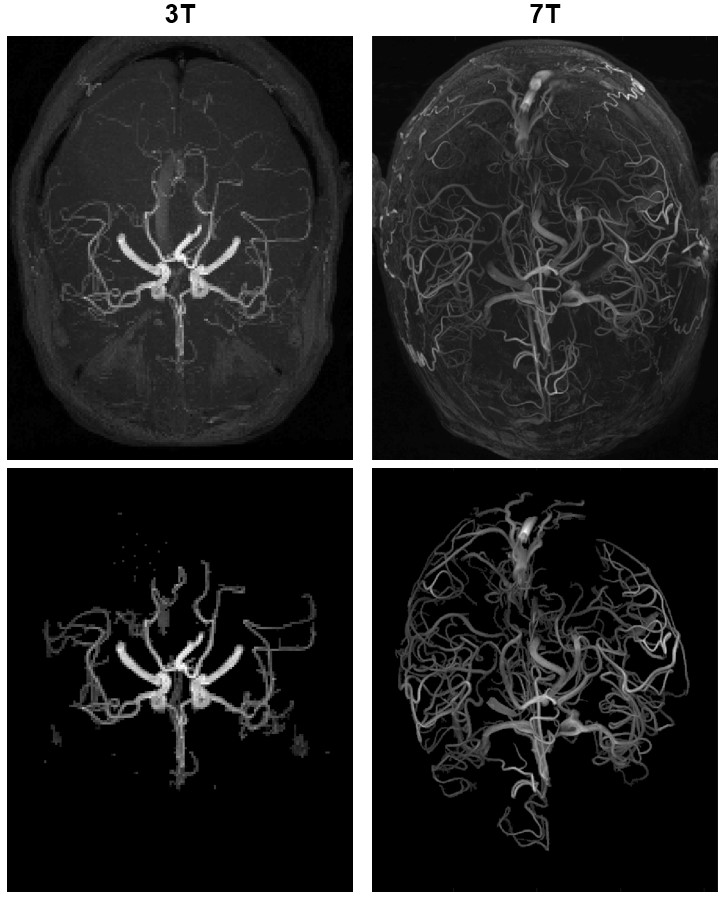
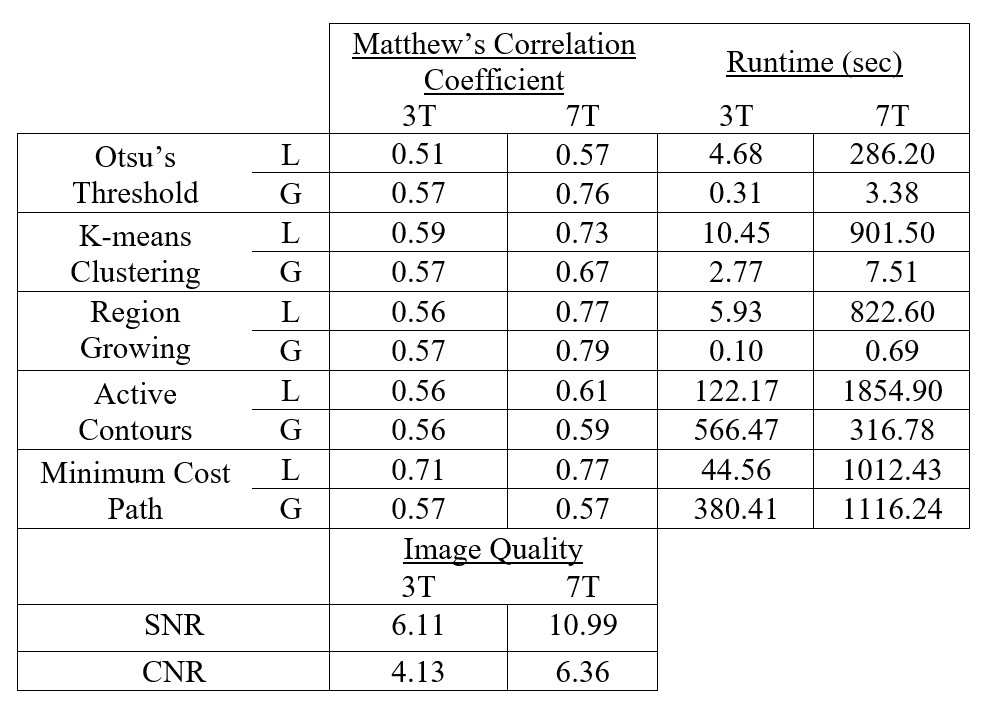
Axial maximum intensity projections for each patient are shown in Figure 1. Image quality and algorithm performance metrics are in Table 1. As anticipated, signal-to-noise and contrast-to-noise ratios were both substantially higher in the 7T image. The MCC was consistently equal or better for all region-segmenter pairs in the 7T image compared to the 3T image. Local minimum cost path had the best performance in 3T (MCC = 0.71). Global region growing, local region growing, and local minimum cost path were the best three in the 7T image (MCC = 0.79, 0.77, 0.77 respectively). The computationally fastest method overall was global region growing, followed by global Otsu’s threshold and global K-means clustering.Discussion
Higher performance of automated segmentation in the 7T dataset is consistent with higher signal-to-noise and contrast-to-noise compared with the 3T dataset. We speculate that higher signal-to-noise ratios at higher field strengths contribute to improved performance. Good performance from global algorithms like region growing and Otsu’s threshold in the 7T dataset indicates that field inhomogeneity had little impact on segmentation. We acknowledge several confounds and limitations: 1) additional post-processing was used to partially correct for inhomogeneities in the 7T dataset that was not applied to the 3T dataset, 2) the 7T dataset resolution is notably higher, and 3) the head coil used in the 7T acquisition is custom hardware of novel design.It is encouraging that simple and computationally fast Otsu’s threshold and region growing algorithms were among the best-performing in the 7T since it indicates that increasing image quality decreases the necessity for complicated algorithms, whereas the noticeably higher performance of minimum cost path in 3T indicates that lower image quality may still necessitate more advanced algorithms for accurate vascular segmentation.
Conclusion
Automatic segmentation performs better in 7T compared with 3T. We speculate that this was a result of higher signal-to-noise ratios and higher resolution that outweigh the effects of higher inhomogeneity, but additional investigation is needed to address confounds.Acknowledgements
We extend our gratitude to the Rudi Schulte Research Institute and the National Institute of Mental Health for funding portions of this research.References
1. F. R. Korosec, “Basic Principles of Phase-contrast, Time-of-flight, and Contrast-enhanced MR Angiography,” Principles of MR Angiography, pp. 1–10, 1999.
2. F. Schick, “Whole-body MRI at high field: technical limits and clinical potential,” Eur. Radiol., vol. 15, no. 5, pp. 946–959, May 2005.
3. T. Santini et al., “In-vivo and numerical analysis of the eigenmodes produced by a multi-level Tic-Tac-Toe head transmit array for 7 Tesla MRI,” PLoS One, vol. 13, no. 11, p. e0206127, Nov. 2018.
4. N. Krishnamurthy et al., “Computational and experimental evaluation of the Tic-Tac-Toe RF coil for 7 Tesla MRI,” PLoS One, vol. 14, no. 1, p. e0209663, Jan. 2019.
5. T. Santini et al. “Noise mitigation from high-resolution 7T MRI images”, In Proc. of the 26th International Society of Magnetic Resonance in Medicine Annual Meeting, 2018, Paris, France.
6. J. Yi and J. B. Ra, “A locally adaptive region growing algorithm for vascular segmentation,” Int J Imag Syst Tech, vol. 13, no. 4, pp. 208–214, 2003.
Figures