3377
Brain regional hemodynamic alterations in obstructive sleep apnea using dynamic susceptibility contrast MRI1Department of Electric Engineering, University of Southern California, Los Angeles, CA, United States, 2Inje University College of Medicine, GoyangSouth, Korea, Republic of, 3Stevens Neuroimaging and Informatics Institute, Keck School of Medicine, University of Southern California, Los Angeles, CA, United States, 4Sungkyunkwan University School of Medicine, Seoul, Korea, Republic of
Synopsis
In this study, we comprehensively studied the regional hemodynamic measures including CBF, cerebral blood volume (CBV), and time-related hemodynamic parameters in OSA patients using Gadolinium contrast agent (Gd)-base dynamic susceptibility contrast MRI.
INTRODUCTION
Obstructive sleep apnea (OSA), which is known as the most frequent type of Sleep-Disorders, is characterized by repetitive episodes of the upper airway’s obstructions during sleep.1 OSA leads to hypoxia and sleep fragmentation, 2 which eventually harms the brain. The hypoxia-induced hemodynamic changes, which may be associated with degenerative processes, impaired systemic or cerebral vascular regulation, may further induce the region structural and functional deficits in the brain. Previous perfusion imaging studies have mainly focused on studying cerebral blood flow (CBF) alterations in OSA population (refs). In this study, we comprehensively studied the regional hemodynamic measures including CBF, cerebral blood volume (CBV), and time-related hemodynamic parameters in OSA patients using Gadolinium contrast agent (Gd)-base dynamic susceptibility contrast MRI.METHODS
Participants and MRI protocol: 25 patients with OSA (all male, mean age 4510, range=23-65, mean BMI 26.93.2, range=21.9-39.3) and 25 healthy volunteers (4 females, mean age 389 years, range=28-57, mean BMI 23.61.9, range=17.8-26.4) participated in this study after providing written informed consent. MRI images were acquired using a Philips 3.0-T MRI scanner (Intera Achieva 3T) with an eight-channel sensitivity-encoding head coil. High-spatial-resolution axial T2*-weighted echo planar images were acquired using the following sequence parameters: TR=1,720 ms, TE=35 ms, FOV=240×240 mm, matrix=256×256, slices=50, slice thickness=5.0 mm, gap=1.5 mm, number of dynamic scans=50, and temporal resolution=1.8 s. Brain structural images were acquired using T1-weighted coronal spoiled gradient recalled (SPGR) MRI (TR=10 ms, TE=4.6 ms, matrix=480×480, slices= 360, slice thickness=0.5 mm). Image processing: Multi-parametric perfusion maps including CBF, CBV, mean transit time (MTT), and time to peak (TTP) from DSC images by deconvolution of the image series with arterial input function, according to the general kinetic model. As DSC only provided semi-quantitative CBF, the CBF map was normalized by the mean intensity for each subject. All the parametric perfusion maps were normalized to the NMI space and then smoothed with a kernel size of 8x8x8mm3. A two-sample t-test was employed to compared the voxel-based difference between OSA and normal groups while age and BMI were included as covariance.RESULTS
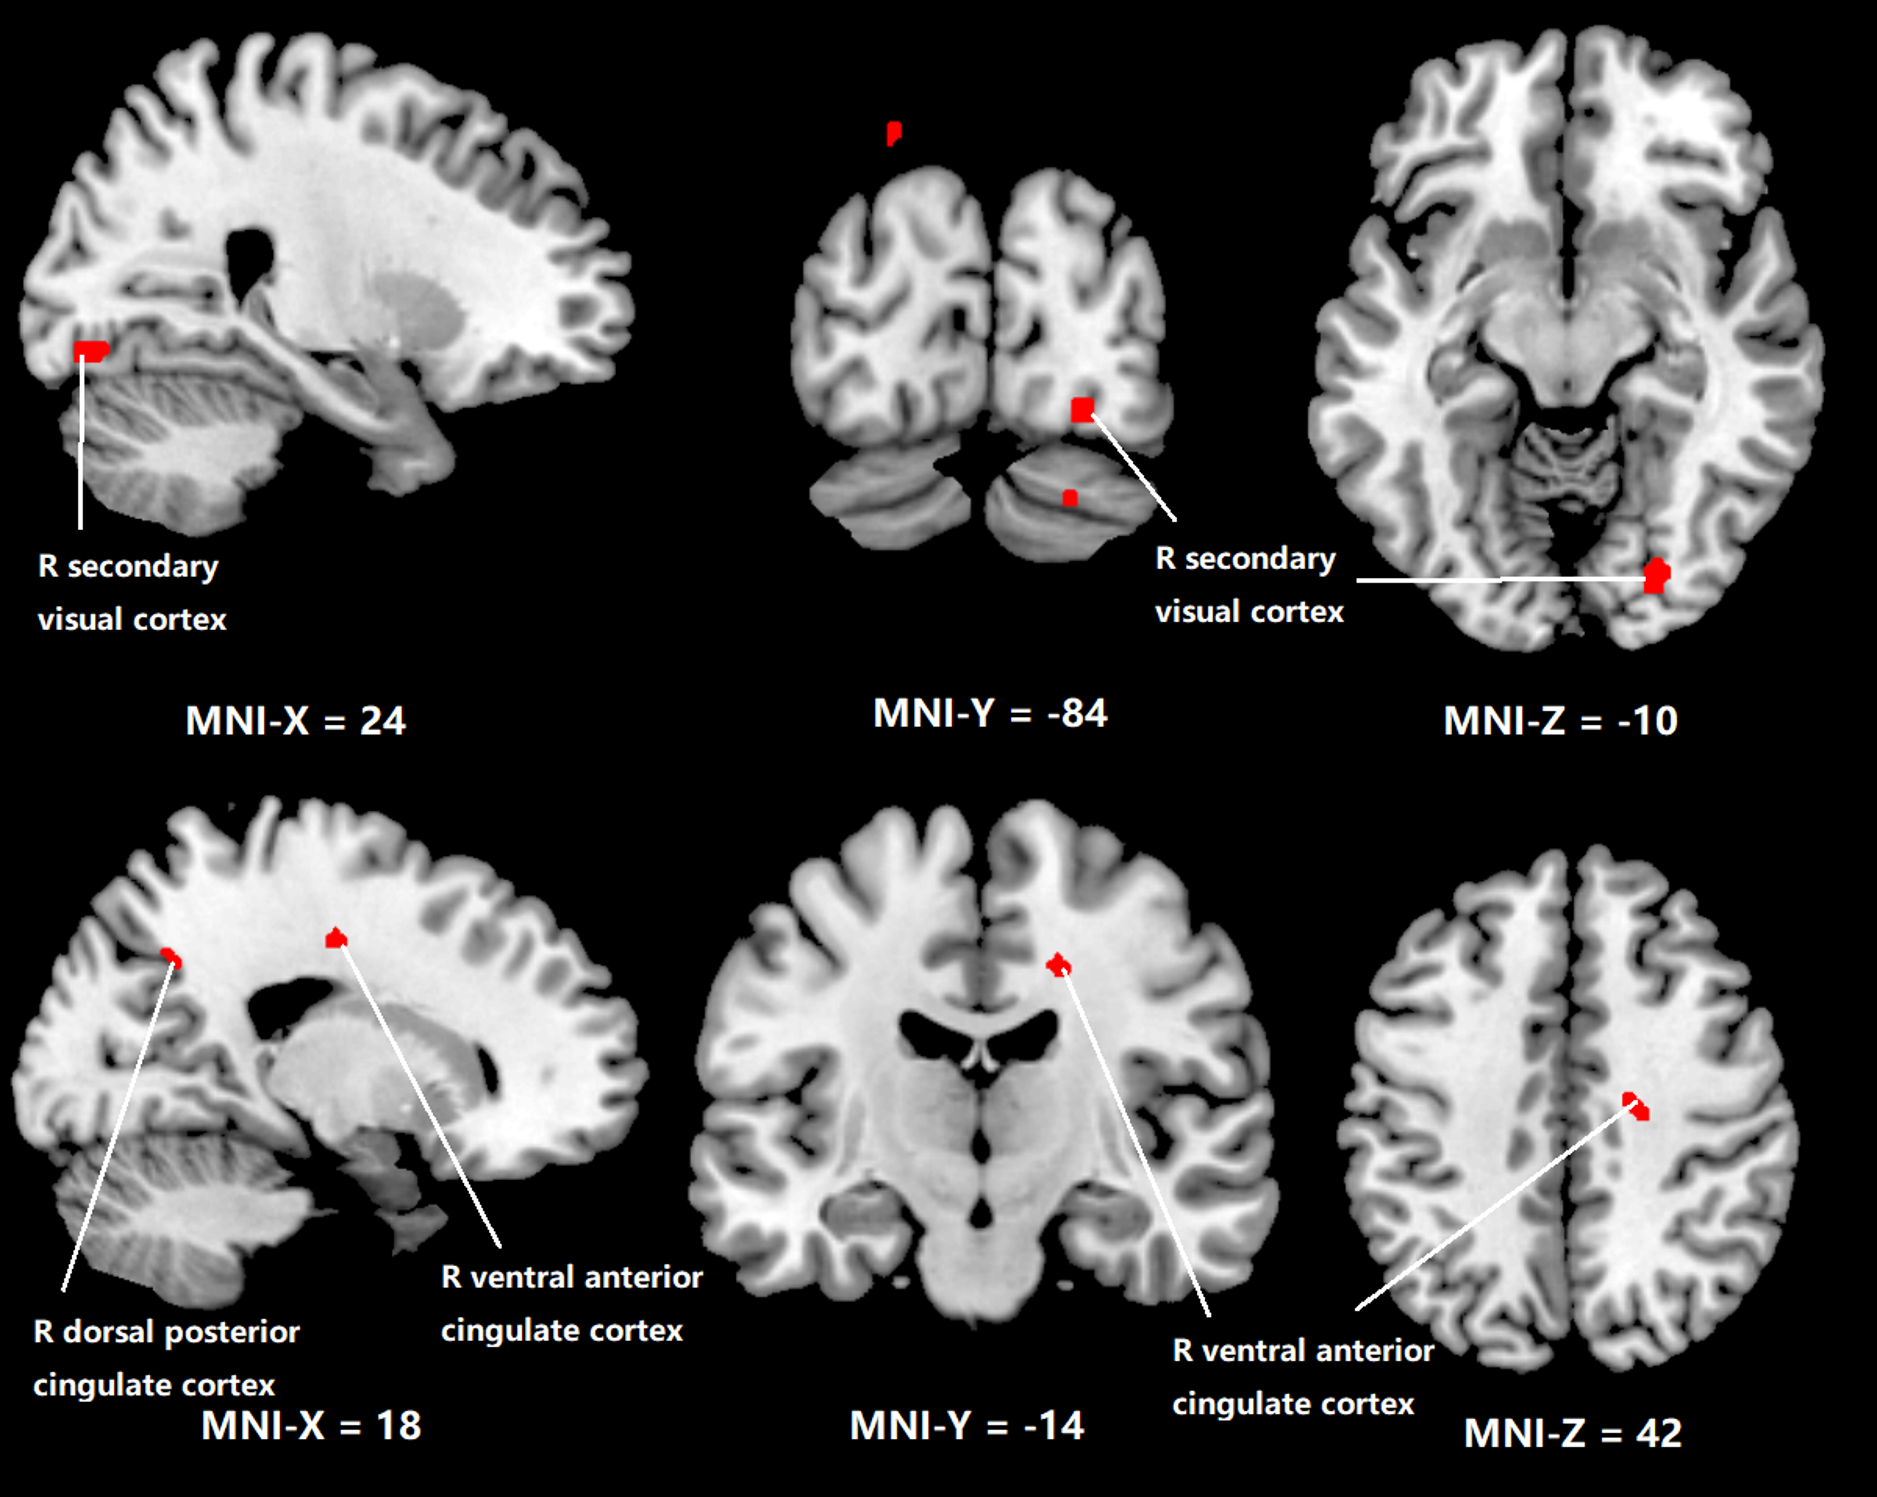
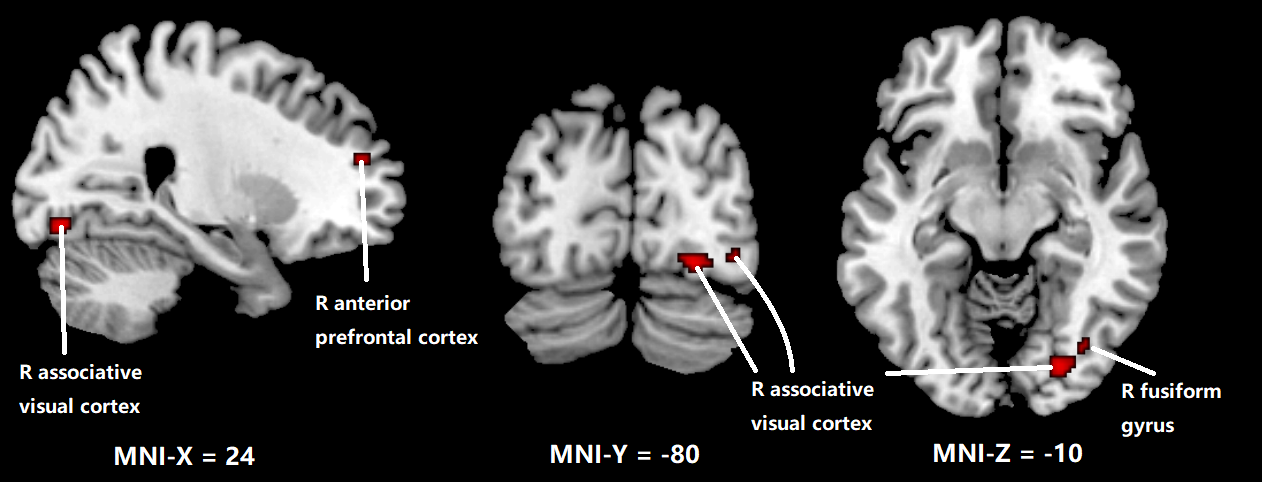
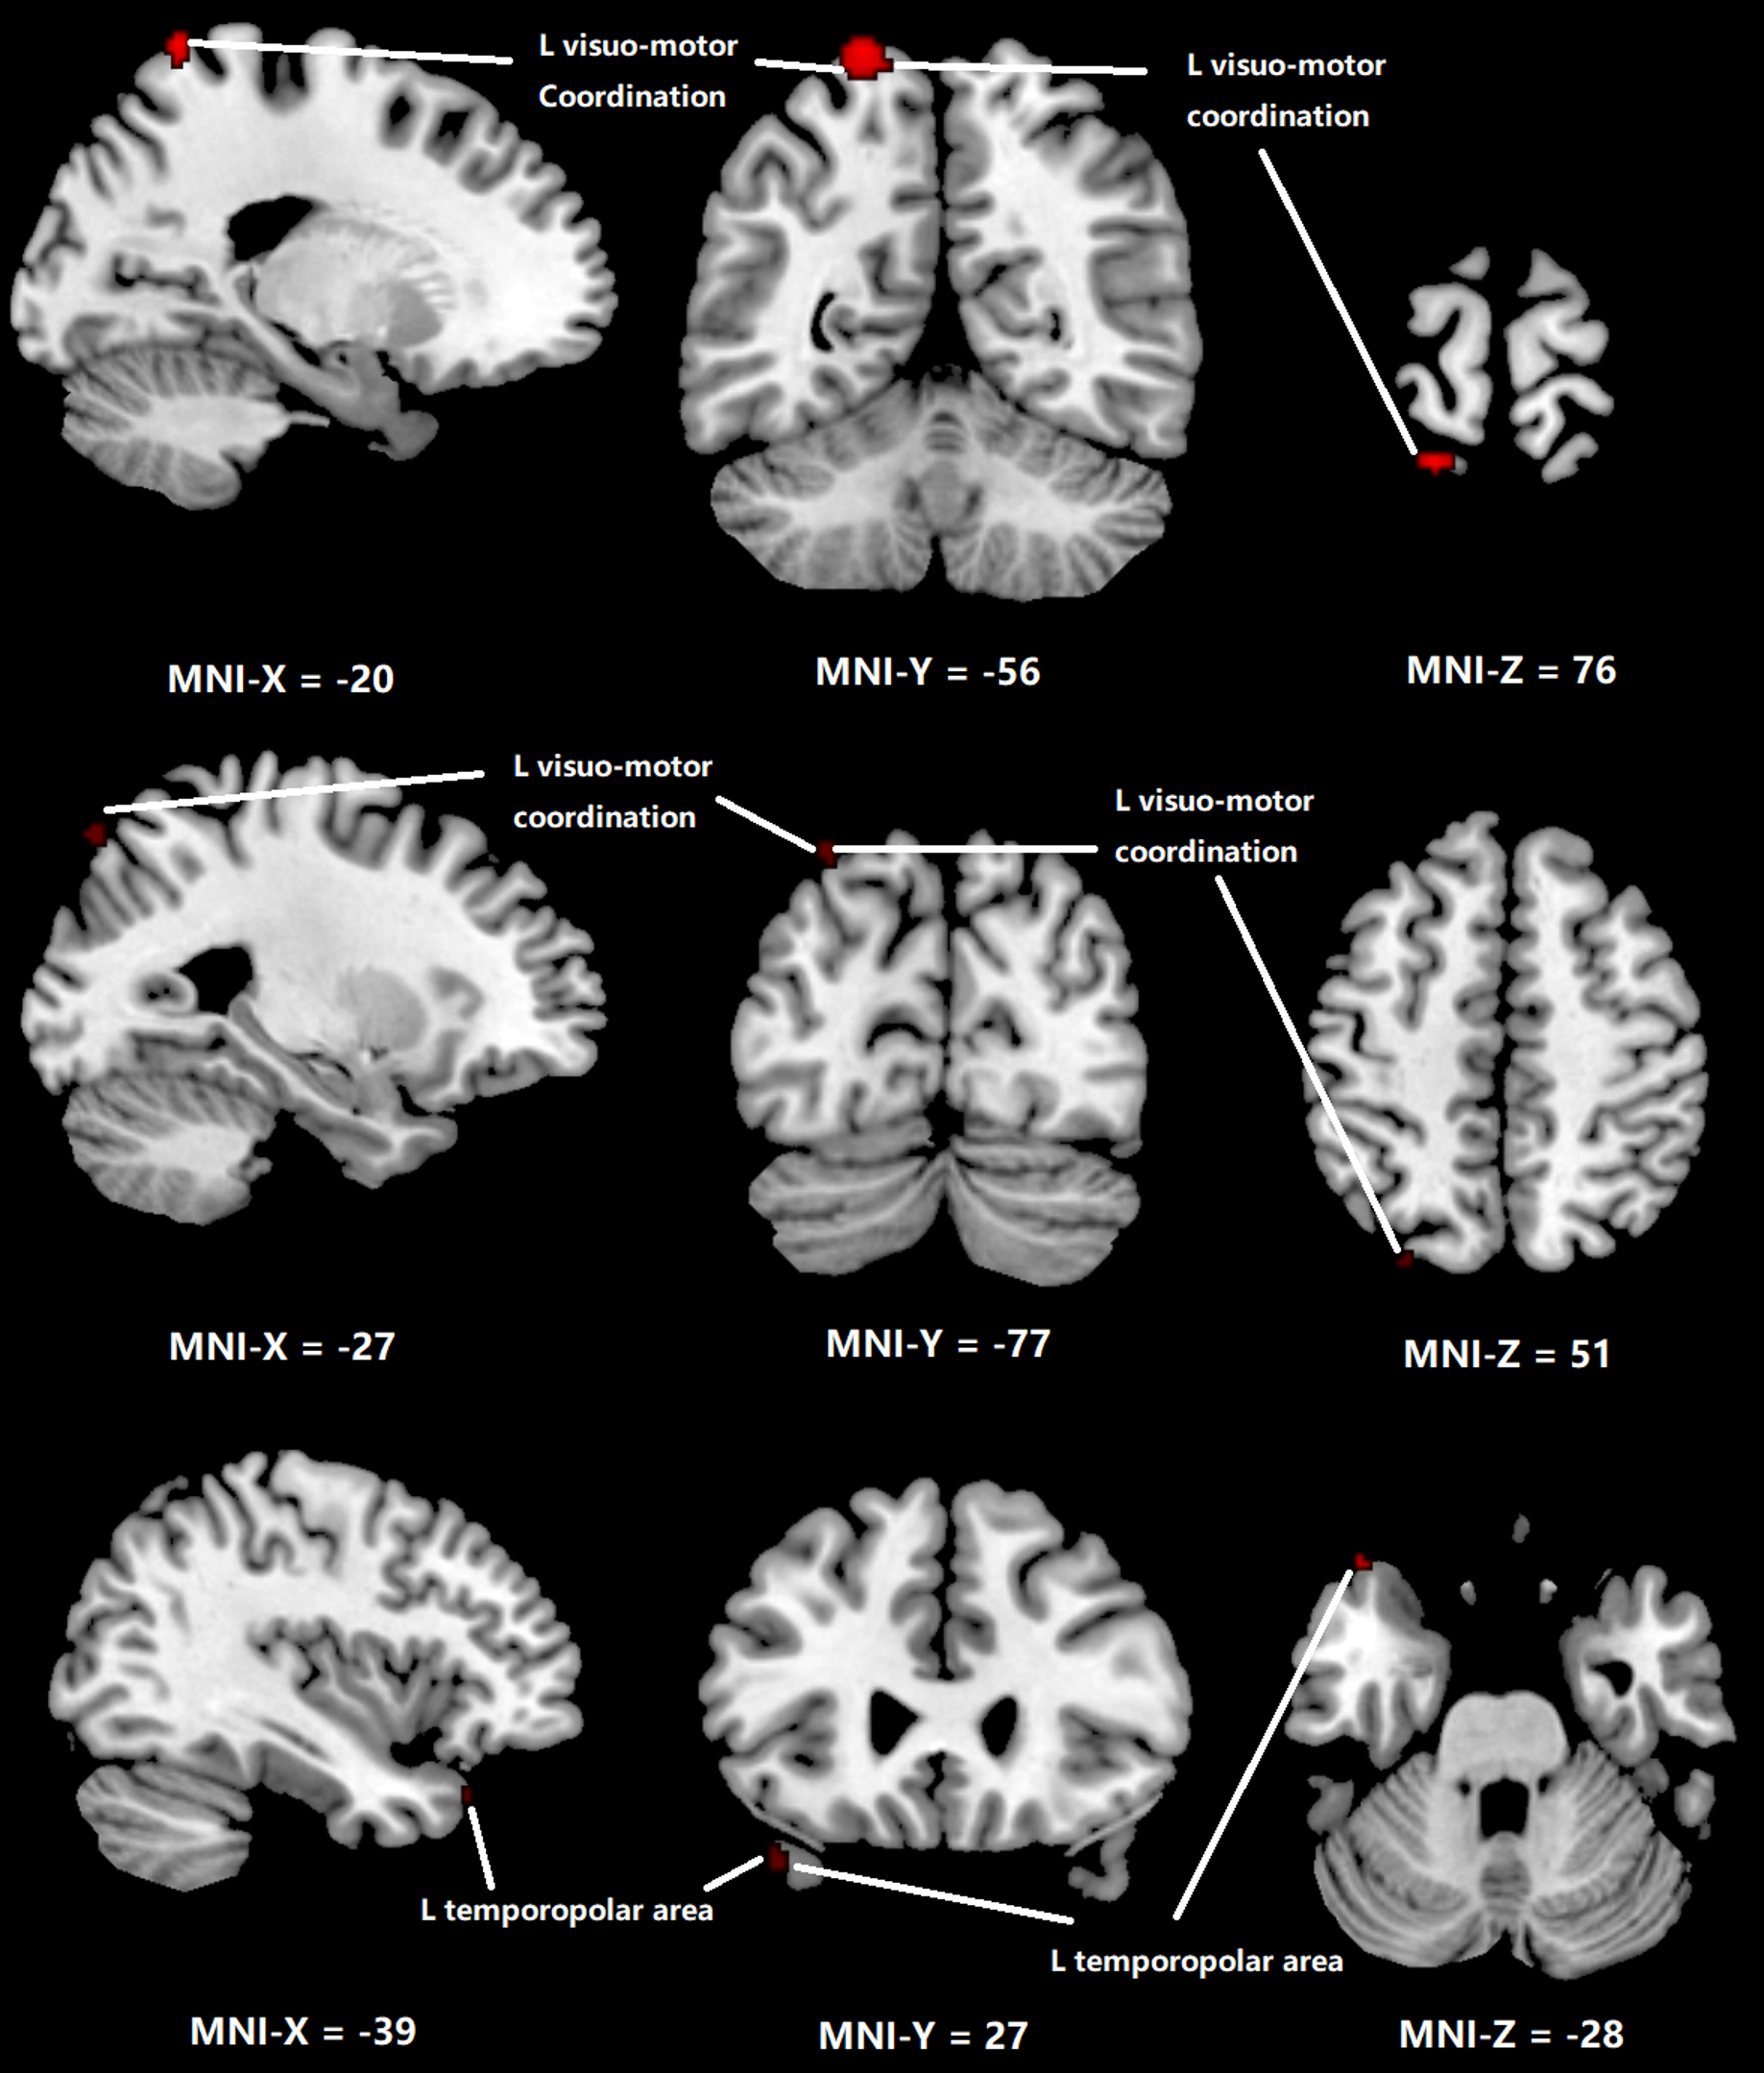
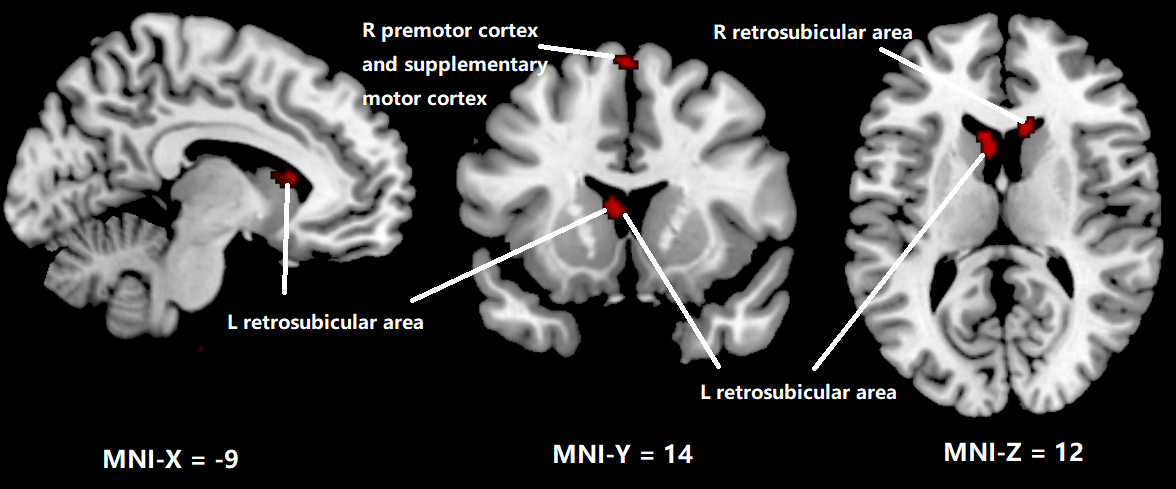
Figure 1 shows the regions with significant reduction of CBF in OSA patients compared to normal subjects. Significant CBF reduction is found in right secondary visual cortex regions, right ventral anterior cingulate cortex and right dorsal posterior cingulate cortex. Figure 2 shows obvious CBV difference occurring in right anterior prefrontal cortex, right associative visual cortex and right fusiform gyrus. As for MTT, in Figure 3, the main changes are shown in left and right Visuo-Motor Coordination and left temporopolar area. In figure 4, at last, the variation in TTP is in right premotor cortex and supplementary motor cortex and both right and left retrosubicular area.CONCLUSION
Increasing evidence suggests that OSA causes deficits of cerebral function in multiple brain regions, which could be associated with regional hemodynamic changes. Multiple hemodynamic parameter can be derived from DSC perfusion imaging, which could provide a comprehensive evaluation of local hemodynamic changes in OSA.Acknowledgements
No acknowledgement found.References
1. Berry, Richard B et al. “Rules for scoring respiratory events in sleep: update of the 2007 AASM Manual for the Scoring of Sleep and Associated Events. Deliberations of the Sleep Apnea Definitions Task Force of the American Academy of Sleep Medicine.” Journal of clinical sleep medicine : JCSM : official publication of the American Academy of Sleep Medicine vol. 8,5 597-619. 15 Oct. 2012, doi:10.5664/jcsm.2172
2. Foldvary-Schaefer, N. R., & Waters, T. E. (2017). Sleep-Disordered Breathing: CONTINUUM: Lifelong Learning in Neurology, 23(4), 1093‑1116.
3. Bucks, RS; Olaithe, M; Eastwood, P (2012). "Neurocognitive Function in Obstructuve Sleep Apnea: A Meta-Review". Respirology. 18 (1): 61–70.
4. Olaithe, M; Bucks, RS; Hillman, DR; Eastwood, PR (2017). "Cognitive Deficits in Obstructive Sleep Apnea: Insights from a Meta-Review and Comparison with Deficits Observed in COPD, Insomnia and Sleep Deprivation". Sleep Medicine Reviews. 38: 39–49.
5. Schwab, Richard J.; Kim, Christopher; Bagchi, Sheila; Keenan, Brendan T.; Comyn, François-Louis; Wang, Stephen; Tapia, Ignacio E.; Huang, Shirley; Traylor, Joel; Torigian, Drew A.; Bradford, Ruth M.; Marcus, Carole L. (2015). "Understanding the Anatomic Basis for Obstructive Sleep Apnea Syndrome in Adolescents". American Journal of Respiratory and Critical Care Medicine. 191 (11): 1295–1309.
6. Frank Gaillard; et al. "Dynamic susceptibility contrast (DSC) MR perfusion". Radiopaedia. Retrieved 2017-10-14.
7. Ding, S. L.; Van Hoesen, G. W.; Cassell, M. D.; Poremba, A. (2009). "Parcellation of human temporal polar cortex: A combined analysis of multiple cytoarchitectonic, chemoarchitectonic, and pathological markers". The Journal of Comparative Neurology. 514 (6): 595–623.
Figures