3375
Highly-accelerated Compressed Sensing 4D Flow MRI for Quantification of Whole Heart Hemodynamics1Northwestern University, Chicago, IL, United States, 2Siemens Medical Solutions USA, Inc., Chicago, IL, United States, 3Siemens Medical Solutions USA, Inc., Cleveland, OH, United States
Synopsis
The purpose of this study was to evaluate an efficient, free-breathing, whole-heart 4D flow CS protocol in a cohort of 21 healthy controls. The CS technique was evaluated for internal self-consistency by comparing net flow through various cardiac structures. In addition, cine imaging was performed and used to calculate left ventricular (LV) stroke volume (SV) for comparison to net flow in the ascending aorta. CS whole-heart 4D flow was acquired in 5:23 ± 0:51 minutes. Input and output flow, and LV stroke volume and ascending aorta net volume with 4D flow were significantly (p<0.05) correlated for all comparisons.
Introduction
4D flow MRI is currently limited by long scan times and inefficient post-processing workflows. Recently, Ma et al. demonstrated the feasibility of a 2 minute aortic protocol with less than 5 minutes of inline scanner reconstruction using a highly-accelerated compressed sensing (CS) 4D flow prototype framework with Respiratory Controlled Adaptive K-space Reordering (ReCAR) and retrospective cardiac gating.1 An efficient whole-heart imaging protocol without respiratory navigator was also proposed using this framework.2 The purpose of this study was to evaluate this efficient, free-breathing, whole-heart 4D flow CS protocol in a larger cohort of 21 healthy controls.Methods
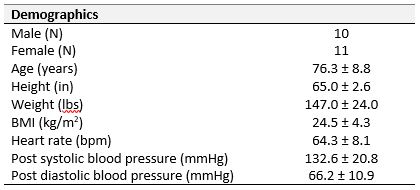
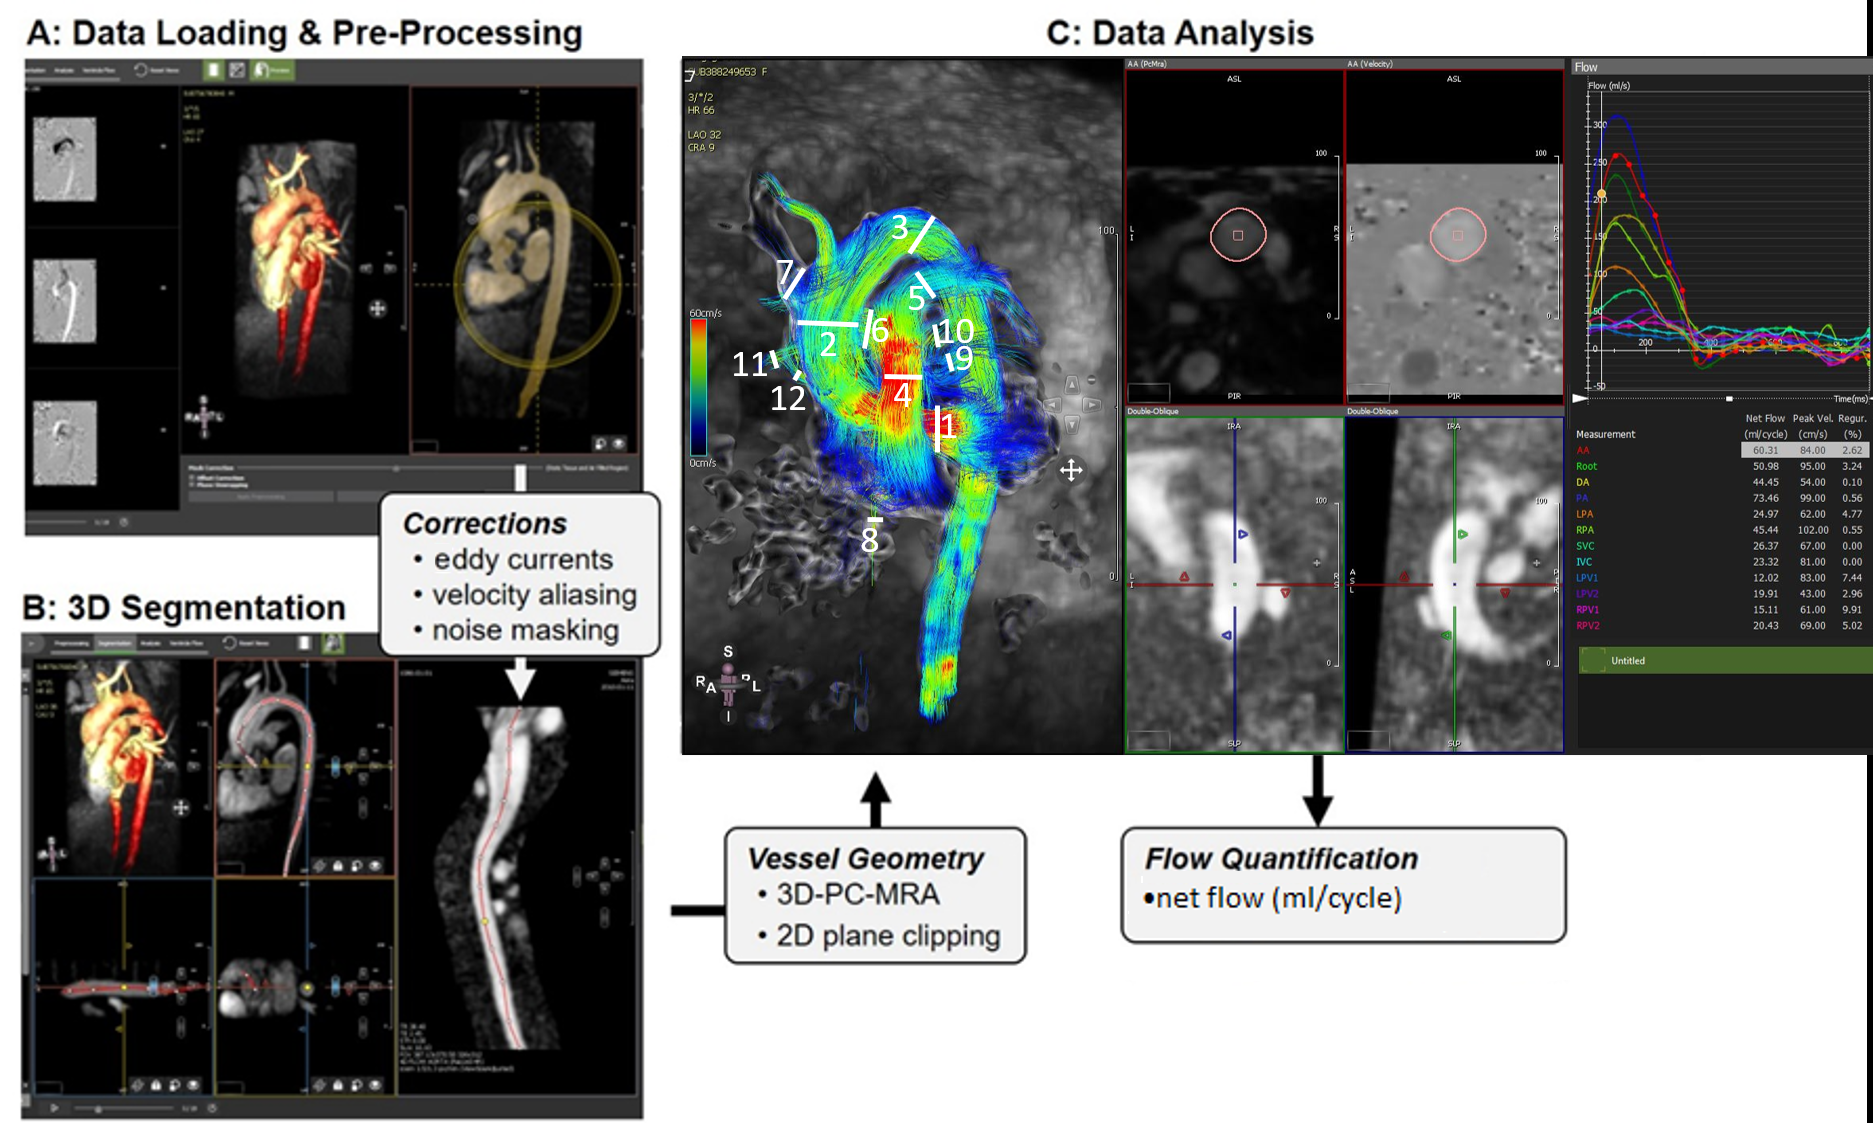
21 healthy controls (age=76.3±8.8 years, 11 female) underwent CS whole heart 4D flow MRI (temporal resolution [41.28-41.52 ms], spatial resolution [2.3-2.5x2.3-2.8x2.8-3.3 mm3], encoding velocity (venc) 120cm/s, FOV [400-480x333-400x120-180 mm3]) on a 1.5T MRI system (MAGNETOM Aera, Siemens Healthcare, Erlangen, Germany). Briefly, the whole heart was imaged in a coronal orientation with a large field-of-view and left-right phase encoding to minimize respiratory motion artifacts. Data analysis was conducted using commercial 4D flow software (Circle cvi42, v5, Calgary, Canada). 4D flow analysis followed a 4-step workflow (Figure 1): 1) Pre-processing with noise masking and corrections for eddy current induced phase offset errors and velocity aliasing; 2) thresholding and 3D segmentation of the whole heart based on an automatically derived 3D PC-MR angiogram; 3) 4D flow visualization using 3D streamlines and velocity maximum intensity projections (MIP); and 4) quantification of net flow in 12 analysis planes at defined anatomic locations (1: aortic root, 2-3: proximal and distal aortic arch, 4: pulmonary trunk, 5-6: right and left pulmonary arteries, 7-8: superior and inferior vena cava, and 9-12: four pulmonary veins proximal to left atrium). The CS technique was evaluated for internal self-consistency by comparing net flow through various cardiac structures including the superior and inferior caval veins, aorta, pulmonary artery, left and right pulmonary branches, and all 4 pulmonary veins. Assuming an absence of shunts in this healthy population, the conservation of mass principle (e.g., expected Qp/Qs ratio of 1, equal flow into and out of left and right ventricles, equal flow before and after the pulmonary artery bifurcation) was applied as a measure for flow quantification accuracy. In addition, standard short-axis balanced steady-state free precession (bSSFP) cine imaging was performed and used to calculate left ventricular (LV) stroke volume (SV) for comparison to net flow in the ascending aorta.Results
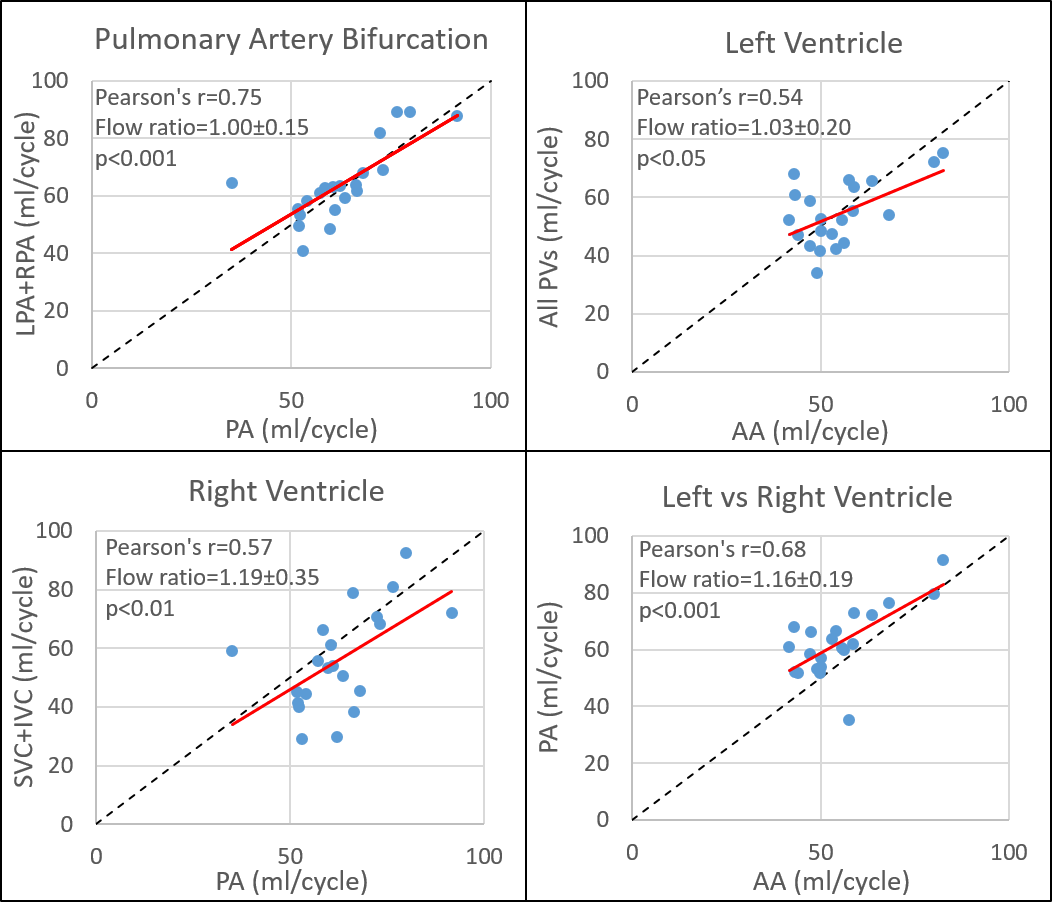
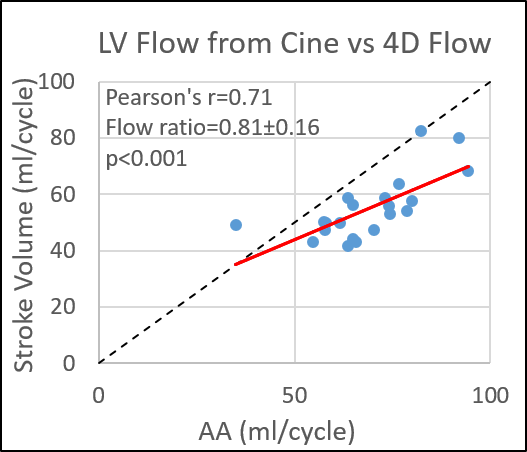
Healthy control demographics are summarized in Table 1. CS whole-heart 4D flow was acquired in 5:23 ± 0:51 minutes. Assuming all volunteers had four pulmonary veins, five analysis planes were unable to be placed in the pulmonary veins in four patients out of 252 (2%) total analysis planes because they could not be seen. Input and output flow were significantly (p<0.05) correlated for all comparisons with Pearson’s r values ranging from 0.44-0.75 (Figure 2). Self-consistency was greatest before/after the pulmonary artery bifurcation (pulmonary trunk vs. LPA + RPA, r = 0.75, p<0.001) and for left vs right ventricular flow (pulmonary trunk vs. ascending aorta, r = 0.68, p<0.001), with an average Qp/Qs (pulmonary trunk/ascending aorta) ratio of 1.16 ± 0.19, near acceptable limits. LV stroke volume and ascending aorta net volume with 4D flow were also found to be significantly correlated (Figure 3; r = 0.71, p<0.001) but 4D flow net volumes were significantly less than cine stroke volumes (54.9 ± 11.2 ml/cycle vs 68.2 ± 13.4 ml/cycle; p<0.001).Discussion
The proposed non-navigated whole heart CS 4D flow protocol achieved approximately 5-minute scan times, a significant reduction from conventional whole-heart 4D flow imaging durations of 15-20 minutes. Overall image quality was adequate and allowed for efficient evaluation of whole heart CS 4D flow. 4D flow had highest self-consistency for comparisons where the imaging planes were spatially closest, suggesting potential residual background phase offsets and associated inaccuracies on flow quantification. Slow venous flow is sometimes difficult to visualize and larger differences in comparisons involving the pulmonary and caval veins may be due to poor vessel segmentation and underestimation. Net flow in the ascending aorta with 4D flow was moderately correlated with cine stroke volume, but with a significant underestimation that requires further investigation. This study was primarily limited by lack of a reference standard for vessels other than the aorta. Future studies are warranted with comparison to patient populations and comparison to RV stroke volumes and 2D flow.Conclusion
This study demonstrates the potential of fast, free-breathing, whole-heart 4D flow CS protocol, evaluated using regional blood flow self-consistency measures and comparison to conventional cine left ventricle stroke volume (SV) in a cohort of 21 healthy controls.Acknowledgements
Acknowledgements: Grant support by American Heart Association (AHA) 18SFRN34110170, NIHLBI F30HL137279References
1. Ma LE, Markl M, Chow K, et al. Aortic 4D flow MRI in 2 minutes using compressed sensing, respiratory controlled adaptive k‐space reordering, and inline reconstruction. Magnetic resonance in medicine. 2019;81(6):3675-3690.
2. Ma LE, Jin N, Chow K, et al. Highly accelerated 4D flow with compressed sensing for efficient evaluation of whole-heart hemodynamics. Proc of the International Society for Magnetic Resonance in Medicine; May 11-17, 2019; Montreal, Canada. 2019; #1995.
Figures